
 Click main image to view in full screen. Unlock all 16 preview images:
Coworking & Flex Office Financial Model – Excel XLSX
Excel (XLSX)


BENEFITS OF THIS DOWNLOADABLE EXCEL DOCUMENT
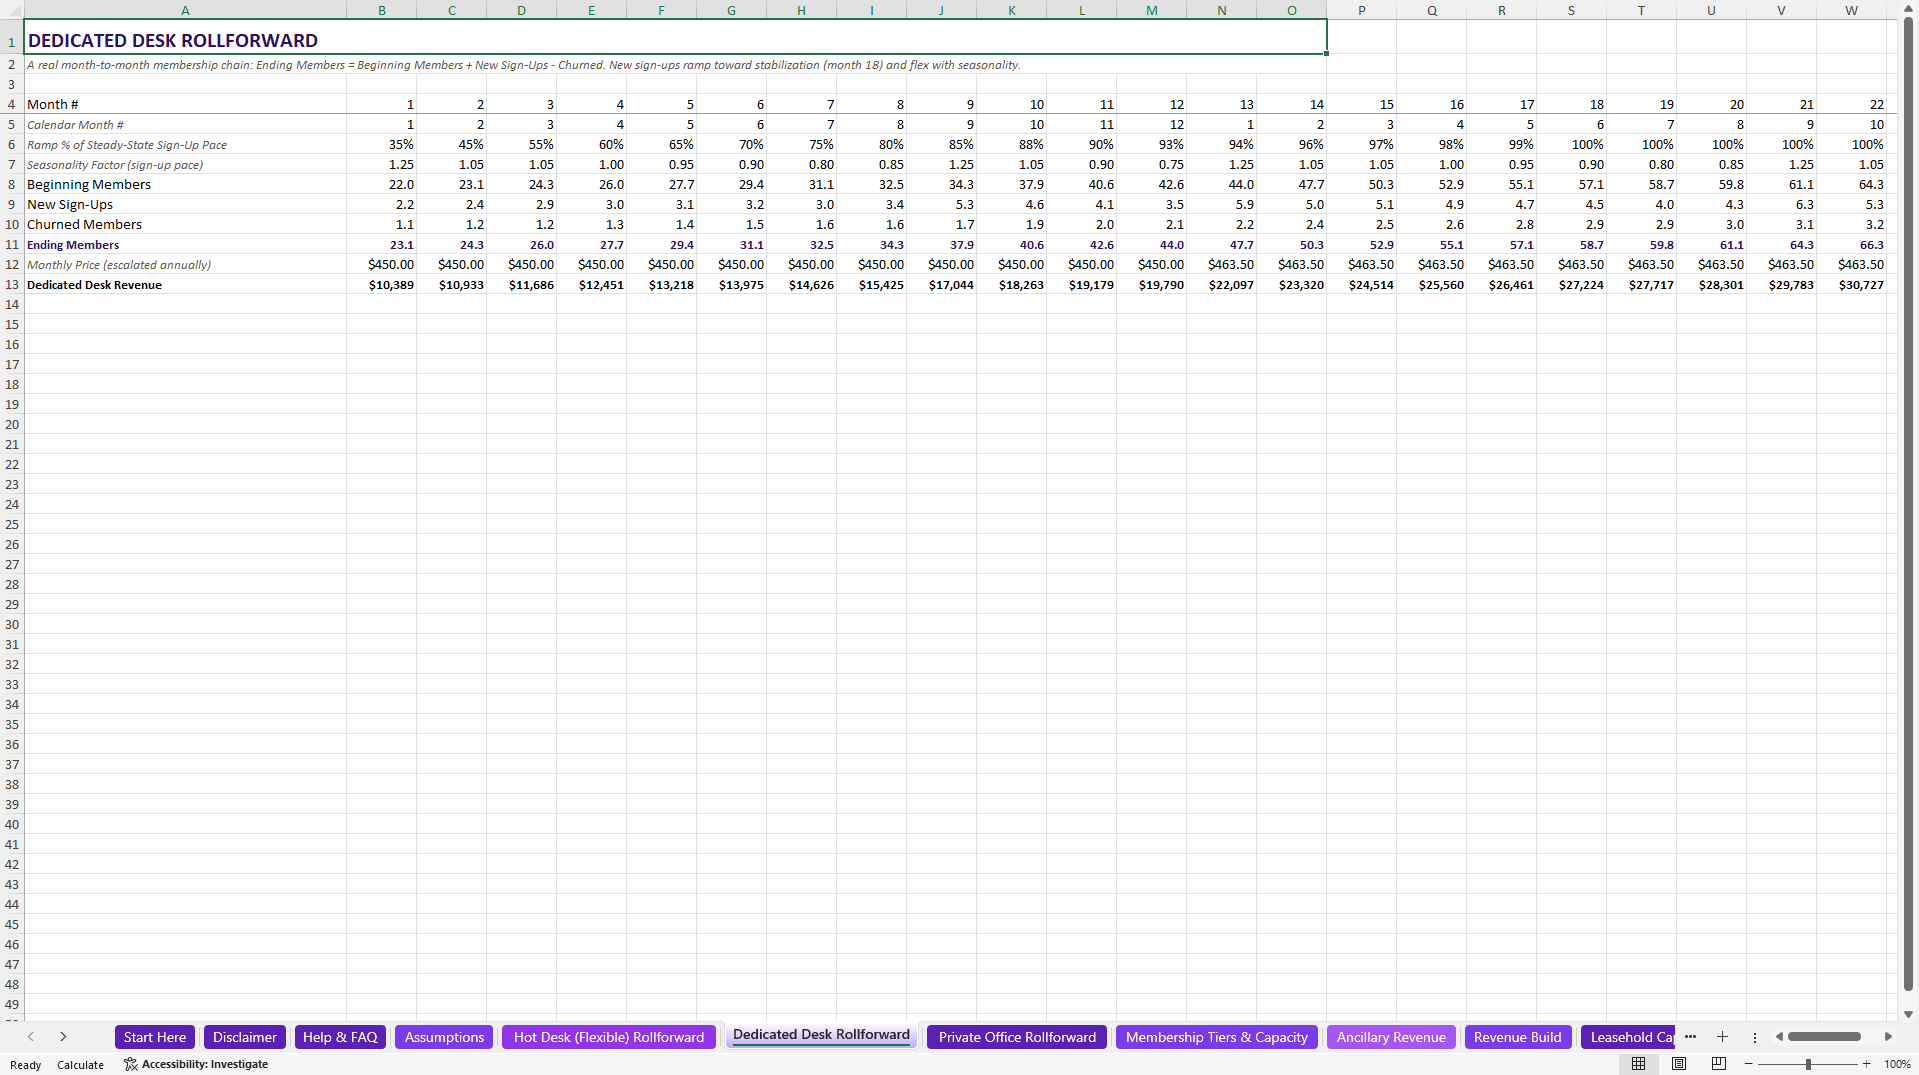
- Models 3 membership tiers (Hot Desk, Dedicated Desk, Private Office) as real month-to-month churn rollforwards.
- Includes Ancillary Revenue (meeting rooms, virtual mailbox, events, printing/coffee) as its own modeled line.
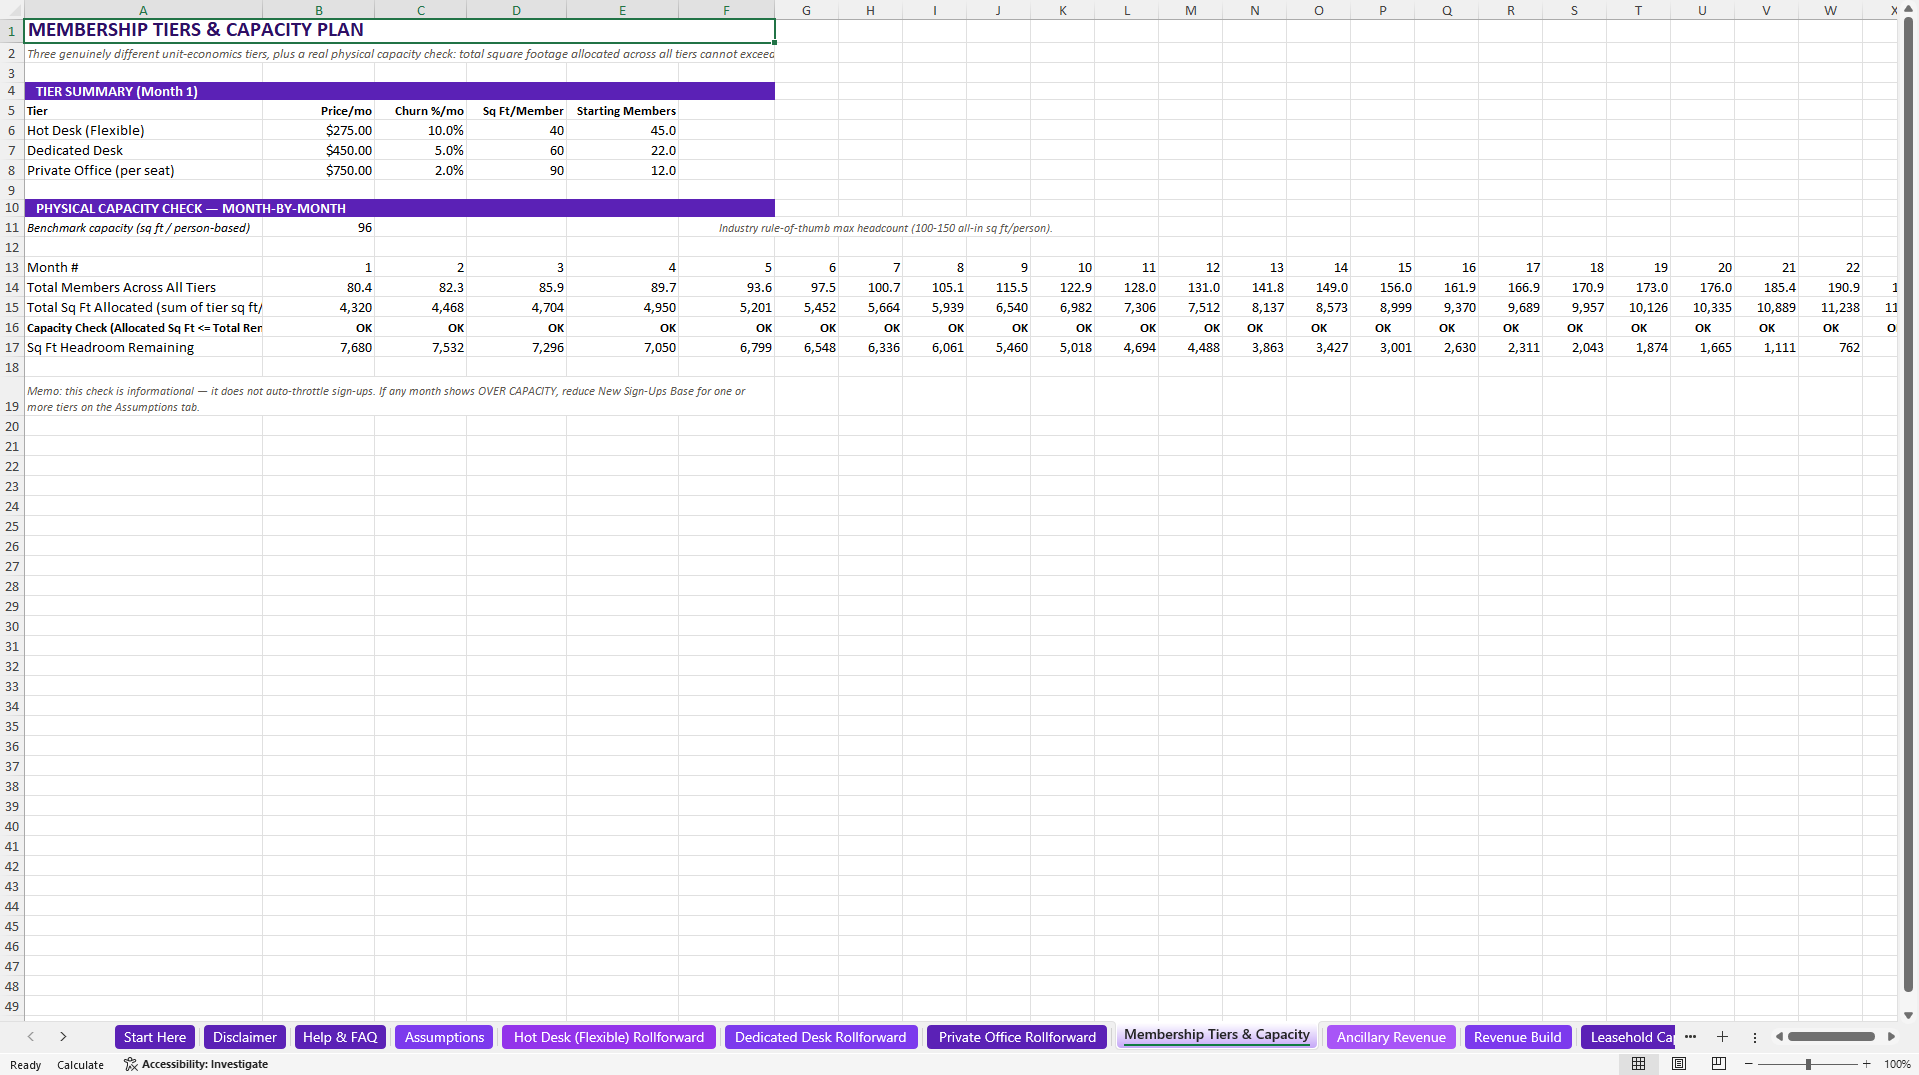
- Runs a live capacity check against the facility's actual leased square footage -- a check no competing template runs.
REAL ESTATE EXCEL DESCRIPTION
Most coworking financial templates track one blended "active customers times monthly fee" line and stop there – none of them check whether the membership count they're projecting would physically fit in the space.
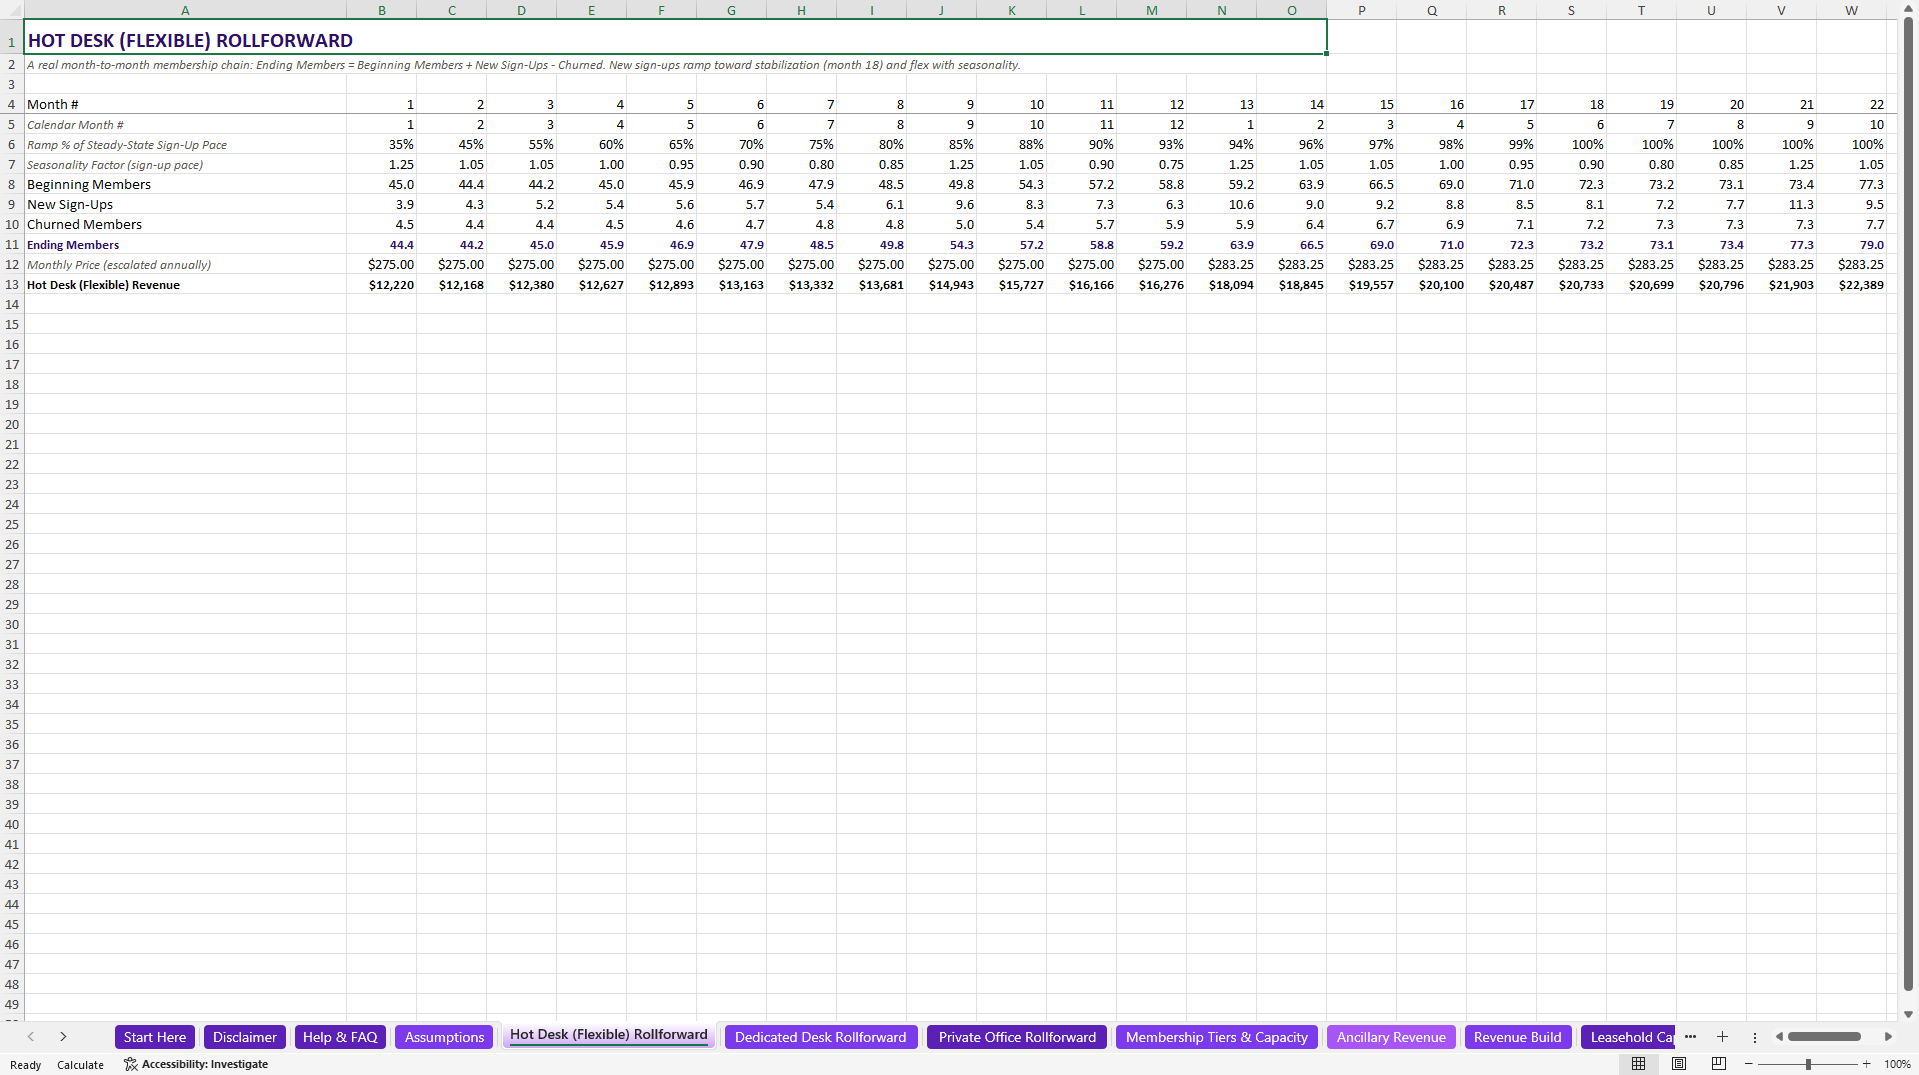
This model builds 3 separate membership tiers – Hot Desk, Dedicated Desk, and Private Office – as real month-to-month rollforwards (beginning members plus new signups minus churned equals ending members), each with its own price, churn rate, and square-footage footprint, then sums the result against the facility's actual leased square footage using the widely cited 100-150 sq ft per person all-in coworking density benchmark.
Occupancy ramps from opening toward stabilization on a seasonality-adjusted new-sign-up curve – stronger January and September back-to-work sign-up spikes, a slower December – the same lease-up mechanic used in real estate development modeling, adapted so seasonality adjusts the rate of new sign-ups rather than double-counting growth on the member-count stock. Because this business subleases or master-leases its space rather than owning real estate, the capital structure is leasehold-improvement CapEx financed by an SBA 7(a) loan plus an owner equity injection, not a ground-up construction loan.
Ancillary Revenue captures meeting room rental, virtual mailbox, event space, and printing/coffee, each with its own unit economics. The DSCR & Lender Ratios tab checks the exact ratio an SBA lender checks against the 1.25x minimum, and a 23-ratio Full Ratio Suite plus a DuPont ROE Decomposition go beyond DSCR alone.
Set facility size, tier pricing and churn, and lease terms on the Assumptions tab, and it flows through the three tier rollforwards, the Membership Tiers & Capacity Plan's live capacity check, Ancillary Revenue, and a full 3-statement model balance-checked every month, into DSCR & Lender Ratios, the Full Ratio Suite, a DuPont ROE Decomposition, and a Business Valuation & Exit tab with both a DCF and an EV/EBITDA cross-check plus owner IRR/MOIC.
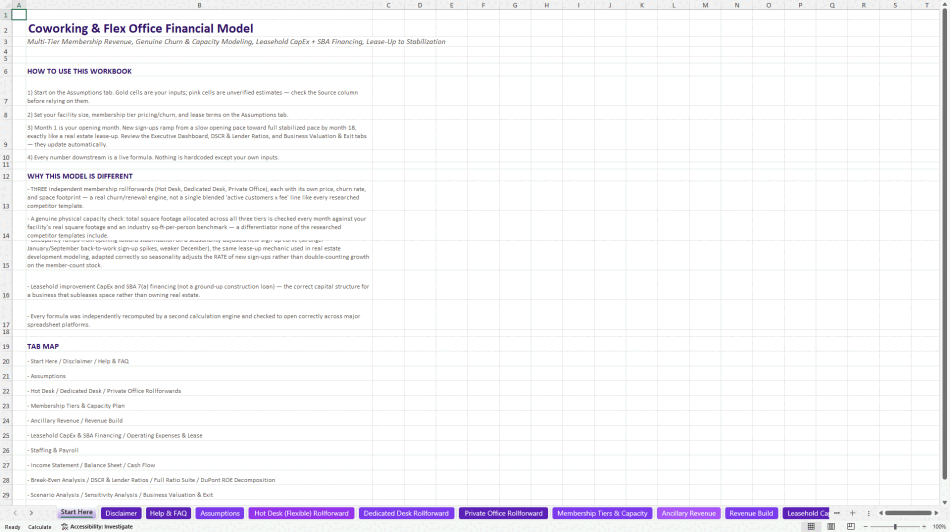
All 26 tabs
Change your core assumptions, and it flows through every downstream tab into a full Income Statement, Balance Sheet, and Cash Flow – then into DSCR & Lender Ratios, the Executive Dashboard, and every native chart.
Start Here – quick orientation before you touch anything
Disclaimer – what this model is and isn't
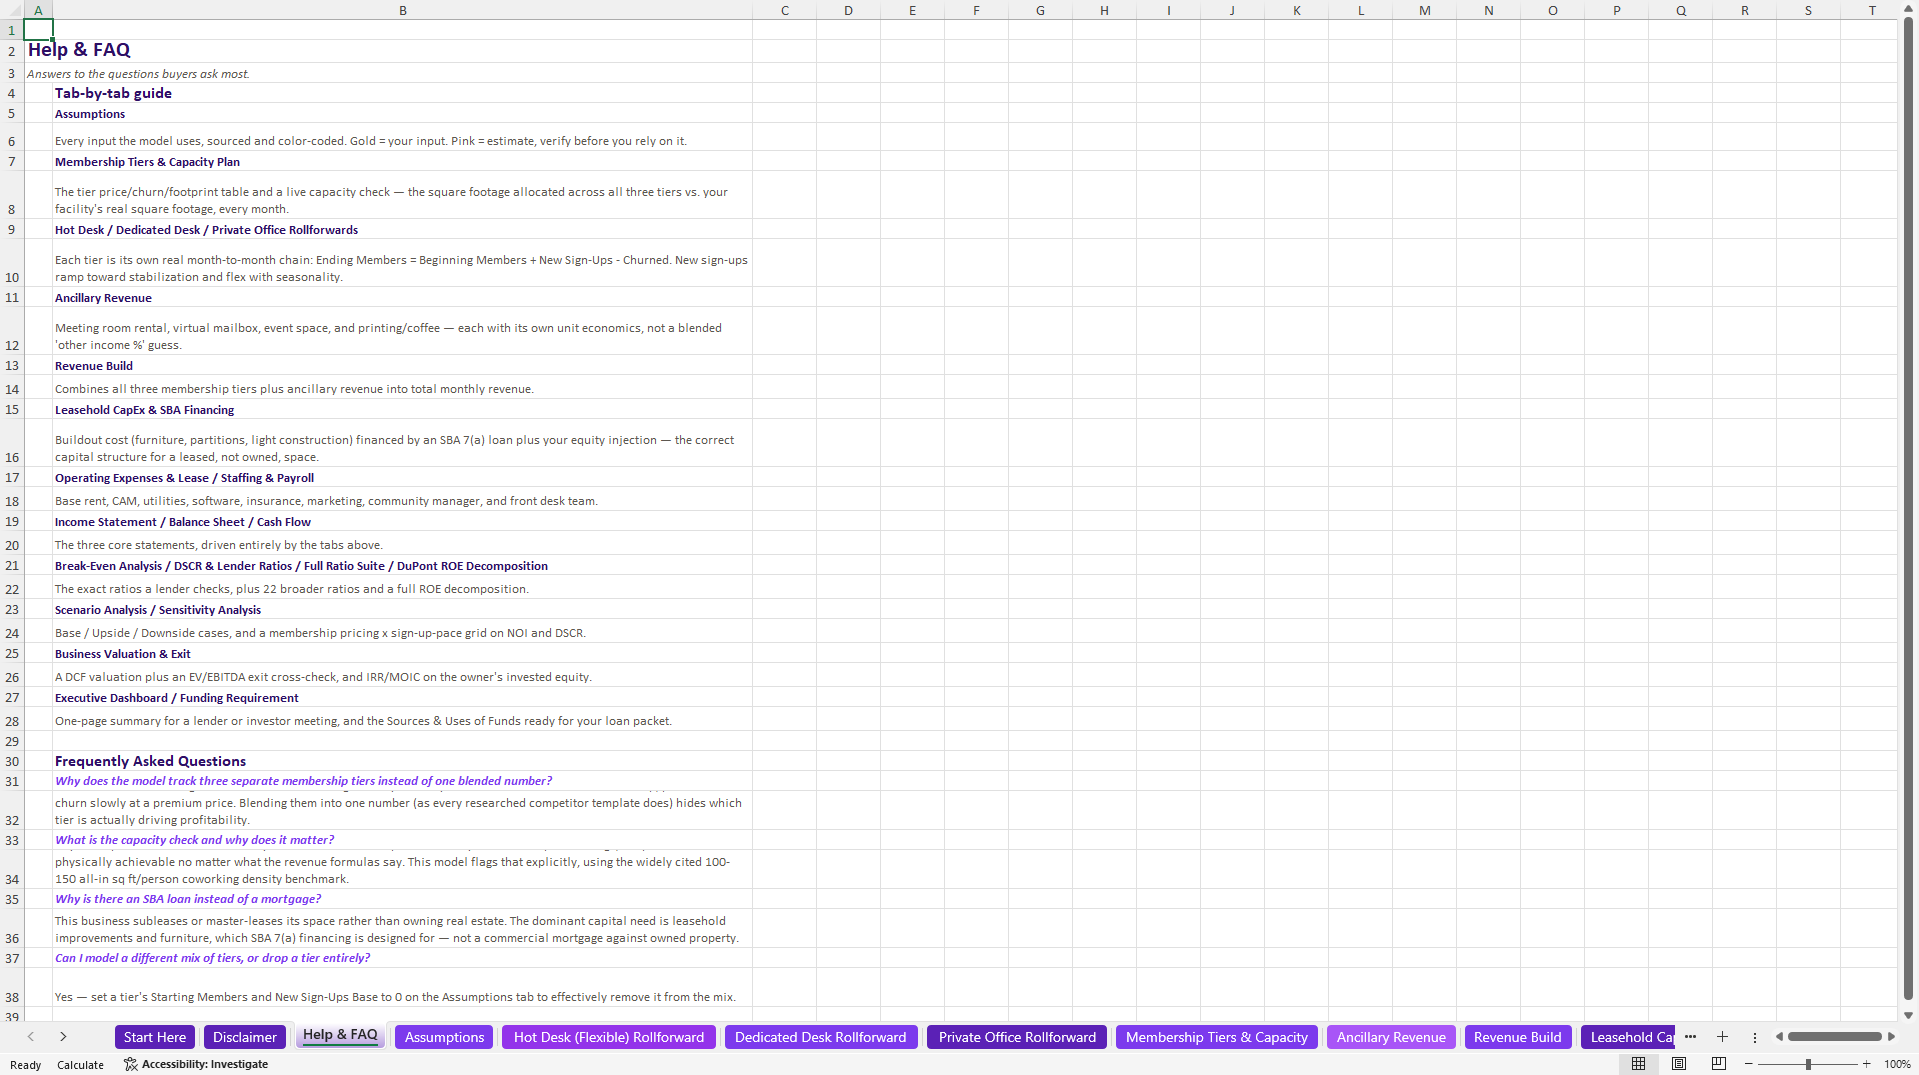
Help & FAQ – tab-by-tab guide and troubleshooting
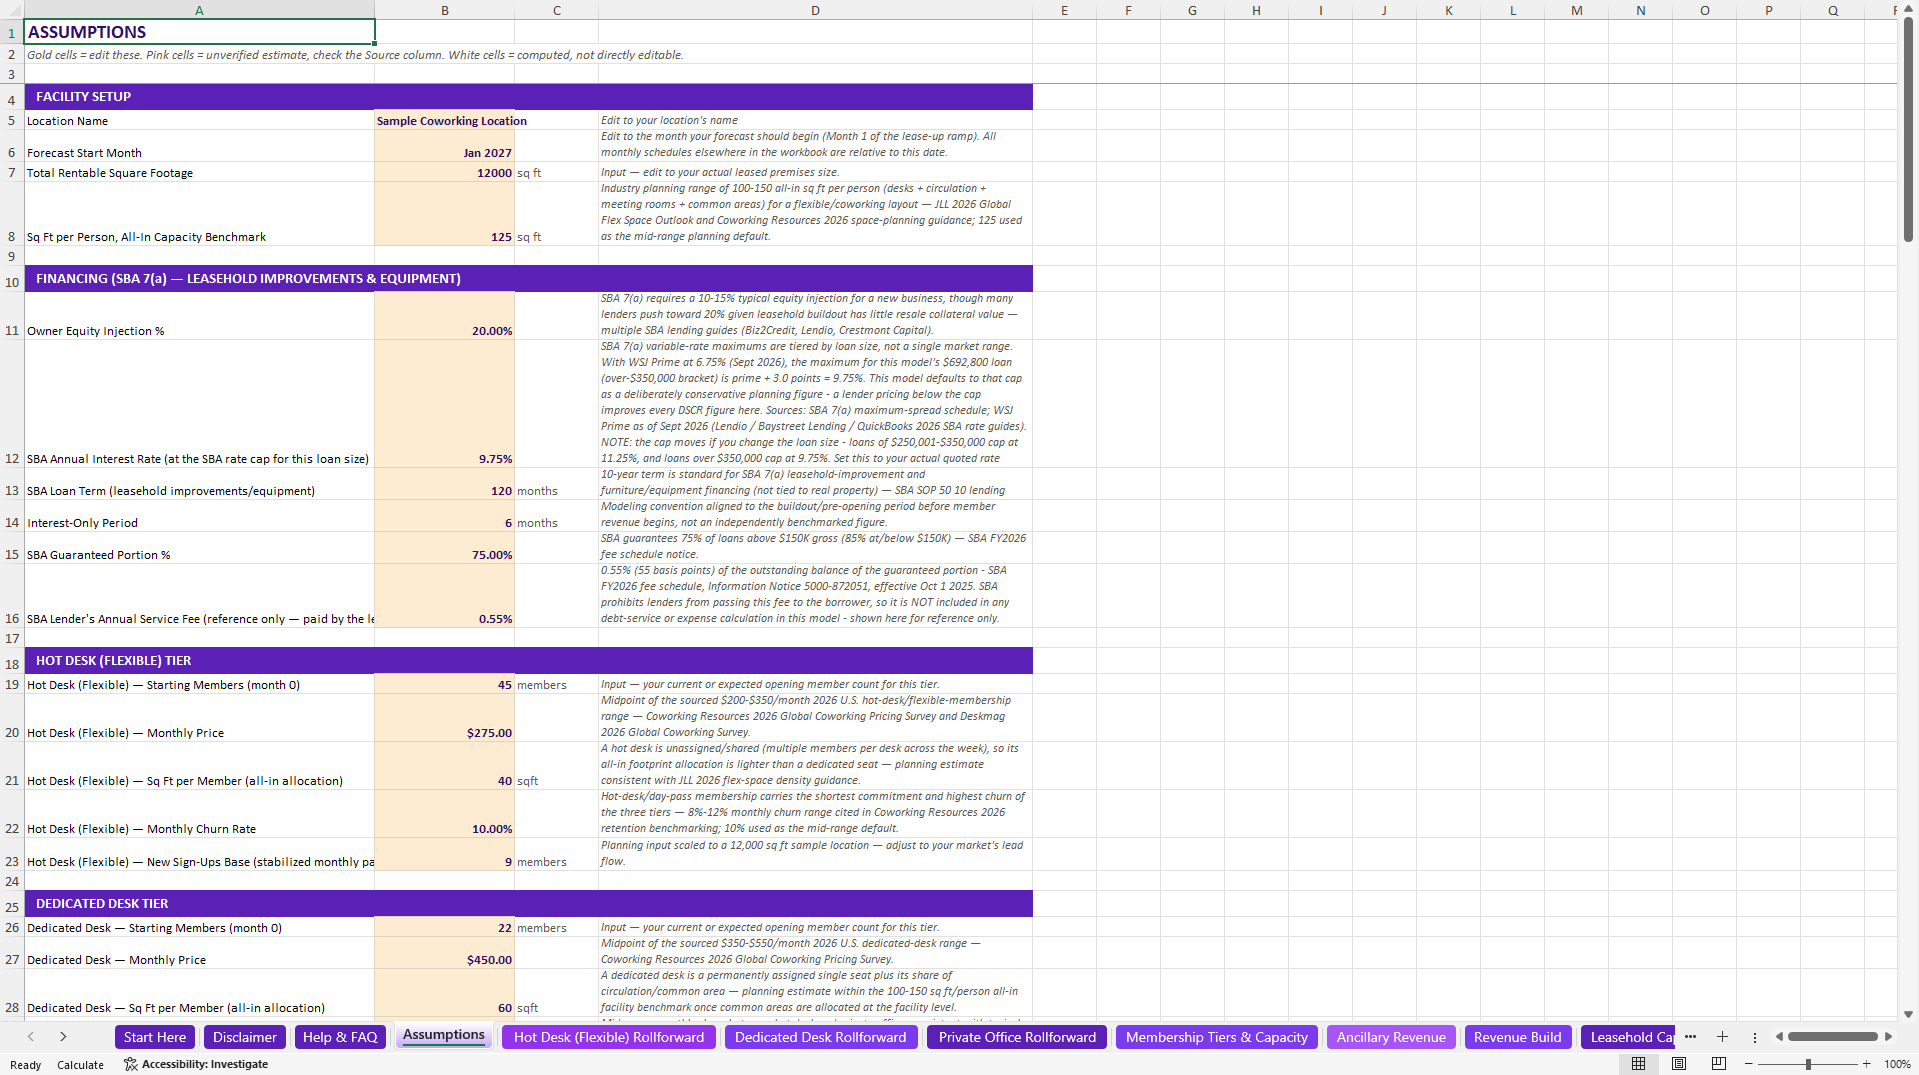
Assumptions – every input, sourced and color-coded for 2026
Hot Desk Rollforward – the flexible/day-pass tier's real month-to-month churn chain
Dedicated Desk Rollforward – the mid-price recurring-seat tier's churn chain
Private Office Rollforward – the highest-price, lowest-churn per-seat tier's churn chain
Membership Tiers & Capacity – tier summary plus a live month-by-month physical capacity check
Ancillary Revenue – meeting room rental, virtual mailbox, event space, and printing/coffee
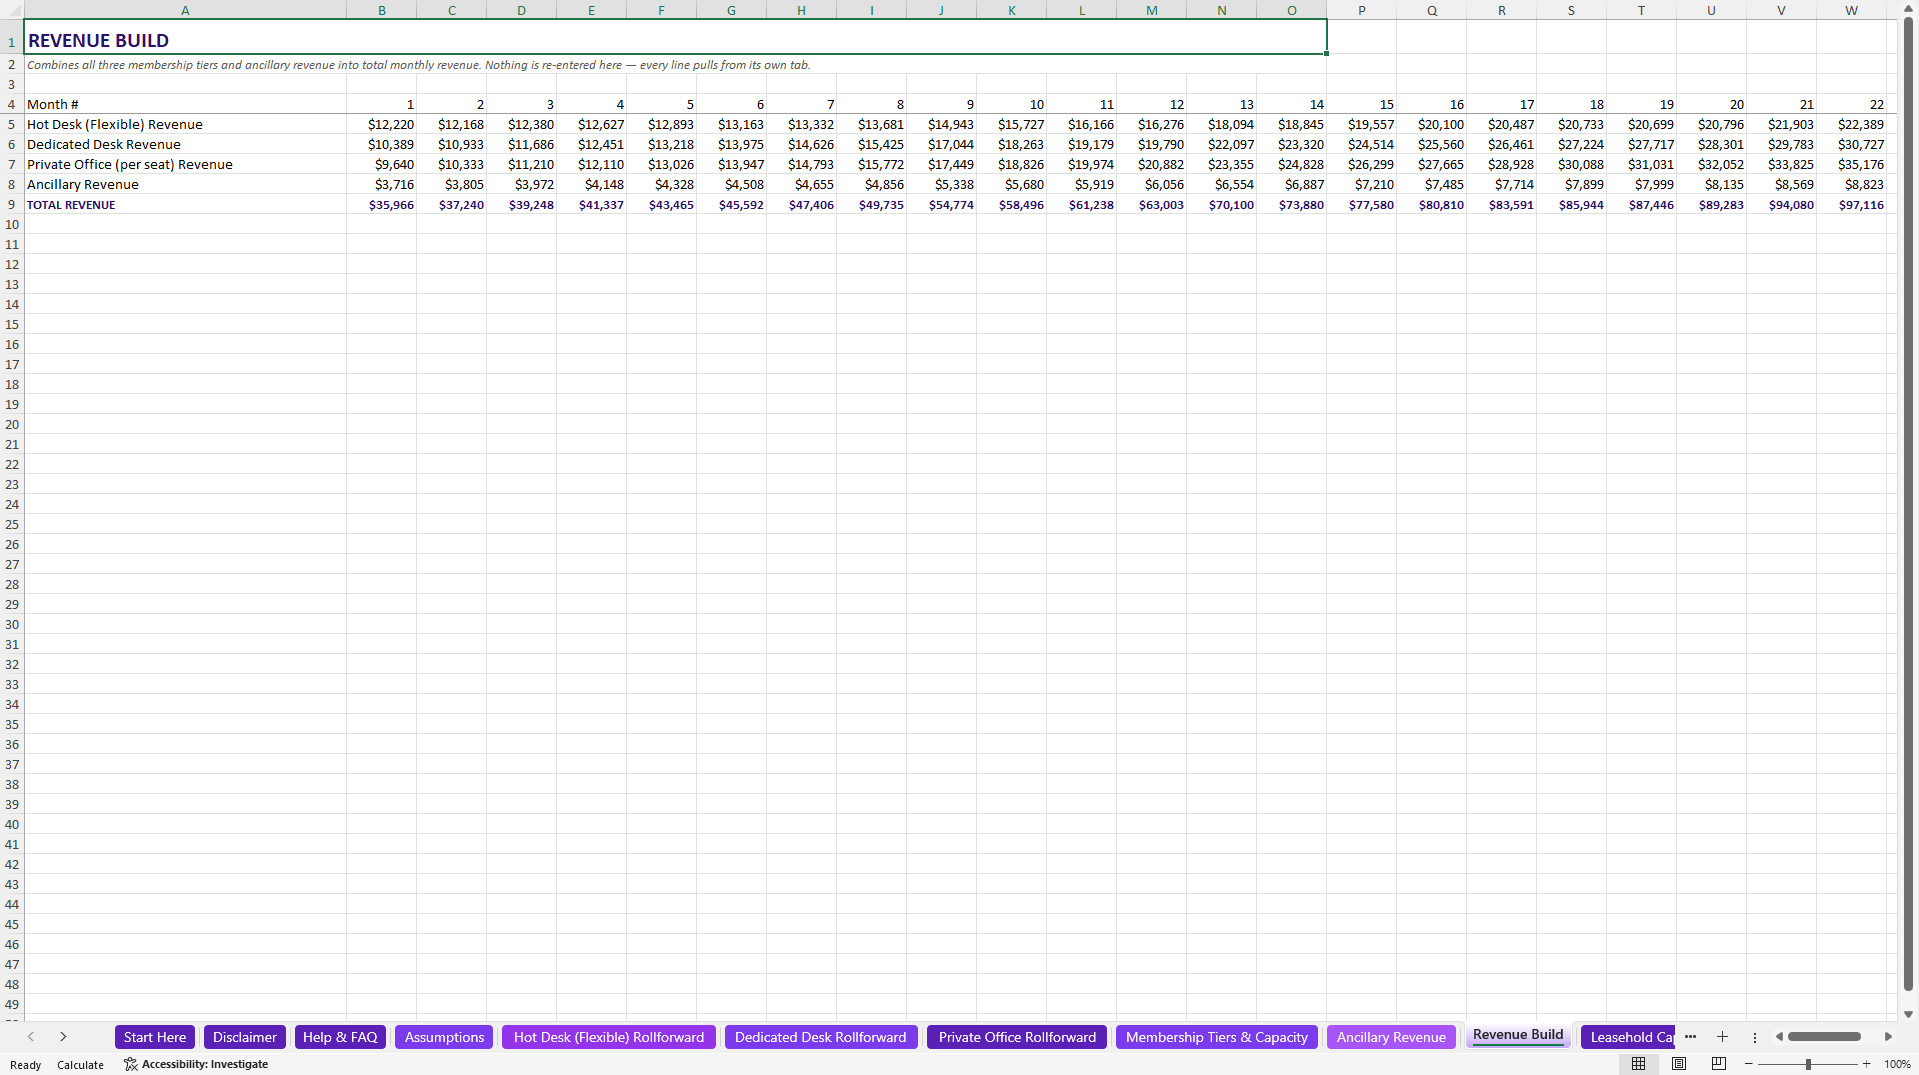
Revenue Build – combines all three tiers plus ancillary revenue into total monthly revenue
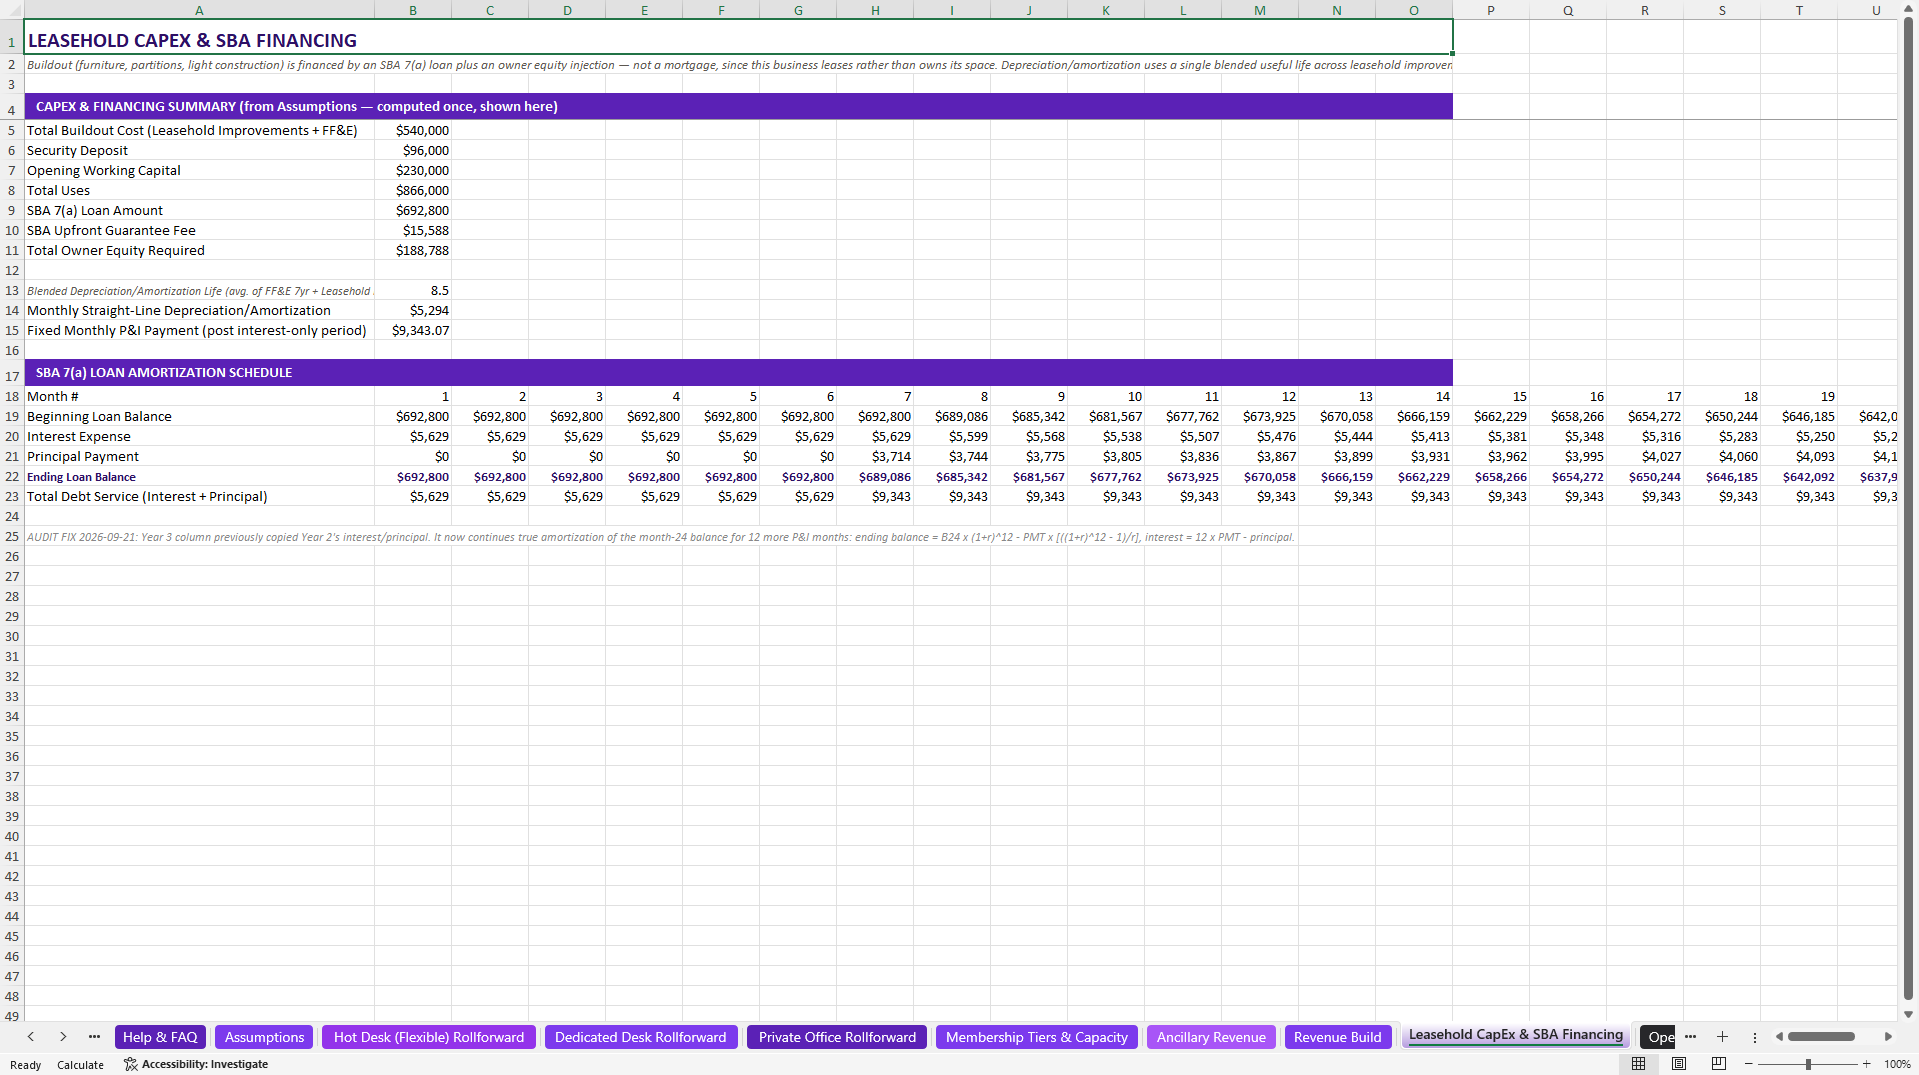
Leasehold CapEx & SBA Financing – buildout cost, blended depreciation/amortization, and the full SBA 7(a) loan schedule
Operating Expenses & Lease – base rent, CAM, utilities, software platform, insurance, marketing, lease escalation
Staffing & Payroll – BLS-sourced community manager and front-desk wages, payroll tax, and benefits load
Income Statement – the full monthly P&L across 24 months, plus Year 1/2/3 totals
Cash Flow – operating and financing activities, reconciled to the Balance Sheet every month
Balance Sheet – full monthly and annual detail, balance-checked every month
Break-Even Analysis – fixed vs. variable costs and the break-even member count
DSCR & Lender Ratios – the exact ratio an SBA lender checks against the 1.25x minimum
Full Ratio Suite – 23 liquidity, leverage, profitability, and efficiency ratios
DuPont ROE Decomposition – margin × turnover × leverage, broken apart
Scenario Analysis – Base/Upside/Downside cases with editable revenue adjustments
Sensitivity Analysis – a sign-up-pace × price grid on both EBITDA and DSCR
Business Valuation & Exit – DCF with terminal value, an EV/EBITDA exit cross-check, and owner IRR/MOIC
Executive Dashboard – one page for a lender meeting: revenue, EBITDA, DSCR, capacity, and returns
Funding Requirement – sources & uses, ready to drop into your SBA loan packet
Settings – currency, color legend, tab map
Every price, wage, and financing rate is sourced to 2026 industry surveys and BLS wage data. Built as a native .xlsx, verified across Excel, Google Sheets, LibreOffice, WPS, ONLYOFFICE, and more.
Got a question about the product? Email us at support@flevy.com or ask the author directly by using the "Ask the Author a Question" form. If you cannot view the preview above this document description, go here to view the large preview instead.
Source: Best Practices in Real Estate, Financial Modeling Excel: Coworking & Flex Office Financial Model Excel (XLSX) Spreadsheet, WebsiteGeek
ABOUT THE AUTHOR

WebsiteGeek offers free website tools, SEO suites, file converters, browser extensions, calculators, and image utilities built to supercharge your productivity.
We also builds practical digital tools and templates for small business owners -- real formulas and sourced data.
Ask the Author a Question
You must be logged in to contact the author.




























