


Hydroponics Startup/Existing Business Financial Projection 3 Statement Analysis – Excel XLSX
Excel (XLSX) + Excel (XLSX)
BENEFITS OF THIS DOWNLOADABLE EXCEL DOCUMENT
- Prepartion of a 5 year 3 statement (Income Statement, Balance Sheet, Cash Flow Statement) Financial Projection Model for a new or existing hydroponics business.
AGRICULTURE INDUSTRY EXCEL DESCRIPTION
A financial model is vital for a hydroponics business as it provides a structured projection of revenue, costs, and profitability. It helps in making informed decisions by assessing potential risks, estimating cash flows, and optimizing resource allocation. Through scenario analysis, it aids in identifying growth opportunities and potential challenges, enhancing strategic planning. Additionally, investors and stakeholders gain confidence in the business's viability, attracting funding. Overall, a robust financial model assists in achieving sustainable growth, effective resource management, and successful navigation of the hydroponic farming industry's complexities.
PURPOSE OF MODEL
Highly versatile and user-friendly Excel model for the preparation a of 5-year rolling 3 statement (Income Statement, Balance Sheet and Cash flow Statement) financial projection with a monthly timeline for a startup or existing hydroponics business generating revenue by growing plants or vegetables without soil, by using mineral nutrient solutions in an aqueous solvent.
The Excel financial model allows the hydroponic farm operator to model up to 10 produce categories and 10 variable costs categories, as well as other income, staff costs, other operating costs, fixed assets and borrowings.
The model follows good practice financial modelling principles and includes instructions, line item explanations, checks and input validations and incorporates a discounted cash flow valuation calculation using the projected cash flows.
KEY OUTPUTS
The key outputs include:
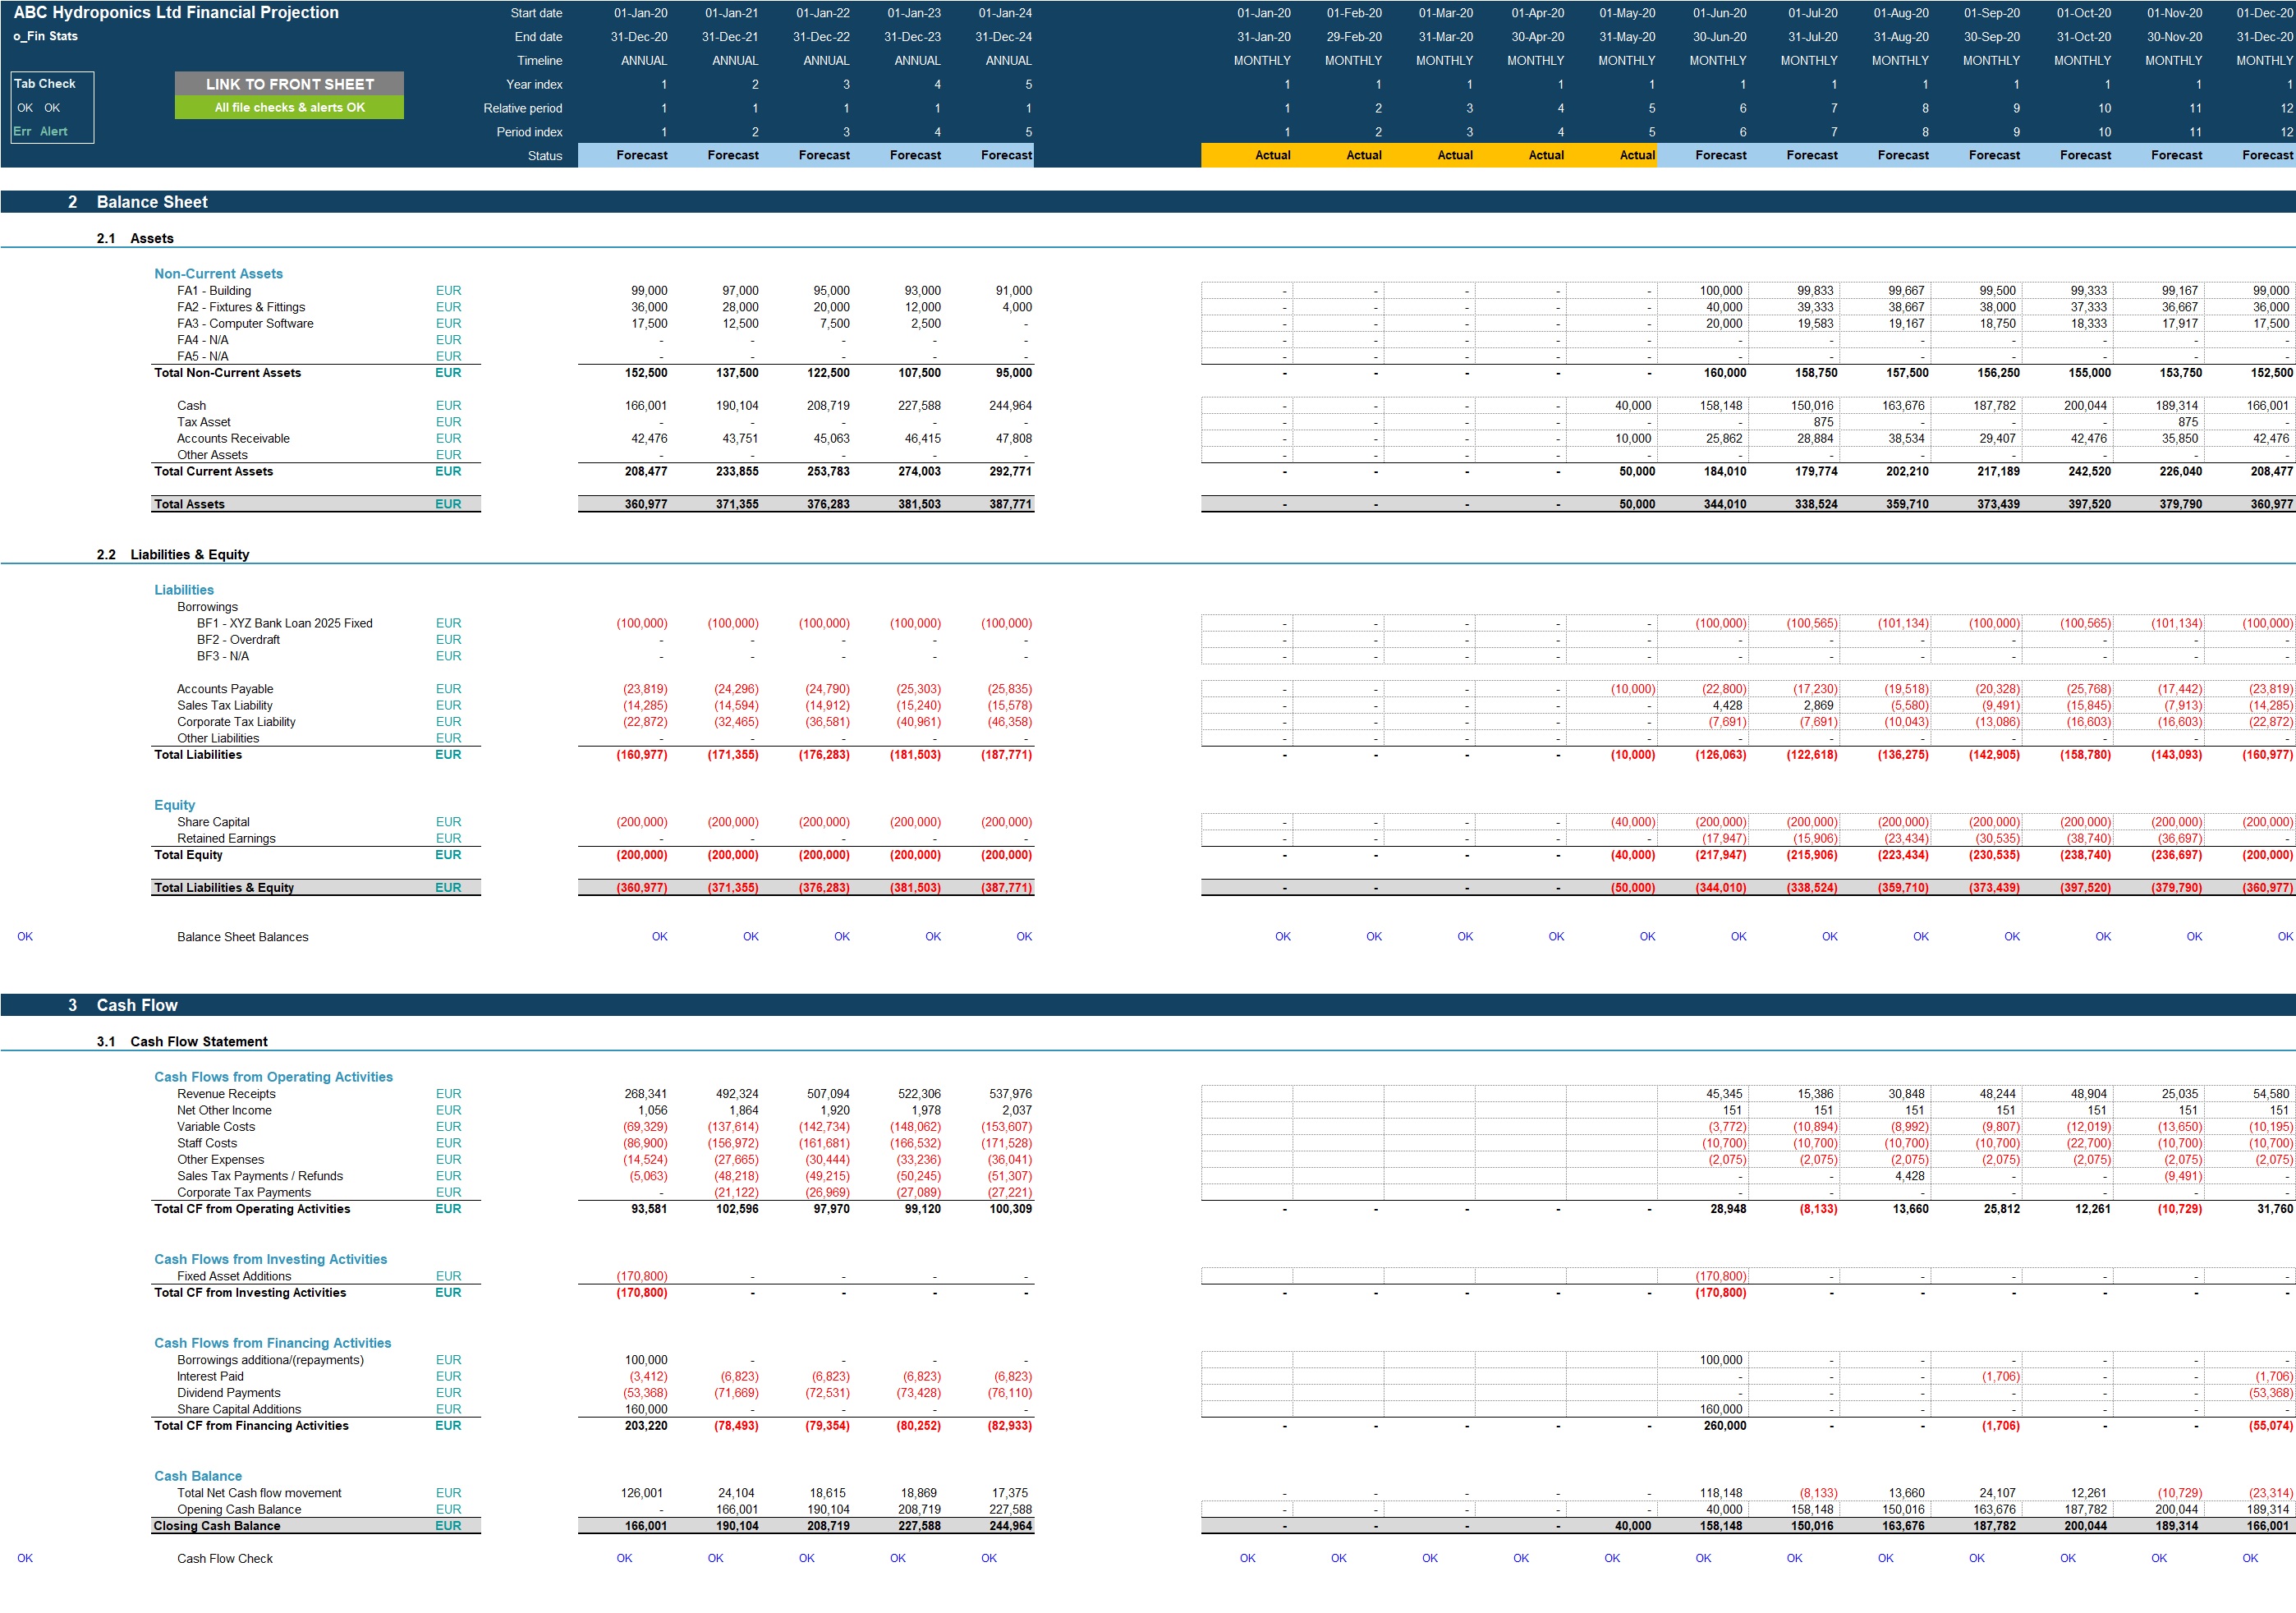
• Projected full financial statements (Income Statement, Balance Sheet and Cash flow Statement) presented on a monthly basis across up to 5 years and summaris3333ed on an annual basis.
• Dashboard with:
Summarised projected Income Statement and Balance Sheet;
Compounded Annual Growth Rate (CAGR) for each summarised income statement and balance sheet line item;
List of key ratios including average revenue growth, average profit margins, average return on assets and equity and average Debt to Equity ratio;
Bar charts summarising income statement and balance sheet projections;
Revenue, gross profit margin by produce category presented in a table, pie-chart and bar-chart format
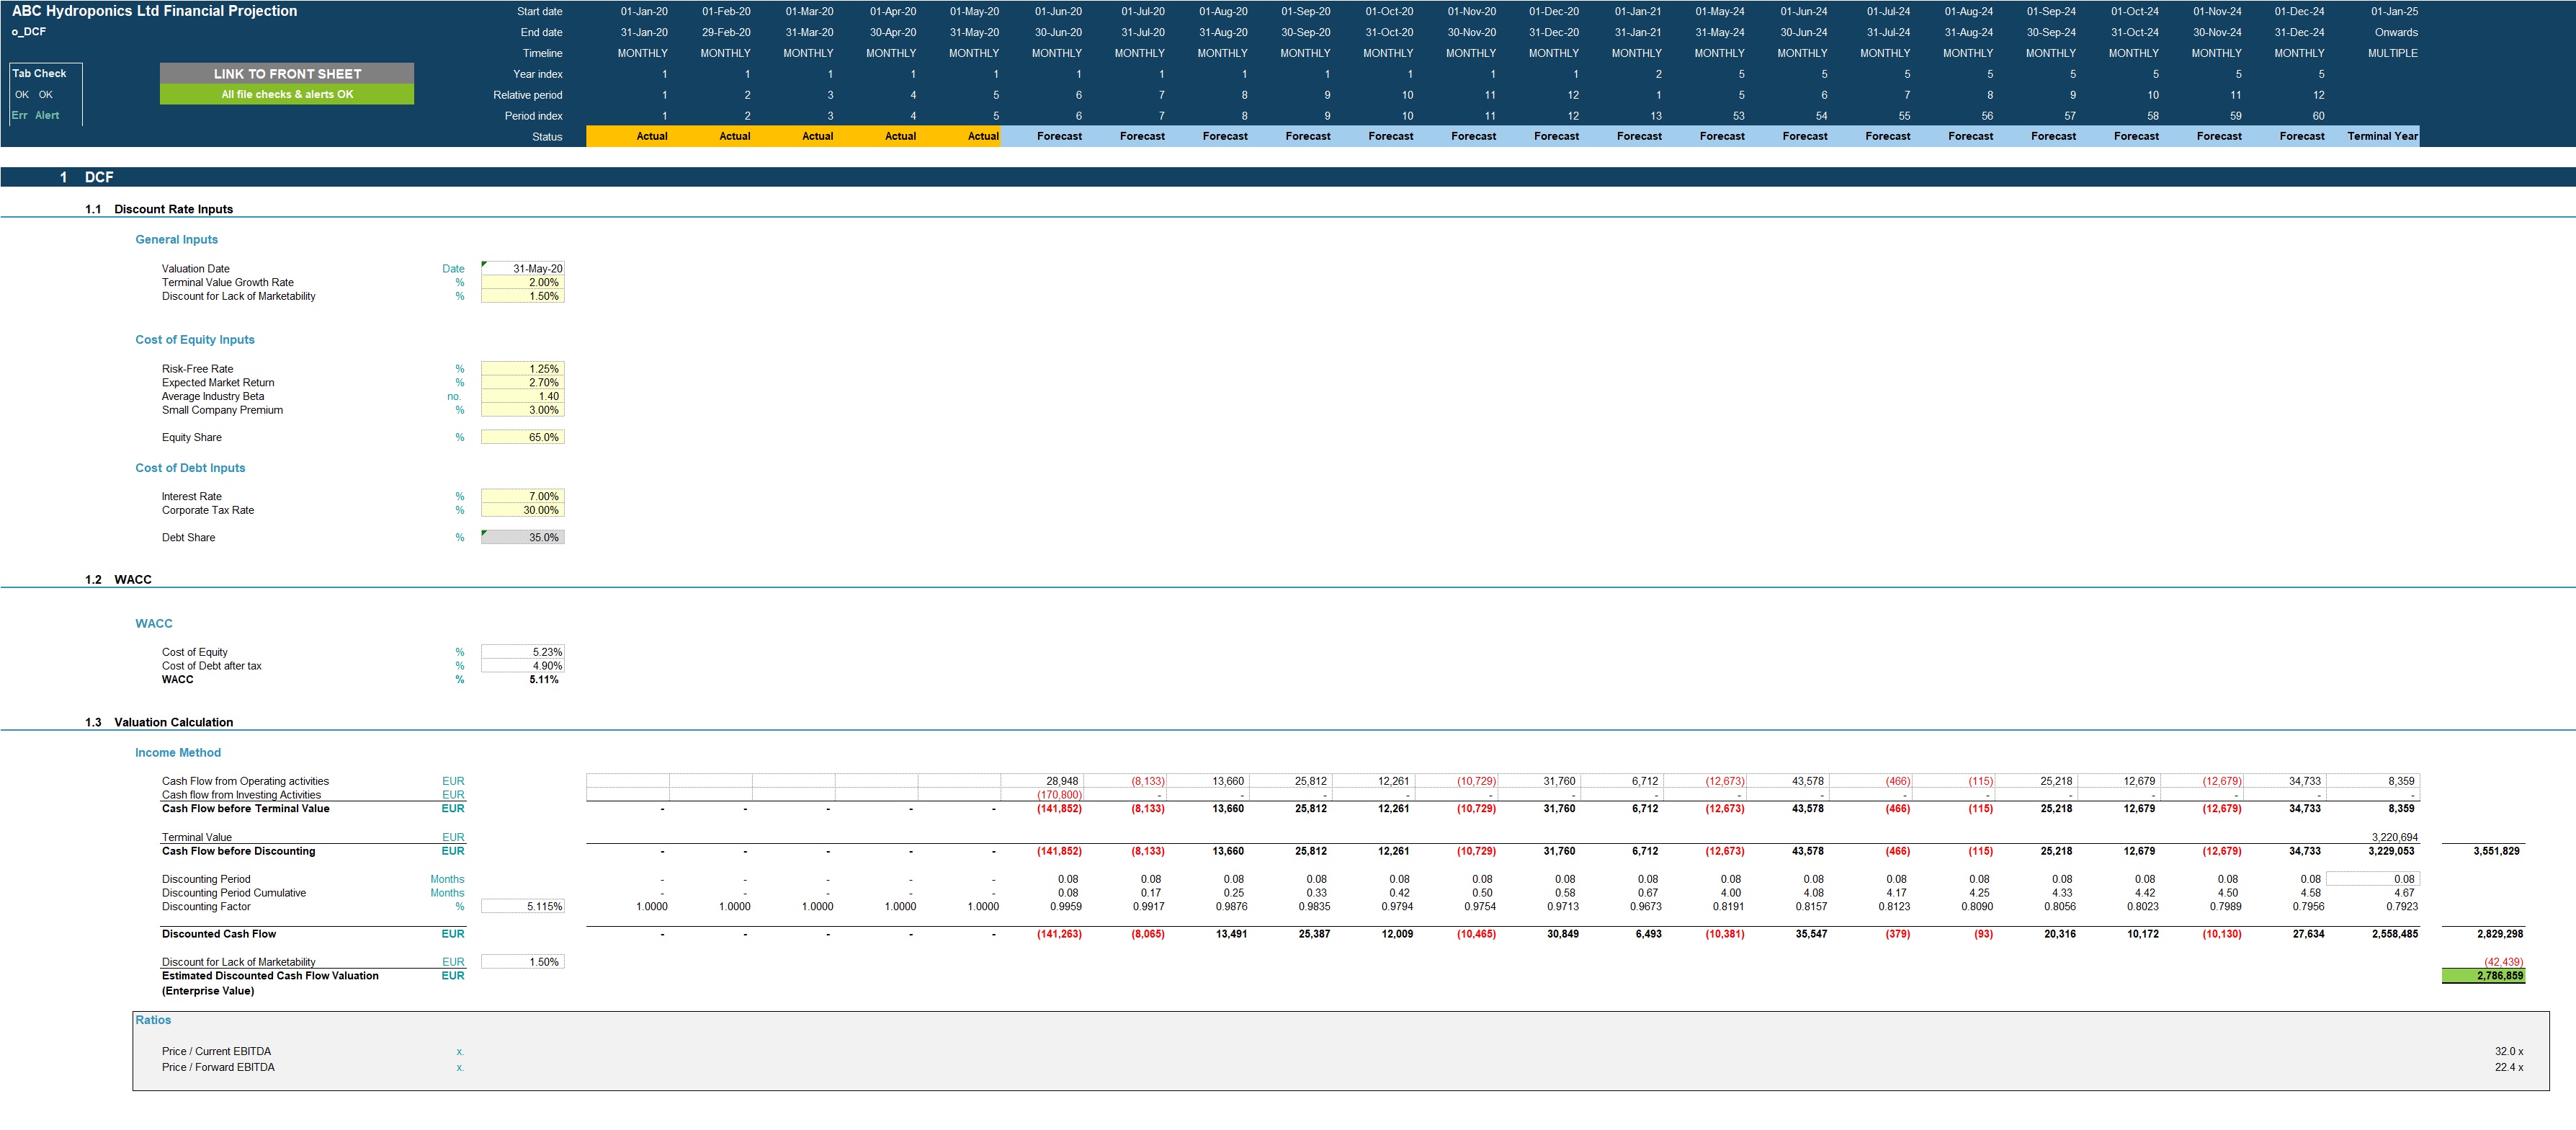
• Discounted cash flow valuation using the projected cash flow output.
KEY INPUTS
Inputs are split into income statement and balance sheet Inputs. Most inputs include user-friendly line item explanations and input validations to help users understand what the input is for and populate correctly.
Setup Inputs:
• Name of hydroponics farming business;
• Currency;
• First projection year and month;
• Naming for produce categories, variable cost categories, staff costs, operating costs, fixed assets and borrowings;
• Sales tax applicability for produce categories, variable costs, other expenses and fixed assts.
Actuals Inputs:
• Opening balance sheet (for existing businesses);
• Income Statement actuals (for trend analysis);
Projection Inputs:
• Produce revenue inputs including square meters used, plants per square meter, Yield per square meter, harvests per year and price per kg;
• Variable cost inputs including cost per square meter or per kg produced or per kg sold or per plant;
• Staff cost inputs including staff numbers, average salary per full time position, average employer's social security percentage of salary, average annual bonus and bonus payment months;
• Other operating cost inputs;
• Sales and corporate tax inputs including rate and payment periods;
• Dividend inputs including amount (percentage of retained earnings) and frequency;
• Fixed assets including addition amounts and useful life;
• Borrowings including addition amounts and interest rate;
• Share capital additions;
• Discount rate inputs (for valuation calculation).
MODEL STRUCTURE
The model comprises of 9 tabs split into input ('i_'), calculation ('c_'), output ('o_') and system tabs. The tabs to be populated by the user are the input tabs ('i_Setup', ‘i_Actuals' and 'i_Assumptions'). The calculation tab uses the user-defined inputs to calculate and produce the projection outputs which are presented in 'o_Fin Stats', ‘o_Charts' and ‘o_DCF'.
System tabs include:
• A 'Front Sheet' containing a disclaimer, instructions and contents;
• A checks dashboard containing a summary of checks by tab.
KEY FEATURES
Other key features of this model include the following:
• The model follows good practice financial modelling guidelines and includes instructions, line item explanations, checks and input validations;
• The model contains a flexible timeline that allows for a mix of actual and forecast period across a 5-year period. This allows projections to be easily rolled forward as forecast periods become actual period;
• Timeline is split on a monthly basis and summarised on an annual basis;
• The model allows the user to model up to 10 produce categories with their own unique variable cost setup;
• The model is not password protected and can be modified as required following download;
• The model is reviewed using specialised model audit software to help reduce risk of formula inconsistencies;
• The model allows for the following number of underlying categories for each line item (these can be easily expanded if required):
Produce categories – 10 categories;
Variable costs – 10 categories;
Other Income – 3 categories;
Staff costs – 8 categories;
Admin expenses – 15 categories;
Fixed assets – 5 categories;
Borrowings – 3 facilities
• Apart from projecting revenue and costs the tool includes the possibility to model receivables and payables, fixed assets, borrowings, dividends and corporate tax;
• Business name, currency, starting projection period are fully customisable;
• Revenue, cost and fixed asset descriptions are fully customisable;
• The model included an integrated discounted cash flow valuation using the projected cash flow outputs;
• The model includes instructions, line item explanations, checks and input validations to help ensure input fields are populated accurately;
• The model includes a checks dashboard which summarises all the checks included in the various tabs making it easier to identify any errors.
Got a question about the product? Email us at support@flevy.com or ask the author directly by using the "Ask the Author a Question" form. If you cannot view the preview above this document description, go here to view the large preview instead.
Source: Best Practices in Agriculture Industry, Integrated Financial Model Excel: Hydroponics Startup/Existing Business Financial Projection 3 Statement Analysis Excel (XLSX) Spreadsheet, Projectify
ABOUT THE AUTHOR
We are financial modelling professionals, accountants and CFA charterholders with experience working within Deloitte supporting clients with their financial planning and decision support needs. Our aim is to provide robust and easy-to-use financial models that follow good practice financial modelling guidelines and assist individuals and businesses with key financial planning and analysis ... [read more]
Ask the Author a Question
You must be logged in to contact the author.
