

Consulting Firm 5-Year 3 Statement Financial Model – Excel XLSX
Excel (XLSX)
BENEFITS OF THIS DOWNLOADABLE EXCEL DOCUMENT
- Provides a fully linked 3-statement financial model purpose-built for consulting firms seeking investor-ready projections.
- Delivers a dynamic 5-year forecast framework adaptable to the unique billing rate and utilization economics of your consulting business.
- Offers a professional-grade Excel template for building accurate Income Statement, Balance Sheet, and Cash Flow projections specific to your firm.
CONSULTING TRAINING EXCEL DESCRIPTION
Curated by McKinsey-trained Executives
3-Statement Financial Model for Consulting Firms – Excel Template (Instant Download)
The #1 Excel Financial Model Built Exclusively for Consulting Firms. 5-Year Forecast. Fully Linked. Zero Formula Errors. Used by Finance Professionals, Boutique Consultancies, and Strategy Firms Worldwide.
⚡ STOP Wasting Hours Building Financial Models From Scratch
If you're a consultant, CFO, finance manager, or business owner running a consulting firm, you already know the pain:
• Staring at a blank spreadsheet at midnight before an investor meeting
• Manually linking Income Statements to Balance Sheets – and breaking everything
• Rebuilding the same model over and over for every new client or firm
• Paying $500/hour for a financial analyst to do what a great template does in minutes
That ends today.
This is the most complete, most professionally designed, most instantly deployable 3-Statement Financial Model for Consulting Firms available anywhere – and it's ready to use the moment you download it.
💼 What Is This Financial Model?
This is a battle-tested, fully dynamic Excel financial model built from the ground up for professional services and consulting businesses. It includes every financial statement you need – Income Statement, Balance Sheet, and Cash Flow Statement – 100% cross-linked and formula-driven, with a 5-year annual forecast, a driver-based Assumptions engine, and a visual KPI Dashboard.
Whether you run a management consulting firm, strategy boutique, IT consulting practice, HR consulting company, financial advisory firm, or engineering consultancy, this model was built for you.
🗂️ FULL CONTENTS OF THE FILE
📋 TAB 1 – ASSUMPTIONS (The Control Panel)
*Change one number. Watch the entire model update instantly.*
This is where all 38 model inputs live – cleanly organized, color-coded blue so you always know what to edit.
Revenue Drivers:
• Senior Consultant Headcount (Years 1–5)
• Junior Consultant Headcount (Years 1–5)
• Admin / Support Staff Headcount (Years 1–5)
• Senior Consultant Billing Rate ($/hr)
• Junior Consultant Billing Rate ($/hr)
• Available Billable Hours per Consultant per Year (2,080 default)
• Utilization Rate (%) – highlighted in yellow as a key scenario lever
• Number of Retainer Clients per Year
• Monthly Retainer Fee per Client ($)
Cost Drivers:
• Senior Consultant Annual Salary ($)
• Junior Consultant Annual Salary ($)
• Admin Staff Annual Salary ($)
• Employee Benefits as % of Total Salary (highlighted yellow)
• Subcontractor COGS as % of Revenue
• Travel & Entertainment as % of Revenue
• Marketing & Business Development as % of Revenue
• Annual Office Rent ($)
• Annual Software & Subscriptions ($)
• Annual Other Overhead ($)
• Annual Capital Expenditures ($) by year
Fixed Model Parameters (single inputs applied across all 5 years):
• Corporate Tax Rate (highlighted yellow – key scenario input)
• Useful Life of Fixed Assets (years, for straight-line depreciation)
• Interest Rate on Debt (highlighted yellow)
• Opening Debt – Year 0 ($)
• Annual Debt Repayment ($)
• Opening Cash – Year 0 ($)
• Opening Common Stock / Paid-in Capital ($)
• Days Sales Outstanding – DSO (for AR calculation)
• Days Payable Outstanding – DPO (for AP calculation)
• Accrued Salary Days
• Prepaid Expenses as % of Total OpEx
38 total inputs. Zero hardcoded values outside this tab. Full scenario flexibility.
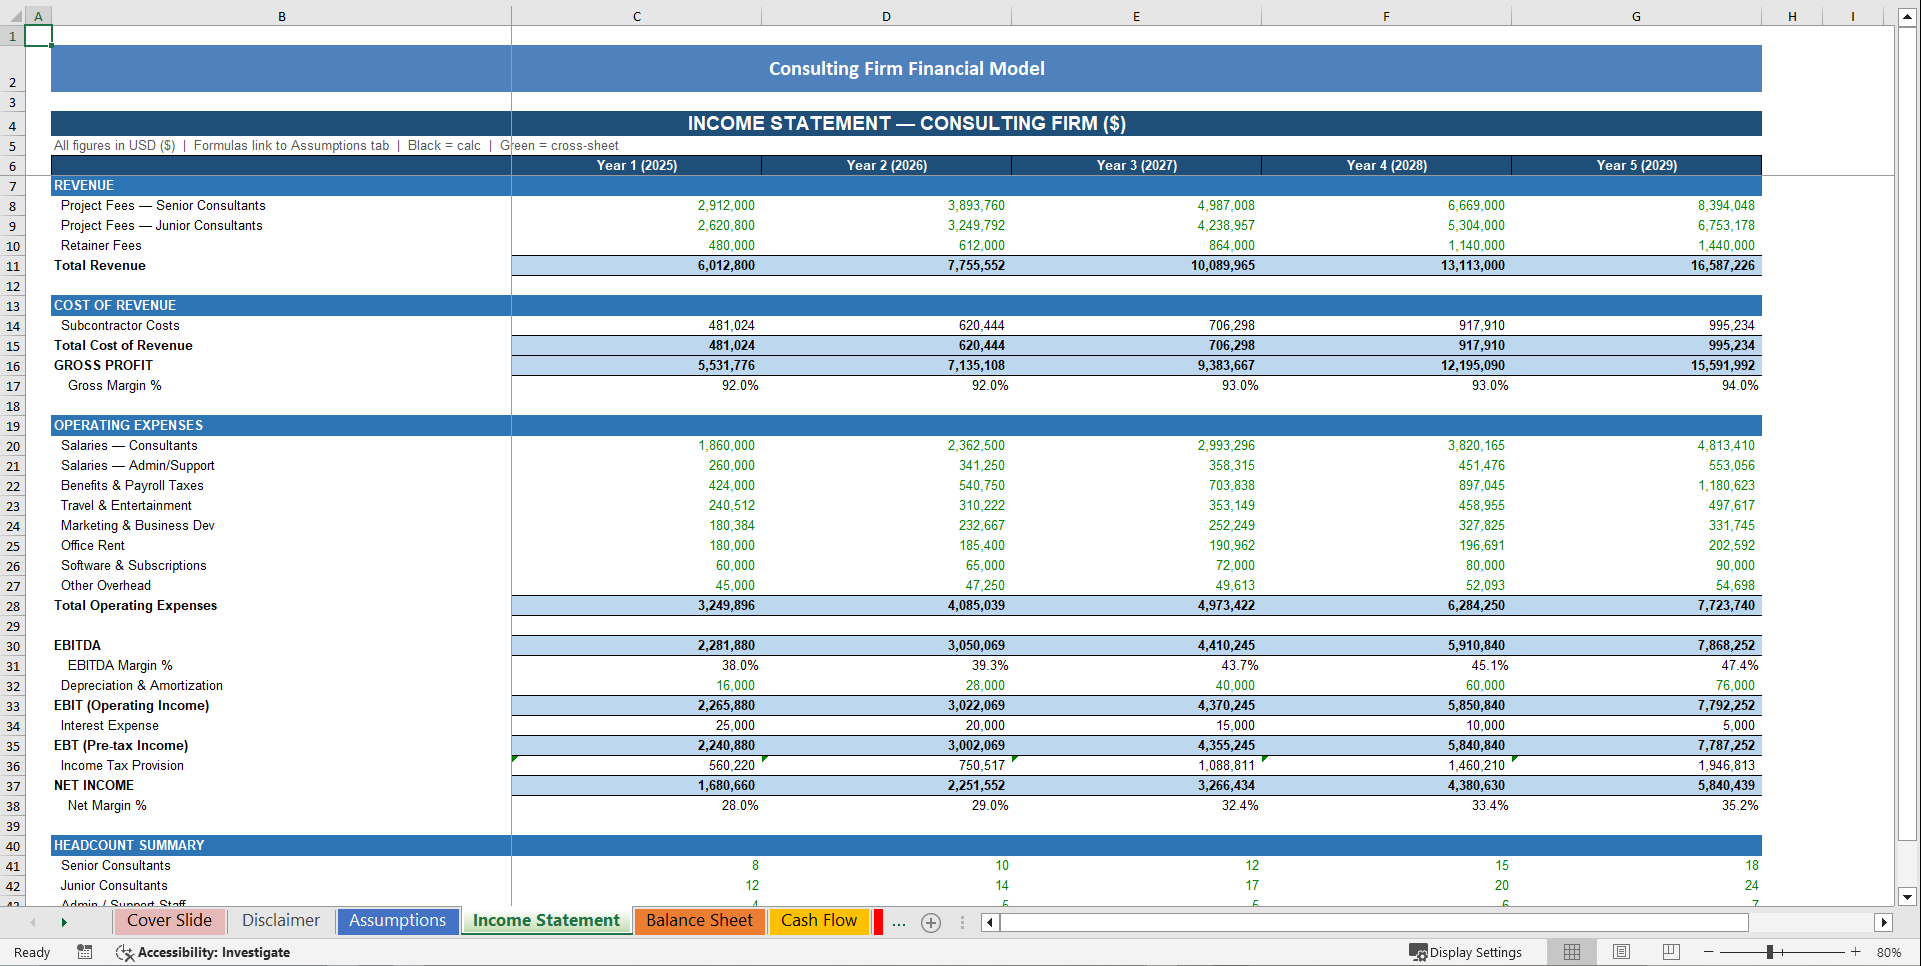
📊 TAB 2 – INCOME STATEMENT (5-Year P&L)
*Professional consulting-specific P&L structure. Every line formula-driven.*
Revenue Section:
• Project Fees – Senior Consultants *(Headcount × Hours × Utilization × Billing Rate)*
• Project Fees – Junior Consultants *(Headcount × Hours × Utilization × Billing Rate)*
• Retainer Fees *(Clients × Monthly Fee × 12)*
• Total Revenue
Cost of Revenue:
• Subcontractor / Third-Party Costs *(% of Revenue)*
• Total Cost of Revenue (COGS)
• Gross Profit
• Gross Margin % *(formula-driven)*
Operating Expenses:
• Salaries – Consultants *(Senior + Junior headcount × respective salaries)*
• Salaries – Admin/Support Staff *(Headcount × salary)*
• Benefits & Payroll Taxes *(% of total salary base)*
• Travel & Entertainment *(% of Revenue)*
• Marketing & Business Development *(% of Revenue)*
• Office Rent *(direct from Assumptions)*
• Software & Subscriptions *(direct from Assumptions)*
• Other Overhead *(direct from Assumptions)*
• Total Operating Expenses
Profitability Metrics:
• EBITDA *(Gross Profit − OpEx)*
• EBITDA Margin %
• Depreciation & Amortization *(cumulative straight-line schedule per year)*
• EBIT (Operating Income)
• Interest Expense *(debt balance × interest rate, declines as debt is repaid)*
• EBT (Pre-Tax Income)
• Income Tax Provision *(EBT × tax rate)*
• NET INCOME
• Net Margin %
Headcount Summary:
• Senior Consultants
• Junior Consultants
• Admin / Support Staff
• Total Headcount
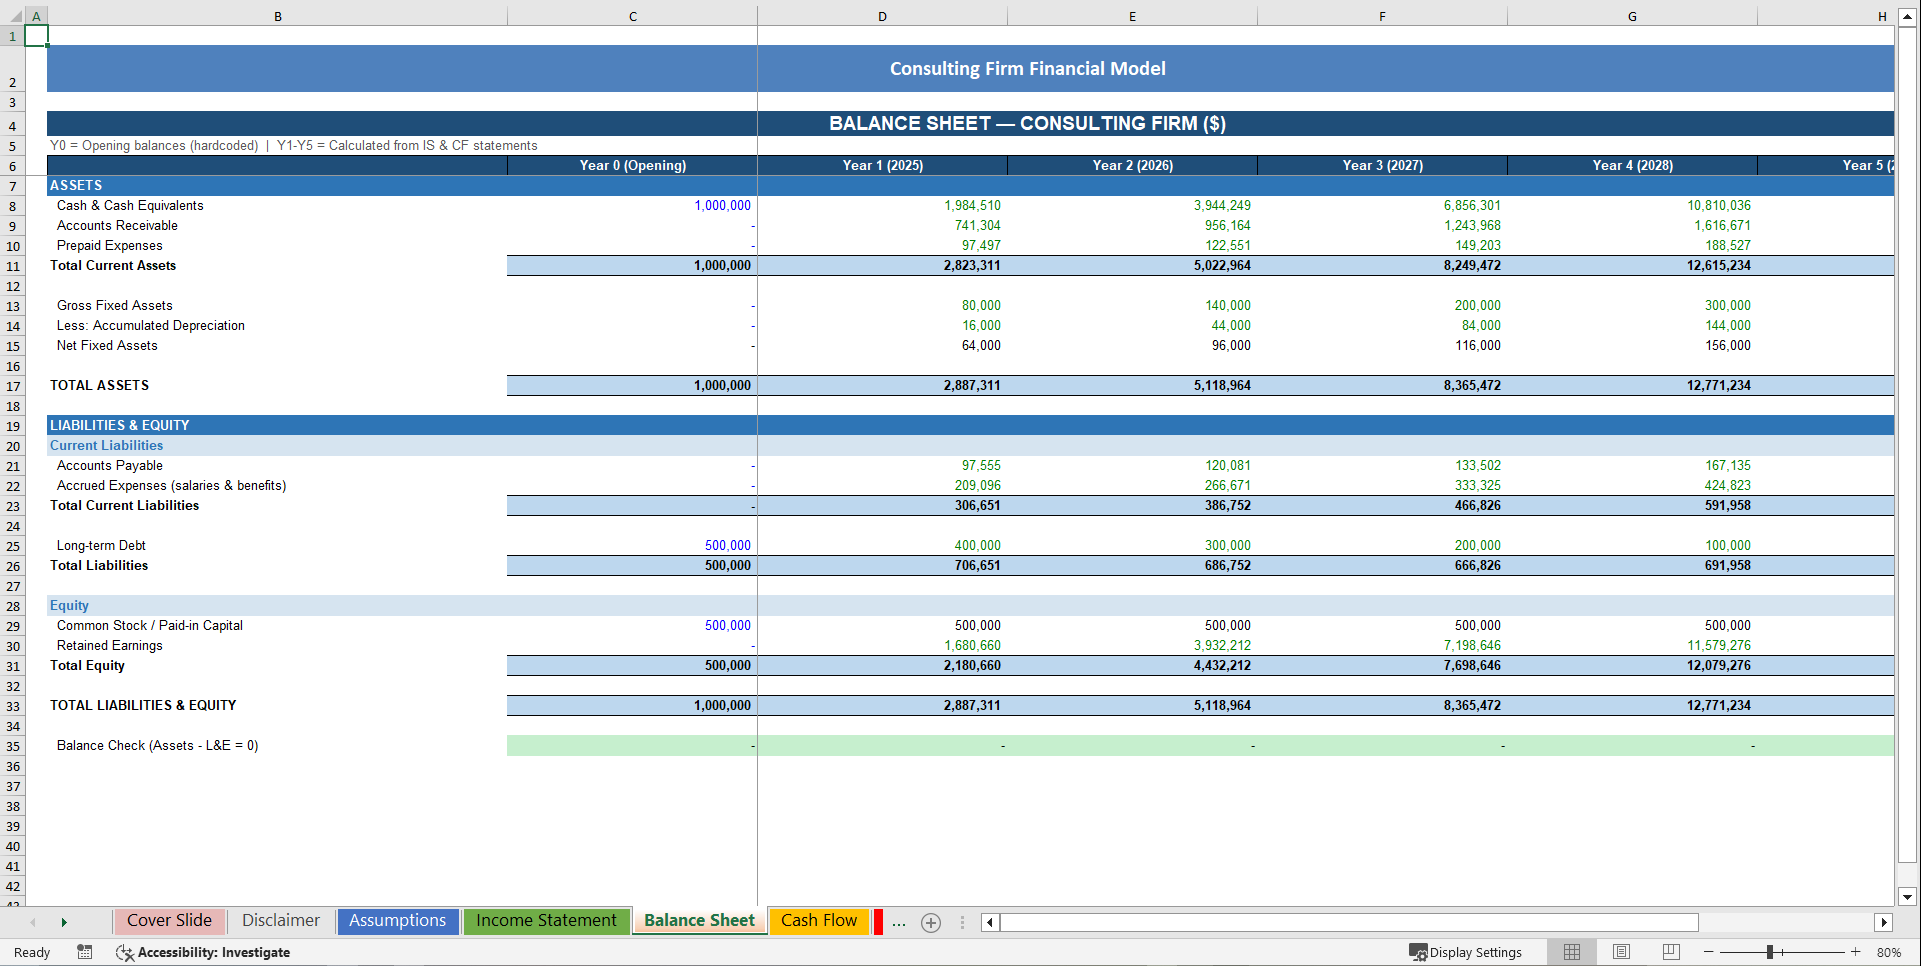
🏦 TAB 3 – BALANCE SHEET (Year 0 Opening + Years 1–5)
*Fully balanced. Automatically reconciles to zero. No manual adjustments needed.*
Assets:
• Cash & Cash Equivalents *(pulled from Ending Cash in Cash Flow Statement)*
• Accounts Receivable *(Revenue × DSO / 365)*
• Prepaid Expenses *(Total OpEx × Prepaid %)*
• Total Current Assets
• Gross Fixed Assets *(cumulative CapEx by year)*
• Less: Accumulated Depreciation *(cumulative D&A from Income Statement)*
• Net Fixed Assets
• TOTAL ASSETS
Liabilities:
• Accounts Payable *(cash-based costs × DPO / 365)*
• Accrued Expenses – Salaries & Benefits *(salary base × accrued days / 365)*
• Total Current Liabilities
• Long-Term Debt *(opens at $500K, reduces by annual repayment each year)*
• Total Liabilities
Equity:
• Common Stock / Paid-in Capital
• Retained Earnings *(cumulative Net Income from IS)*
• Total Equity
• TOTAL LIABILITIES & EQUITY
• Balance Check Row *(Assets − L&E, must always equal $0 – green-highlighted)*
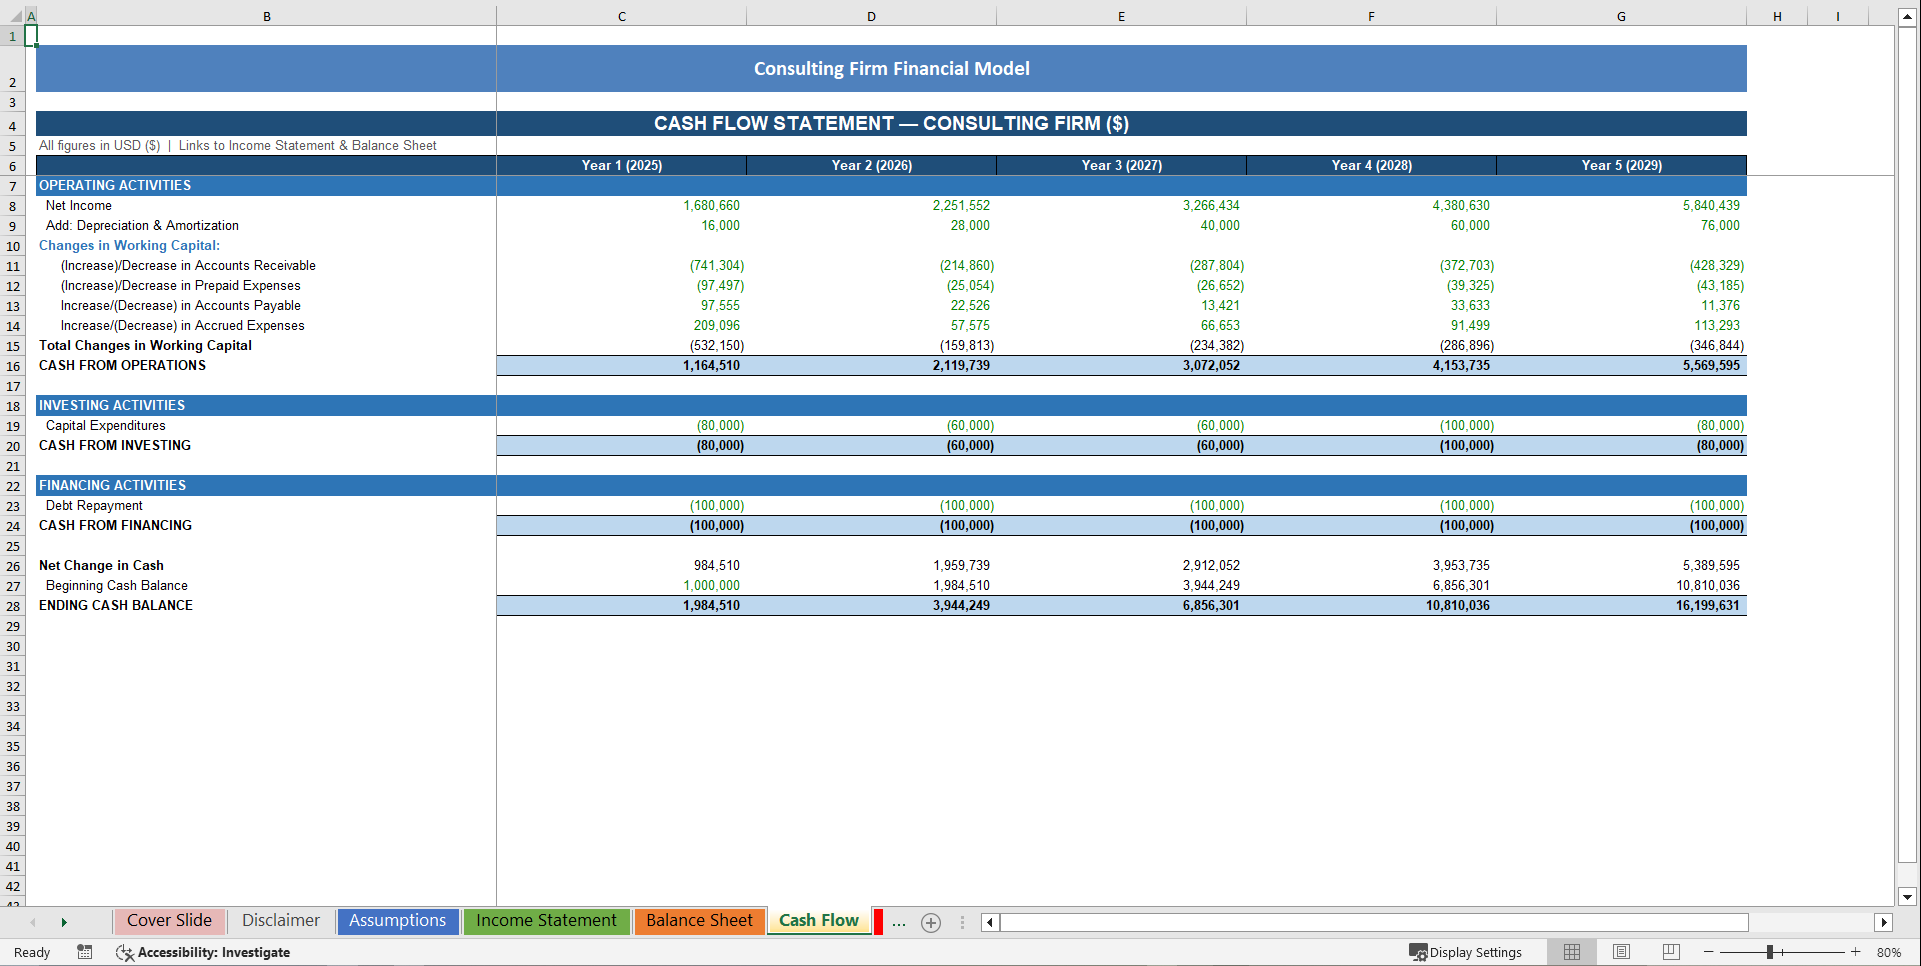
💵 TAB 4 – CASH FLOW STATEMENT (Indirect Method, Years 1–5)
*The most underrated statement. Fully linked. No manual plugs.*
Cash from Operating Activities:
• Net Income *(from Income Statement)*
• Add: Depreciation & Amortization *(non-cash add-back)*
• Changes in Working Capital:
• (Increase)/Decrease in Accounts Receivable
• (Increase)/Decrease in Prepaid Expenses
• Increase/(Decrease) in Accounts Payable
• Increase/(Decrease) in Accrued Expenses
• Total Changes in Working Capital
• CASH FROM OPERATIONS (CFO)
Cash from Investing Activities:
• Capital Expenditures *(CapEx from Assumptions – negative)*
• CASH FROM INVESTING (CFI)
Cash from Financing Activities:
• Debt Repayment *(annual fixed repayment – negative)*
• CASH FROM FINANCING (CFF)
Ending Cash Reconciliation:
• Net Change in Cash *(CFO + CFI + CFF)*
• Beginning Cash Balance *(prior year Ending Cash or Opening Balance)*
• ENDING CASH BALANCE *(feeds directly into Balance Sheet)*
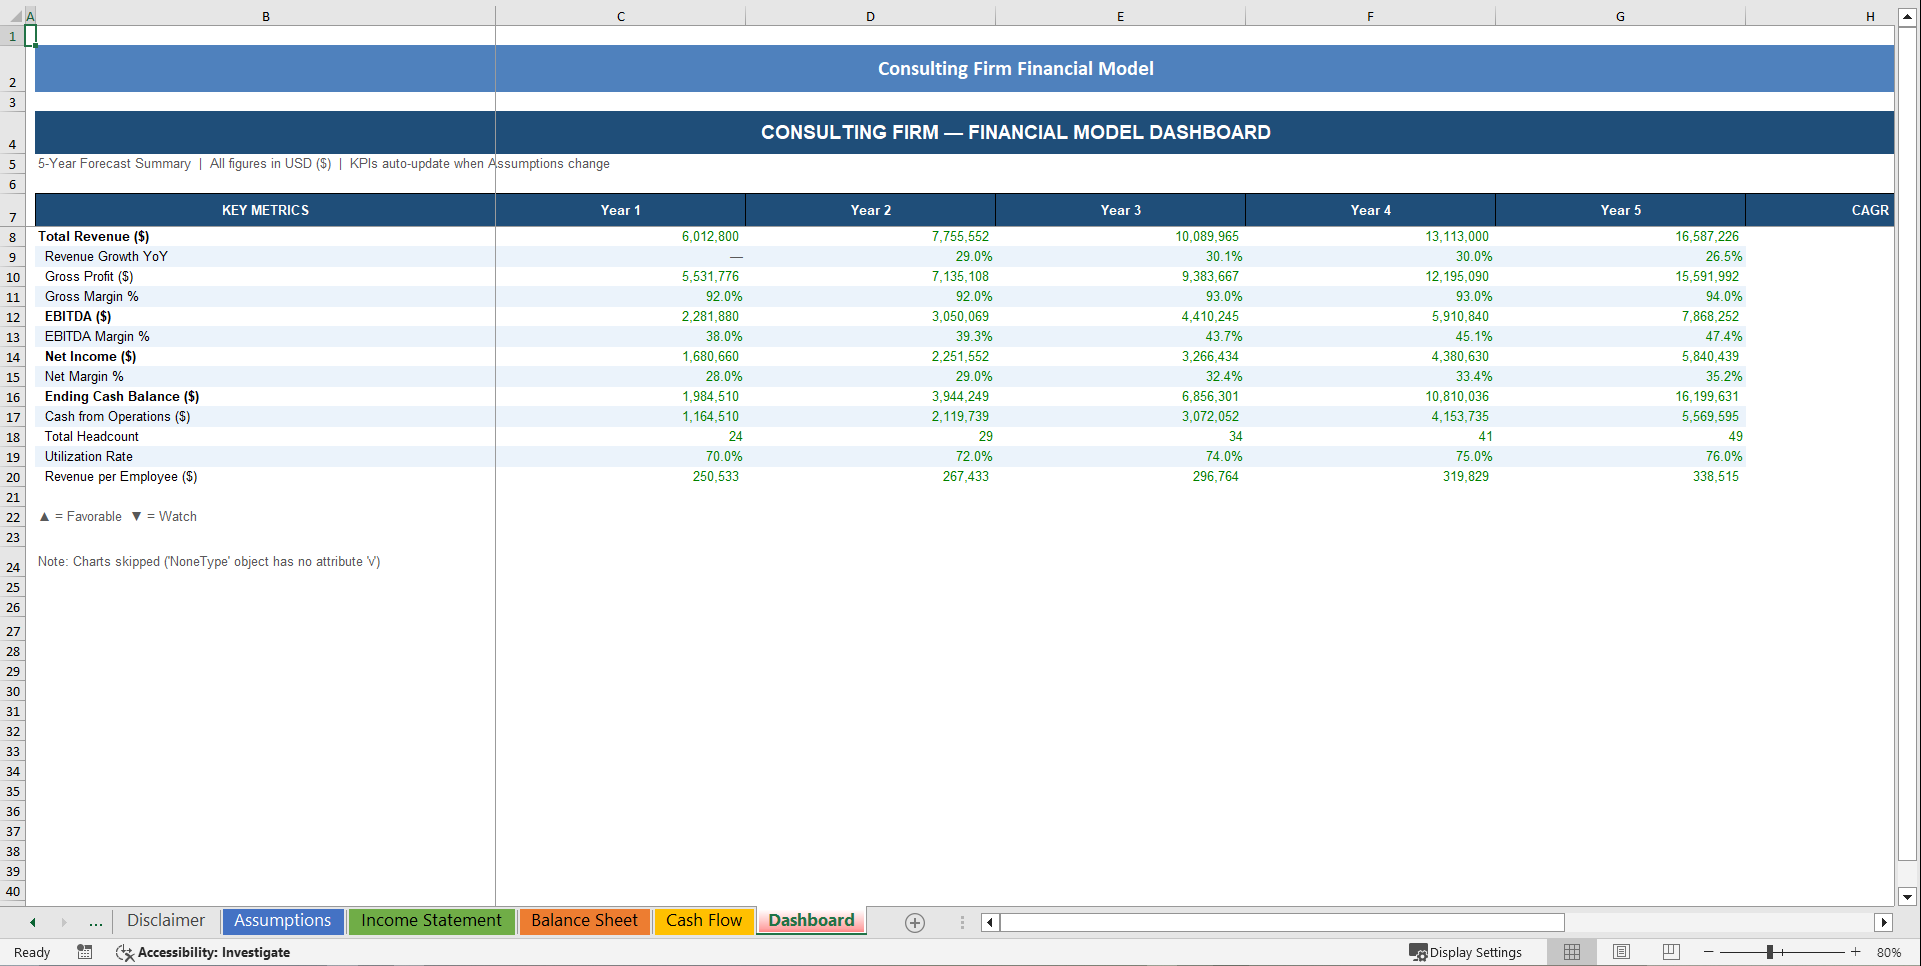
📈 TAB 5 – DASHBOARD (KPIs + 4 Charts)
*One screen. Every metric that matters. Ready for boardrooms, investor decks, and management reviews.*
13 KPI Metrics Tracked Across All 5 Years + 5-Year CAGR:
1. Total Revenue ($)
2. Revenue Growth YoY (%)
3. Gross Profit ($)
4. Gross Margin (%)
5. EBITDA ($)
6. EBITDA Margin (%)
7. Net Income ($)
8. Net Margin (%)
9. Ending Cash Balance ($)
10. Cash from Operations ($)
11. Total Headcount
12. Utilization Rate (%)
13. Revenue per Employee ($)
🏆 Who Needs This Model?
✅ Boutique consulting firm founders preparing for Series A or bank financing
✅ CFOs and finance directors at professional services firms
✅ Management consultants building financial models for their own firm or clients
✅ MBA students and finance graduates learning professional modeling
✅ Private equity and venture investors evaluating consulting firm acquisitions
✅ Business plan writers who need a credible, investor-grade financial projection
✅ Accountants and CPAs building projections for consulting firm clients
✅ Startup founders launching a consulting, advisory, or professional services business
💡 Why This Model Beats Everything Else on the Market
❌ Generic Business Plan Templates
They're built for product companies. They don't understand billing rates, utilization, retainer revenue, or billable hour economics. This model does – it was built *only* for consulting firms.
❌ Free Templates from Blogs
Broken formulas. Hardcoded numbers that don't update. No cash flow linkage. No balance sheet reconciliation. No scenario flexibility. Hours of cleanup work before you can use them.
❌ Hiring a Financial Analyst
$150–$500/hour. Weeks of back-and-forth. Revisions cost extra. You end up owning a static file you can't update yourself.
✅ This Model
Professional-grade. Clean. Zero errors. Fully yours to modify. Instantly ready. Built by financial modelers who understand consulting industry economics.
📐 The Consulting-Firm-Specific Details That Make This Model Different
Most financial models treat a "service business" like a product business with no inventory. This model is built around the actual economics of how consulting firms make money:
• Billing Rate × Utilization × Available Hours – the true revenue driver for any consulting firm
• Separate Senior and Junior consultant revenue streams – because these bill very differently
• Retainer revenue modeled separately from project fees – smoother revenue recognition
• Headcount-driven cost structure – salaries scale with consultants, not with revenue
• Benefits modeled as % of salary – industry-accurate payroll tax and benefits loading
• Subcontractor COGS – for firms that use external talent on engagements
• DSO-driven Accounts Receivable – consulting firms frequently deal with 30–60 day payment terms
• Straight-line D&A with cumulative schedule – because consulting firms do invest in equipment, leasehold improvements, and technology
• Debt schedule that amortizes cleanly – opening balance reduces each year by fixed repayment
🔒 What You Get – Instantly
• ✅ 1 Excel file (.xlsx) – compatible with Excel 2016+ and Google Sheets
• ✅ 5 fully built and linked tabs: Assumptions, Income Statement, Balance Sheet, Cash Flow, Dashboard
• ✅ 395 formulas – all verified with zero errors
• ✅ 4 embedded charts that auto-update
• ✅ 13-metric KPI dashboard with 5-year CAGR
• ✅ Fully documented – color-coded so any finance professional can pick it up and use it immediately
• ✅ Editable – add rows, change assumptions, build your own scenarios
• ✅ No macros, no VBA, no dependencies – pure Excel formulas
⭐ Built to Professional Finance Standards
• Color coding follows CFA Institute / investment banking standards (blue = inputs, black = formulas, green = cross-sheet links)
• Number formatting follows financial modeling best practices ($#,##0 with parentheses for negatives, 0.0% for percentages)
• Zero hardcoded values outside the Assumptions tab – a core principle of professional financial modeling
• Balance sheet reconciliation built in – if it ever shows a non-zero balance, you know exactly where to look
• Straight-line depreciation schedule that accumulates properly year-over-year
• Working capital mechanics based on real accounting (DSO, DPO, accrual days)
🚀 Download Now and Have Your 5-Year Financial Model Ready in Under 30 Minutes
Stop procrastinating. Stop building from scratch. Stop paying consultants to build what you can own for a fraction of the price.
Your investors want numbers. Your bank needs projections. Your board needs a plan.
This model delivers all three – clean, professional, and ready to present.
"The best time to build your financial model was last quarter. The second best time is right now."
*3-Statement Financial Model for Consulting Firms | Excel Template | Instant Download | 5-Year Forecast | Income Statement + Balance Sheet + Cash Flow + Dashboard | Professional Services Financial Model*
Key Words:
Strategy & Transformation, Growth Strategy, Strategic Planning, Strategy Frameworks, Innovation Management, Pricing Strategy, Core Competencies, Strategy Development, Business Transformation, Marketing Plan Development, Product Strategy, Breakout Strategy, Competitive Advantage, Mission, Vision, Values, Strategy Deployment & Execution, Innovation, Vision Statement, Core Competencies Analysis, Corporate Strategy, Product Launch Strategy, BMI, Blue Ocean Strategy, Breakthrough Strategy, Business Model Innovation, Business Strategy Example, Corporate Transformation, Critical Success Factors, Customer Segmentation, Customer Value Proposition, Distinctive Capabilities, Enterprise Performance Management, KPI, Key Performance Indicators, Market Analysis, Market Entry Example, Market Entry Plan, Market Intelligence, Market Research, Market Segmentation, Market Sizing, Marketing, Michael Porter's Value Chain, Organizational Transformation, Performance Management, Performance Measurement, Platform Strategy, Product Go-to-Market Strategy, Reorganization, Restructuring, SWOT, SWOT Analysis, Service 4.0, Service Strategy, Service Transformation, Strategic Analysis, Strategic Plan Example, Strategy Deployment, Strategy Execution, Strategy Frameworks Compilation, Strategy Methodologies, Strategy Report Example, Value Chain, Value Chain Analysis, Value Innovation, Value Proposition, Vision Statement, Corporate Strategy, Business Development, Business plan pdf, business plan, PDF, Business Plan DOC, Business Plan Template, PPT, Market strategy playbook, strategic market planning, competitive analysis tools, market segmentation frameworks, growth strategy templates, product positioning strategy, market execution toolkit, strategic alignment playbook, KPI and OKR frameworks, business growth strategy guide, cross-functional strategy templates, market risk management, market strategy PowerPoint doc, guide, ebook, e-book ,McKinsey Change Playbook, Organizational change management toolkit, Change management frameworks 2025, Influence model for change, Change leadership strategies, Behavioral change in organizations, Change management PowerPoint templates, Transformational leadership in change, supply chain KPIs, supply chain KPI toolkit, supply chain PowerPoint template, logistics KPIs, procurement KPIs, inventory management KPIs, supply chain performance metrics, manufacturing KPIs, supply chain dashboard, supply chain strategy KPIs, reverse logistics KPIs, sustainability KPIs in supply chain, financial supply chain KPIs, warehouse KPIs, digital supply chain KPIs, 1200 KPIs, supply chain scorecard, KPI examples, supply chain templates, Corporate Finance SOPs, Finance SOP Excel Template, CFO Toolkit, Finance Department Procedures, Financial Planning SOPs, Treasury SOPs, Accounts Payable SOPs, Accounts Receivable SOPs, General Ledger SOPs, Accounting Policies Template, Internal Controls SOPs, Finance Process Standardization, Finance Operating Procedures, Finance Department Excel Template, FP&A Process Documentation, Corporate Finance Template, Finance SOP Toolkit, CFO Process Templates, Accounting SOP Package, Tax Compliance SOPs, Financial Risk Management Procedures.
NOTE: Our digital products are sold on an "as is" basis, making returns and refunds unavailable post-download. Please preview and inquire before purchasing. Please contact us before purchasing if you have any questions! This policy aligns with the standard Flevy Terms of Usage.
Got a question about the product? Email us at support@flevy.com or ask the author directly by using the "Ask the Author a Question" form. If you cannot view the preview above this document description, go here to view the large preview instead.
Source: Best Practices in Consulting Training Excel: Consulting Firm 5-Year 3 Statement Financial Model Excel (XLSX) Spreadsheet, SB Consulting
ABOUT THE AUTHOR
SB Consulting is dedicated to empowering businesses to communicate their ideas with impact. This consulting firm specializes in teaching organizations how to create effective corporate and management presentations. With training from top-tier global consulting firms, including McKinsey, BCG, and Porsche Consulting, extensive expertise in presentation design and ... [read more]
Ask the Author a Question
You must be logged in to contact the author.
