
Corporate Training Services Firm 10-Year Financial Model – Excel XLSX
Excel (XLSX)
BENEFITS OF THIS DOWNLOADABLE EXCEL DOCUMENT
- Provides a framework for building a scalable, high-margin corporate training and consulting business driven by utilization, pricing, and delivery capacity.
- Enables you to forecast revenue, control costs, and generate investor-ready financial statements with full 3-statement integration over a 10-year horizon.
- Equips you with a decision-making engine to optimize hiring, maximize profitability, and stress-test growth scenarios with institutional-grade financial precision.
EMPLOYEE TRAINING EXCEL DESCRIPTION
Curated by McKinsey-trained Executives
🎓 Corporate Training & Consulting Financial Model | Institutional-Grade 3-Statement 10-Year Forecast
Turn your corporate training, L&D, and consulting business into a scalable, cash-generating, investor-ready platform – modeled with the same financial precision used by global consulting firms, enterprise learning providers, and high-margin professional services platforms.
Whether you're a corporate training company scaling program delivery, an L&D platform monetizing enterprise clients, a consulting firm optimizing utilization and billing rates, a CFO building a defensible financial plan, an investor evaluating EBITDA scalability, or an operator preparing for fundraising, acquisition, or strategic expansion – this fully integrated 3-Statement Financial Model gives you the exact infrastructure to forecast revenue, control costs, maximize utilization, and scale profitably over a 10-year horizon.
💡 What's Inside
This model captures every financial and operational driver of a modern corporate training & consulting business – from your first client engagements to a fully scaled multi-program, multi-team delivery engine generating predictable recurring revenue and strong free cash flow.
Built using institutional consulting and professional services modeling best practices, the model is fully dynamic, cross-linked across all sheets, and designed to simulate real-world scaling constraints like hiring, utilization, pricing, and delivery capacity.
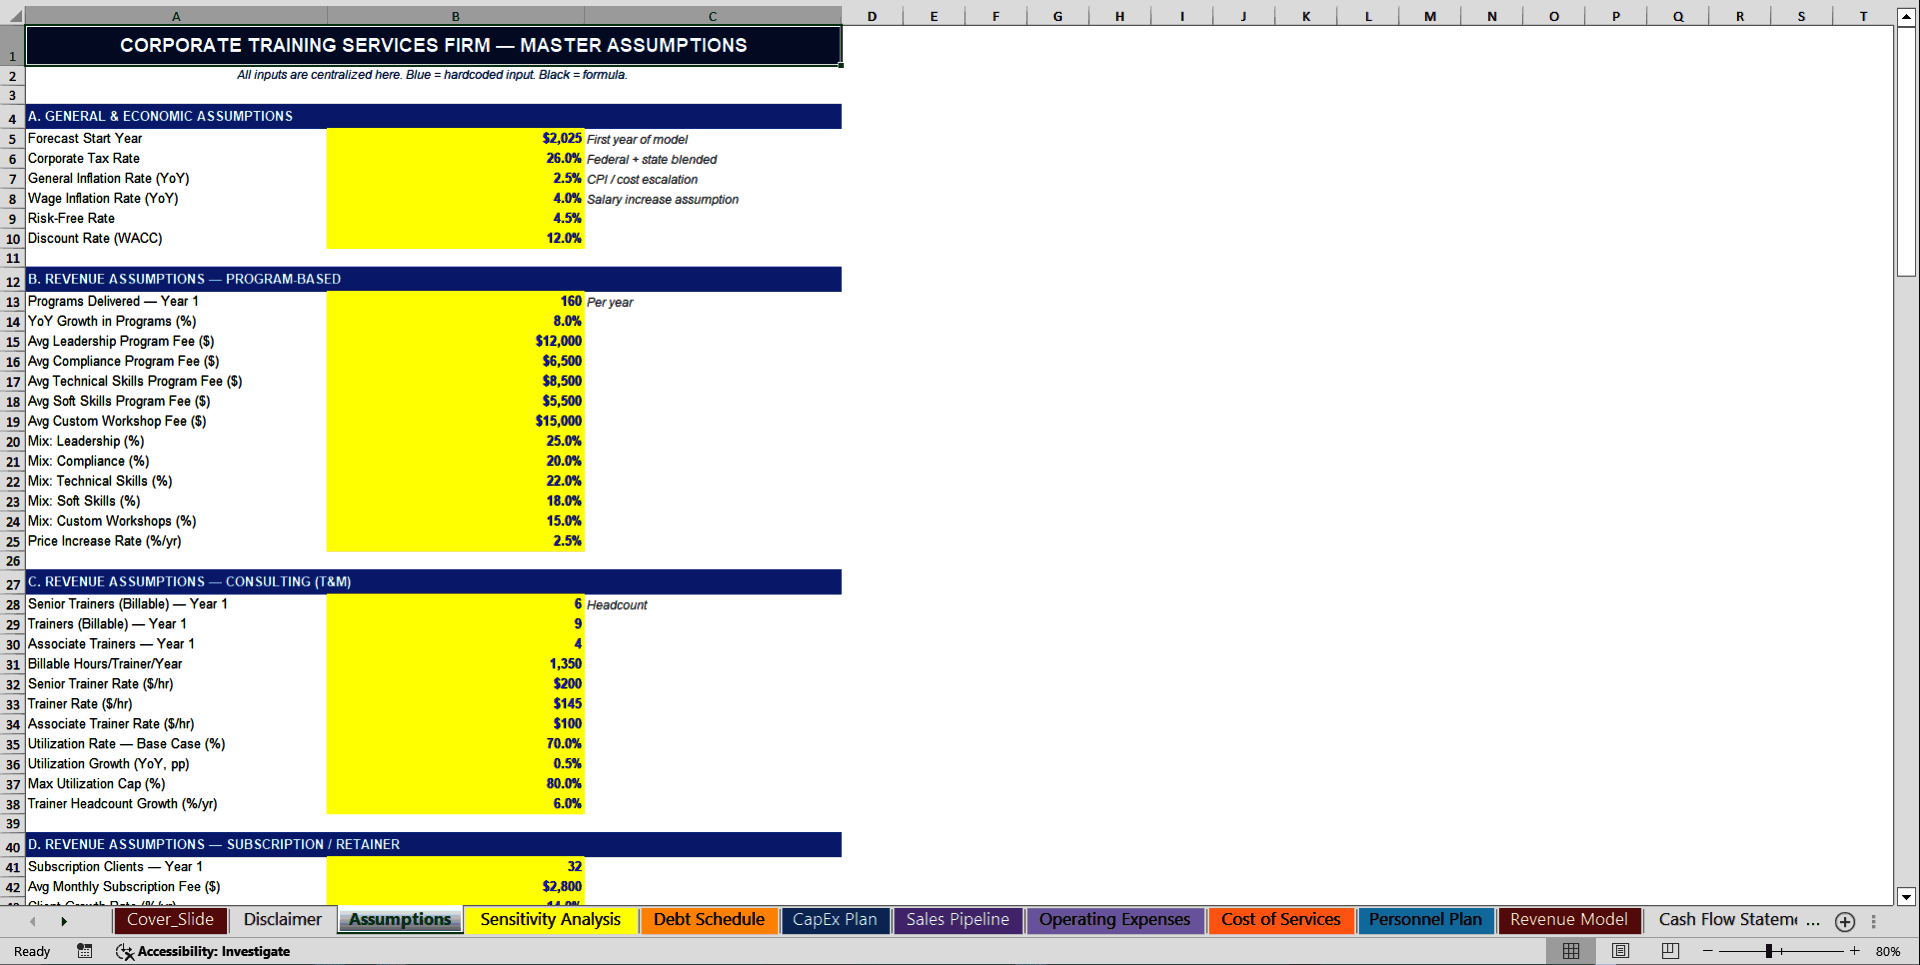
📥 Inputs
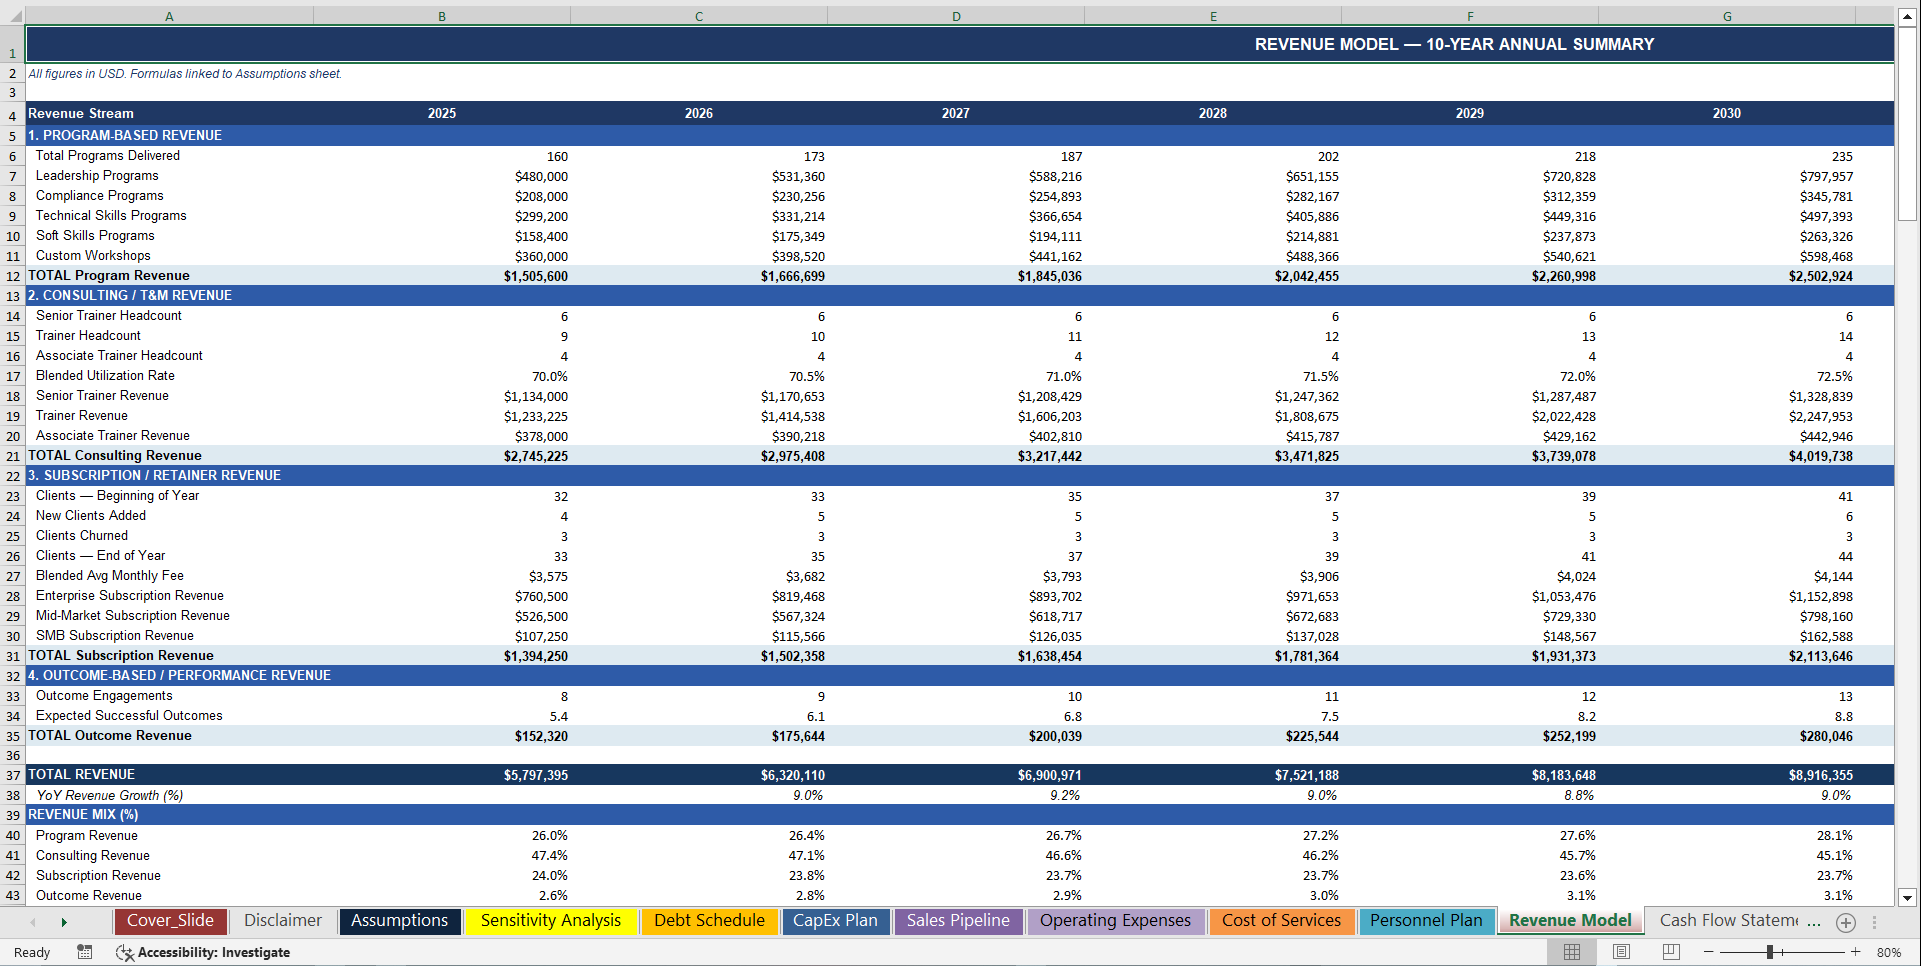
• 🎓 Multi-Program Revenue Engine (5 Training Categories) – Leadership, Compliance, Technical, Soft Skills, and Custom Workshops – each modeled with individual pricing, growth rates, and revenue mix percentages – plus program volume scaling year-over-year – every revenue line tied directly to operational delivery capacity and demand assumptions
• 👥 Consulting Utilization & Billing Model – Trainer headcount × utilization rate × effective billing capacity – with utilization modeled as a primary revenue driver (~70–75% baseline) – allowing you to stress-test revenue sensitivity to productivity, idle capacity, and over-hiring risk – the exact KPI every consulting CFO and investor focuses on first
• 📈 Dynamic Pricing & Growth Assumptions – Program pricing, annual price increases, service mix evolution, and total engagement volume – enabling realistic revenue expansion driven by both volume and pricing power – not just arbitrary growth rates
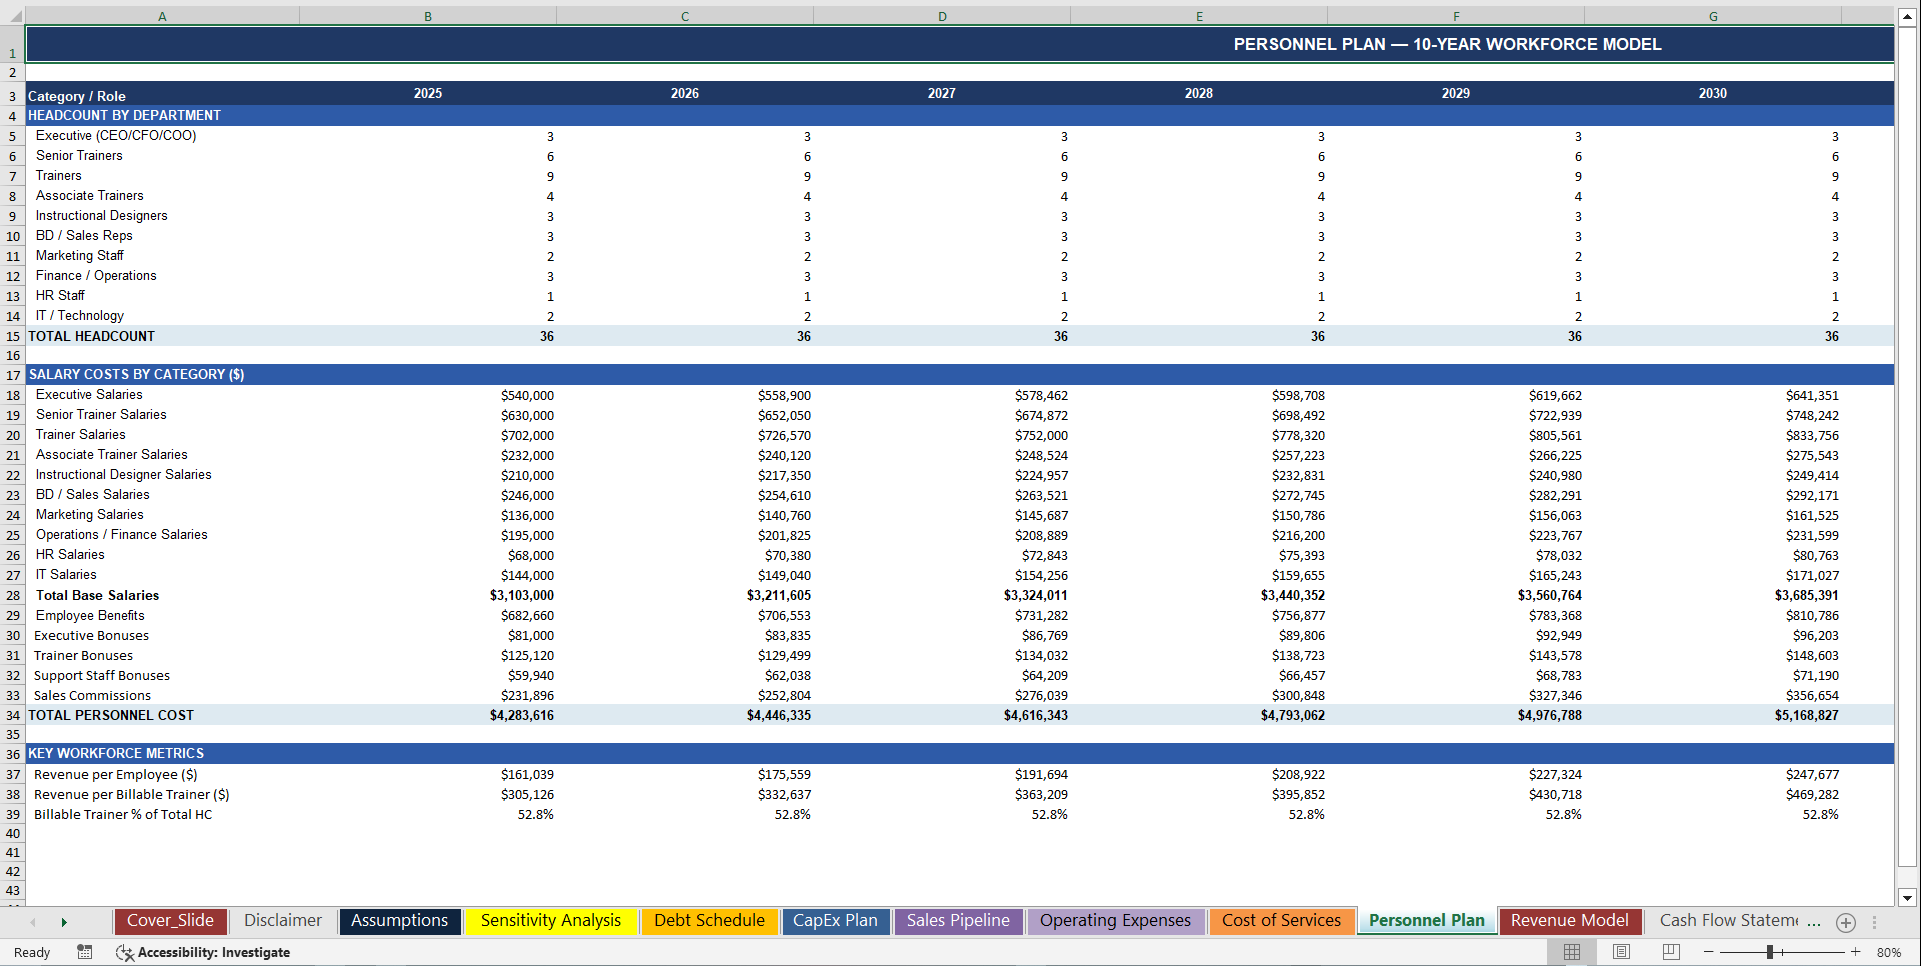
• 🧠 Personnel & Hiring Plan (36 Employees by Year 10) – Fully built-out org structure including Executives, Senior Trainers, Junior Trainers, HR, Sales, Marketing, IT, and Operations – with role-based salary scaling, hiring timelines, and cost allocation between delivery (COGS) and overhead (OPEX)
• 💸 Cost of Service Delivery Engine – Trainer salaries, external instructors, travel, venue costs, materials, and LMS/platform costs – all modeled as scalable, partially variable cost drivers – feeding directly into gross margin and delivery efficiency metrics
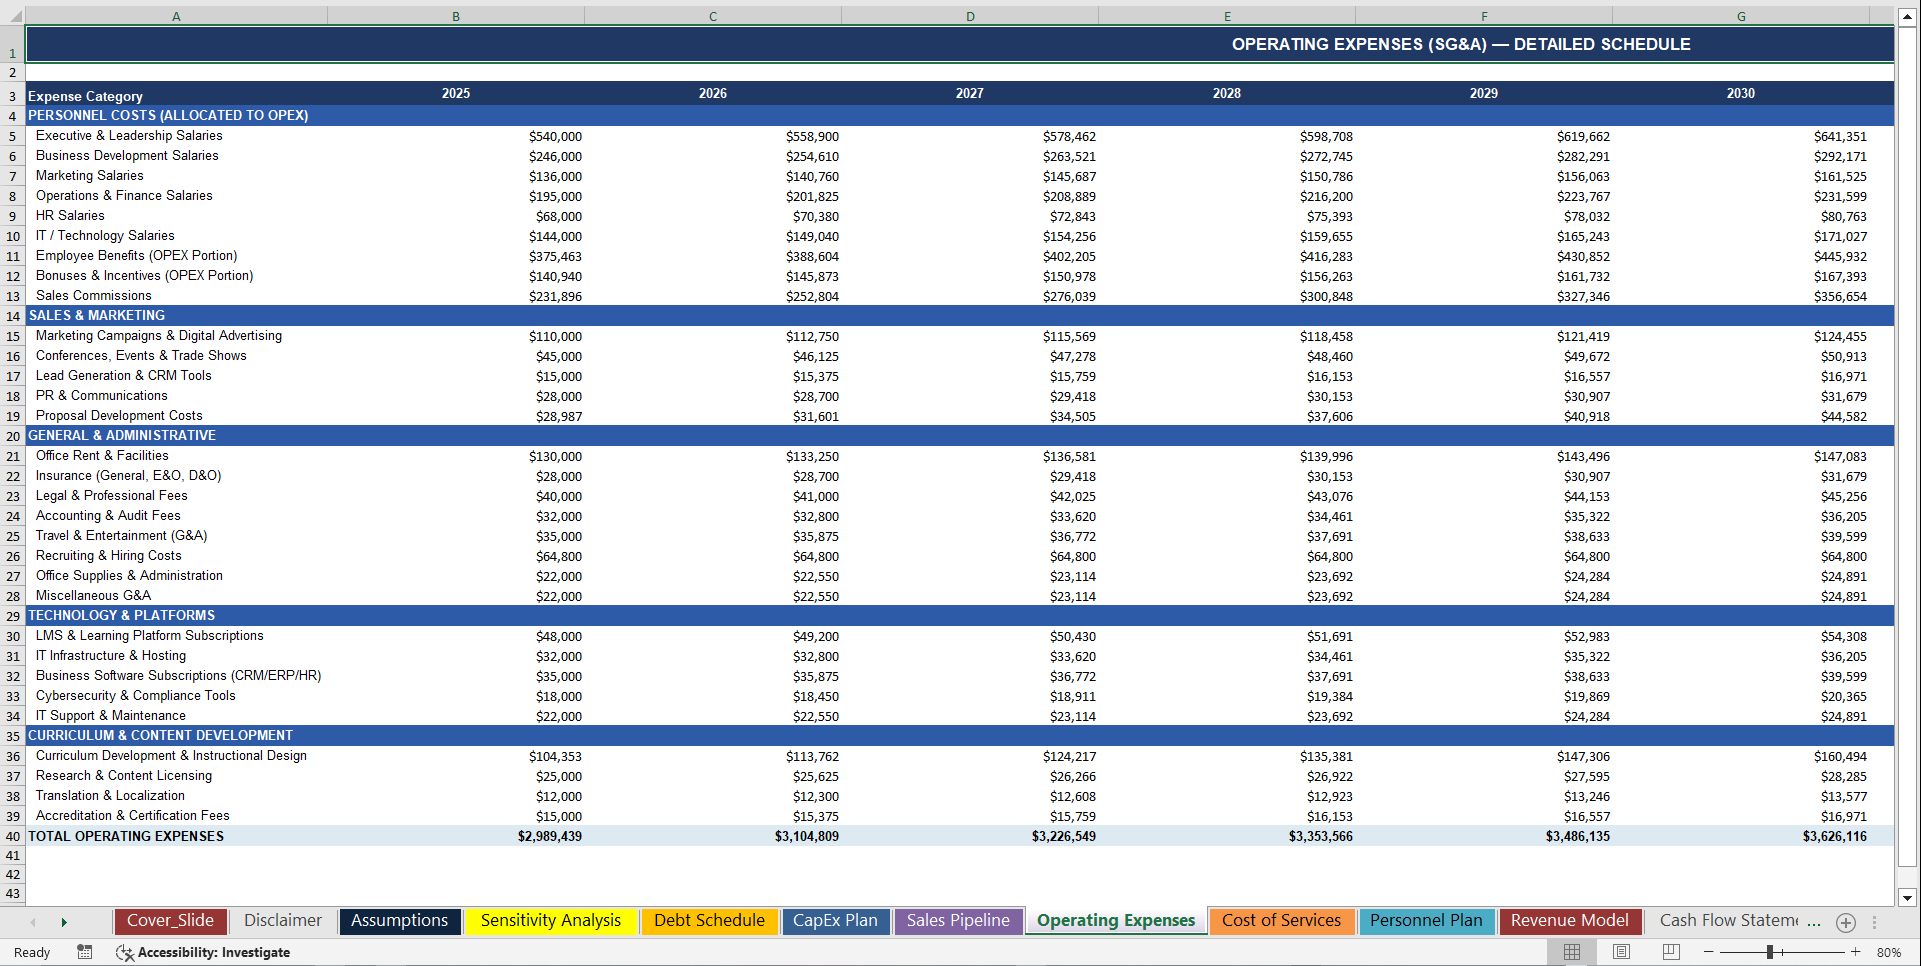
• 🔧 Operating Expense Structure (OPEX) – Sales, Marketing, Admin, HR, and IT costs modeled with both fixed and scaling components – reflecting the real cost structure of a growing consulting organization – with OPEX leverage improving over time
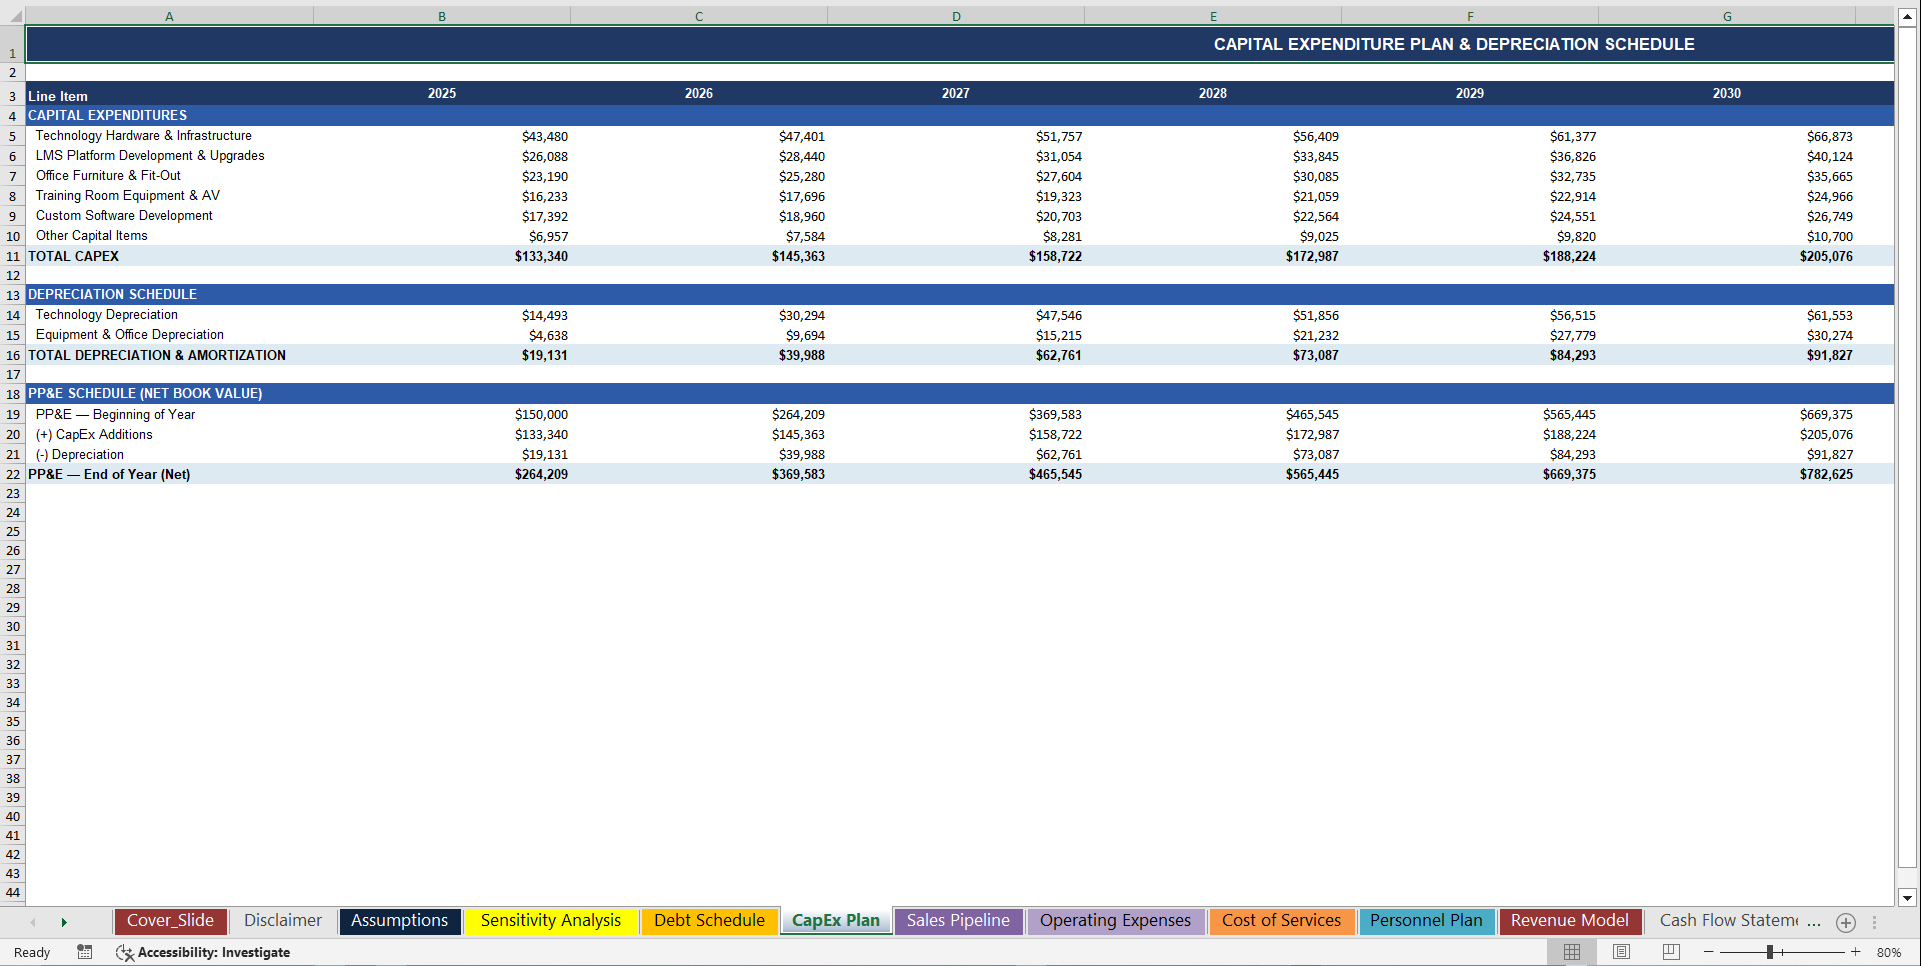
• 🏗️ CapEx & Platform Investment Model – LMS development, technology infrastructure, and equipment investments – with depreciation schedules and long-term asset tracking – capturing the transition from manual delivery to scalable digital infrastructure
• 🏦 Debt & Financing Structure – $2M term loan with full amortization schedule, declining interest expense, and optional revolving credit facility – with interest flowing into the Income Statement and balances linked to the Balance Sheet – enabling full leverage and liquidity analysis
• 📦 Working Capital Model – Receivables, payables, and accrued expenses modeled as a function of revenue and cost structure – capturing real cash flow timing differences – with Net Working Capital and Change in NWC fully integrated into cash flow
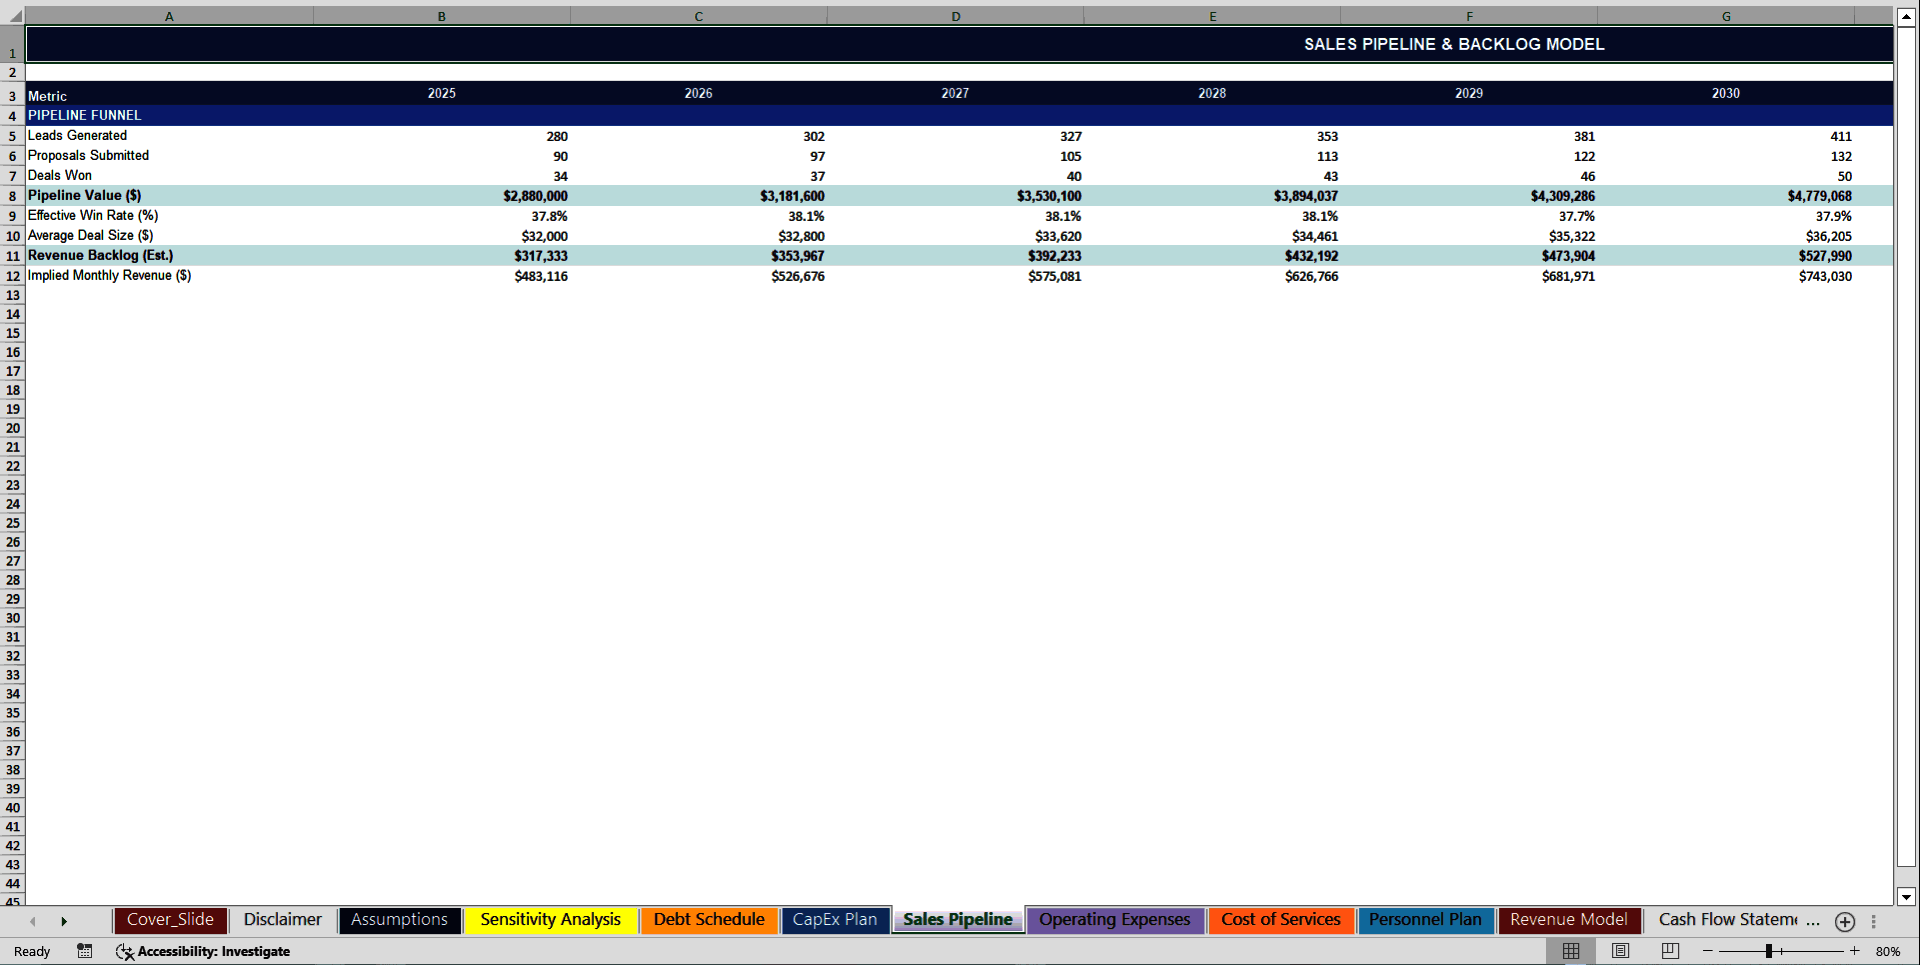
• 🔬 Sales Pipeline & Conversion Engine – Leads → proposals → closed deals – with win rate (~38%), deal size growth, and pipeline scaling – connecting top-of-funnel sales activity directly to revenue outcomes
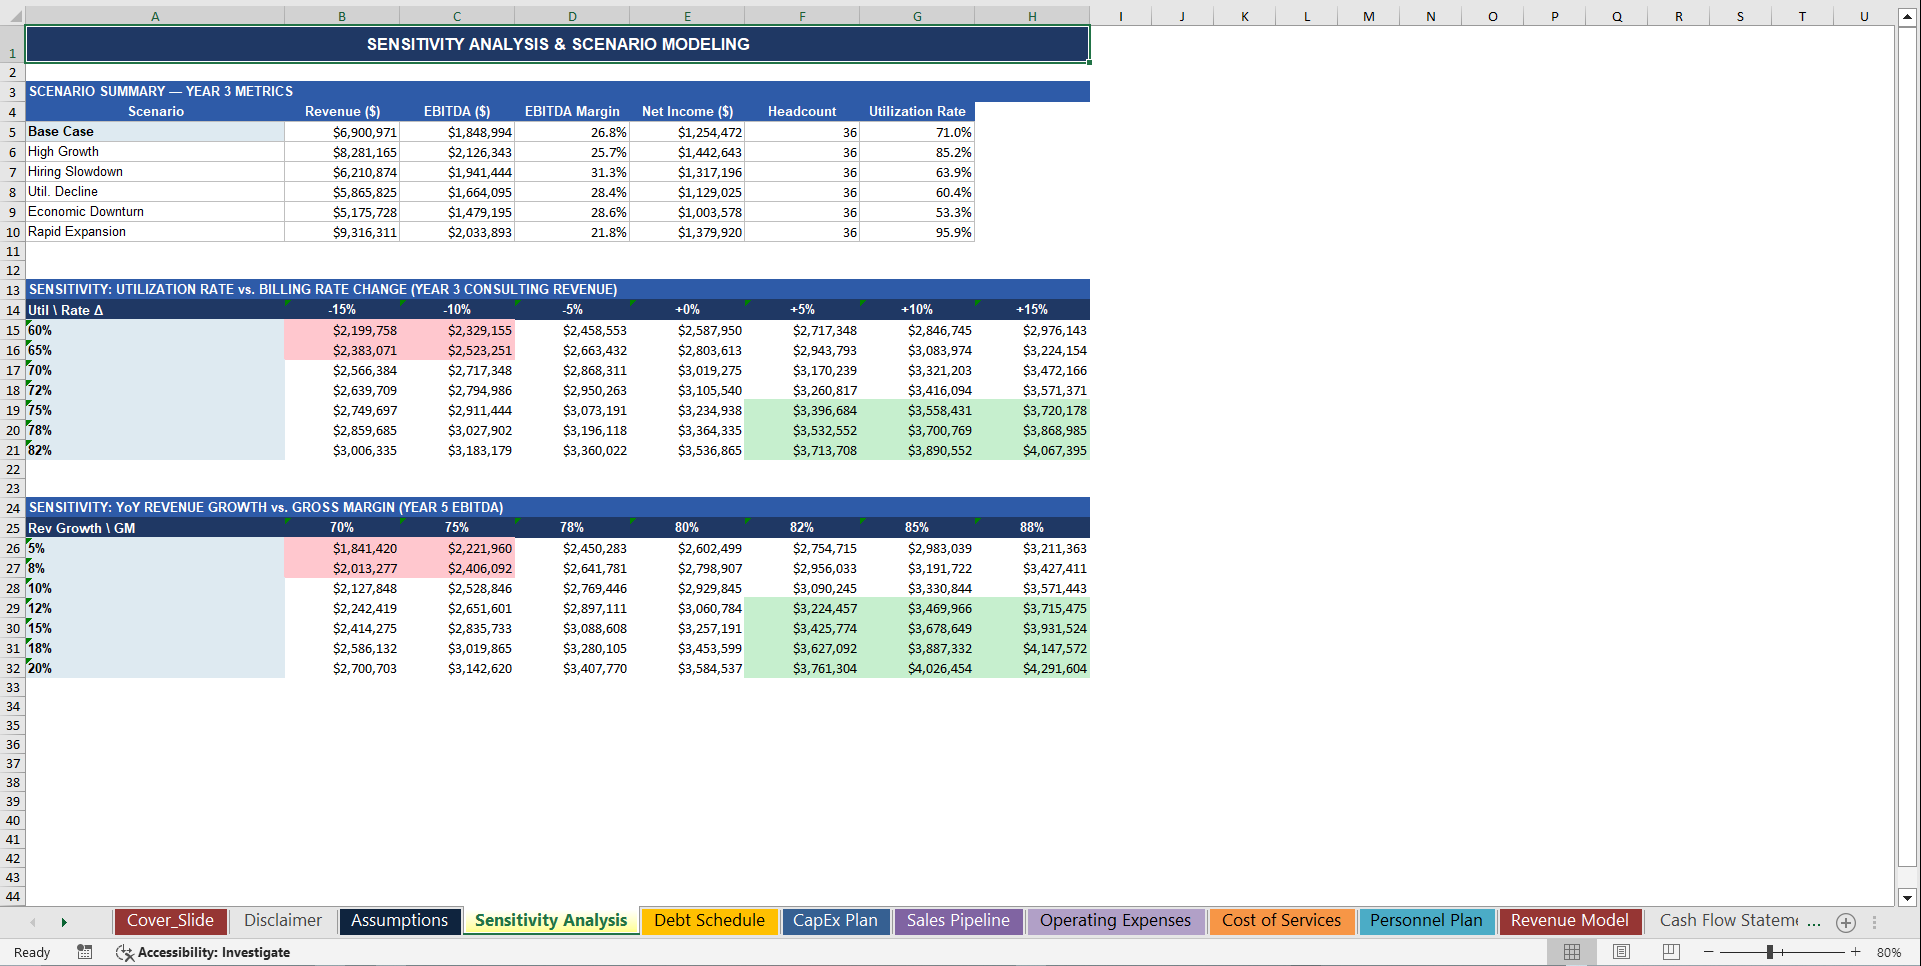
• 📊 Scenario & Sensitivity Framework – Base Case, High Growth, Downturn, and Expansion scenarios – plus sensitivity analysis on utilization vs pricing – giving instant answers to "what happens if" across your two most critical profit drivers
📤 Outputs
• 📈 10-Year Fully Integrated 3-Statement Model – Income Statement, Balance Sheet, and Cash Flow Statement fully linked and auto-balancing – every number driven by assumptions – zero hardcoding – full auditability across all periods
• 💰 Revenue Scaling to ~$12.4M – With clear breakdown across program types and consulting delivery – including growth rates, revenue mix, and pricing evolution – showing exactly how the business scales
• 📊 High-Margin Profitability Profile (~75% Gross Margin) – Gross profit, EBITDA, and net income tracked annually – demonstrating the inherent profitability of training & consulting models when utilization is optimized
• 💵 Cash Flow & Liquidity Build-Up – Operating cash flow scaling to ~$3.7M annually – cumulative cash reaching ~$18.5M by Year 10 – highlighting strong cash generation and low capital intensity
• 👥 Headcount & Productivity Metrics – Revenue per employee, utilization rate, and cost per employee – making operational efficiency transparent and measurable
• 🎯 Utilization-Driven Unit Economics – Revenue per trainer, revenue per program, and margin per engagement – isolating the key drivers of profitability in consulting businesses
• 🔄 Full Cash Flow Statement (Indirect Method) – Net income, working capital changes, CapEx, debt flows, and free cash flow – fully reconciled to balance sheet cash
• 🏦 Balance Sheet with Strong Cash Position – Growing retained earnings, declining debt, and strong liquidity – enabling investor-grade financial health analysis
• 📉 Sensitivity Analysis (Utilization vs Pricing) – Instantly see how small changes in utilization or pricing impact revenue and profitability – the two most critical levers in your business
• 📺 Executive Dashboard – Revenue, profit, cash, and growth KPIs visualized for quick decision-making and investor presentations
🏆 Why This Model Stands Out
✅ Built for consulting & training reality – Not a generic template. Every assumption reflects how corporate training and consulting firms actually operate: utilization constraints, pricing tiers, hiring lag, and delivery capacity
✅ Utilization-first modeling approach – Most models ignore it. This one makes utilization a core revenue driver, exactly how real consulting businesses are managed
✅ High-margin business clarity – Clearly shows how ~75% gross margins translate into strong EBITDA and cash flow – critical for investors and operators
✅ Fully integrated & dynamic – Change one assumption and the entire model updates instantly across revenue, hiring, costs, and financial statements
✅ Investor & lender ready – Answers the key questions:
• How scalable is revenue?
• What drives margins?
• How sensitive is profit to utilization?
• How fast does cash accumulate?
• When does the business become self-financing?
✅ Cash flow focused – Goes beyond profit to show real liquidity, making it usable for fundraising, planning, and strategic decisions
✅ Fully transparent & auditable – No hidden logic, no locked cells – every formula traceable, every assumption visible
📋 Model Structure
• Executive Dashboard – KPI overview with revenue, profit, and cash trends
• Assumptions – Central control panel for all key drivers
• Revenue Model – Program + consulting revenue engine
• Sales Pipeline – Funnel-driven deal conversion logic
• Personnel Plan – Hiring, salaries, and org structure
• Cost of Services – Direct delivery cost modeling
• Operating Expenses – Full OPEX breakdown
• CapEx Plan – Technology and infrastructure investments
• Debt Schedule – Loan and financing structure
• Working Capital – Cash flow timing mechanics
• Income Statement – Full profitability breakdown
• Balance Sheet – Assets, liabilities, equity
• Cash Flow Statement – Indirect method cash flow
• Sensitivity Analysis – Utilization & pricing stress test
🚀 Who This Is For
• Corporate training companies scaling delivery
• Consulting firms optimizing utilization & margins
• EdTech & L&D platforms building financial forecasts
• CFOs & finance teams building strategic plans
• Investors evaluating service-based business models
• Founders preparing for fundraising or exit
🔥 Bottom Line
This isn't just a spreadsheet.
It's a scalable financial operating system for a corporate training & consulting business – designed to help you:
• Grow revenue predictably
• Control hiring and costs
• Maximize utilization
• Generate strong cash flow
• And present a credible, investor-grade financial story
Key Words:
Strategy & Transformation, Growth Strategy, Strategic Planning, Strategy Frameworks, Innovation Management, Pricing Strategy, Core Competencies, Strategy Development, Business Transformation, Marketing Plan Development, Product Strategy, Breakout Strategy, Competitive Advantage, Mission, Vision, Values, Strategy Deployment & Execution, Innovation, Vision Statement, Core Competencies Analysis, Corporate Strategy, Product Launch Strategy, BMI, Blue Ocean Strategy, Breakthrough Strategy, Business Model Innovation, Business Strategy Example, Corporate Transformation, Critical Success Factors, Customer Segmentation, Customer Value Proposition, Distinctive Capabilities, Enterprise Performance Management, KPI, Key Performance Indicators, Market Analysis, Market Entry Example, Market Entry Plan, Market Intelligence, Market Research, Market Segmentation, Market Sizing, Marketing, Michael Porter's Value Chain, Organizational Transformation, Performance Management, Performance Measurement, Platform Strategy, Product Go-to-Market Strategy, Reorganization, Restructuring, SWOT, SWOT Analysis, Service 4.0, Service Strategy, Service Transformation, Strategic Analysis, Strategic Plan Example, Strategy Deployment, Strategy Execution, Strategy Frameworks Compilation, Strategy Methodologies, Strategy Report Example, Value Chain, Value Chain Analysis, Value Innovation, Value Proposition, Vision Statement, Corporate Strategy, Business Development, Business plan pdf, business plan, PDF, Business Plan DOC, Business Plan Template, PPT, Market strategy playbook, strategic market planning, competitive analysis tools, market segmentation frameworks, growth strategy templates, product positioning strategy, market execution toolkit, strategic alignment playbook, KPI and OKR frameworks, business growth strategy guide, cross-functional strategy templates, market risk management, market strategy PowerPoint doc, guide, ebook, e-book ,McKinsey Change Playbook, Organizational change management toolkit, Change management frameworks 2025, Influence model for change, Change leadership strategies, Behavioral change in organizations, Change management PowerPoint templates, Transformational leadership in change, supply chain KPIs, supply chain KPI toolkit, supply chain PowerPoint template, logistics KPIs, procurement KPIs, inventory management KPIs, supply chain performance metrics, manufacturing KPIs, supply chain dashboard, supply chain strategy KPIs, reverse logistics KPIs, sustainability KPIs in supply chain, financial supply chain KPIs, warehouse KPIs, digital supply chain KPIs, 1200 KPIs, supply chain scorecard, KPI examples, supply chain templates, Corporate Finance SOPs, Finance SOP Excel Template, CFO Toolkit, Finance Department Procedures, Financial Planning SOPs, Treasury SOPs, Accounts Payable SOPs, Accounts Receivable SOPs, General Ledger SOPs, Accounting Policies Template, Internal Controls SOPs, Finance Process Standardization, Finance Operating Procedures, Finance Department Excel Template, FP&A Process Documentation, Corporate Finance Template, Finance SOP Toolkit, CFO Process Templates, Accounting SOP Package, Tax Compliance SOPs, Financial Risk Management Procedures.
NOTE: Our digital products are sold on an "as is" basis, making returns and refunds unavailable post-download. Please preview and inquire before purchasing. Please contact us before purchasing if you have any questions! This policy aligns with the standard Flevy Terms of Usage.
Got a question about the product? Email us at support@flevy.com or ask the author directly by using the "Ask the Author a Question" form. If you cannot view the preview above this document description, go here to view the large preview instead.
Source: Best Practices in Employee Training, Integrated Financial Model Excel: Corporate Training Services Firm 10-Year Financial Model Excel (XLSX) Spreadsheet, SB Consulting
ABOUT THE AUTHOR
SB Consulting is dedicated to empowering businesses to communicate their ideas with impact. This consulting firm specializes in teaching organizations how to create effective corporate and management presentations. With training from top-tier global consulting firms, including McKinsey, BCG, and Porsche Consulting, extensive expertise in presentation design and ... [read more]
Ask the Author a Question
You must be logged in to contact the author.
