

COO (Chief Operating Officer) KPI Scorecard Dashboard – Excel XLSX
Excel (XLSX)
BENEFITS OF THIS DOWNLOADABLE EXCEL DOCUMENT
- Provides a comprehensive framework for tracking and managing all critical operational KPIs required for effective COO-level performance management.
- Enables data-driven operational leadership by consolidating production, supply chain, workforce, financial, and service performance metrics into a single structured scorecard.
- Delivers a ready-to-use executive dashboard that helps COOs monitor operational performance, identify bottlenecks, and drive continuous improvement across the entire organization.
KEY PERFORMANCE INDICATORS EXCEL DESCRIPTION
Curated by McKinsey-trained Executives
🚀 The Ultimate COO KPI Scorecard (Excel)
The Complete Operational Command Center for High-Performance COOs
If you're a Chief Operating Officer, your job is simple in theory… but brutal in reality:
• Run operations flawlessly
• Scale systems and processes
• Optimize costs and productivity
• Ensure supply chain reliability
• Deliver world-class customer experience
• And still hit financial targets
Yet most COOs are still managing operations with scattered spreadsheets, disconnected reports, and incomplete data.
That ends today.
Introducing the COO KPI Scorecard – The Ultimate Operational Intelligence Excel Tool
The COO KPI Scorecard is a powerful Excel-based executive operations dashboard designed to give you total visibility across every operational function in your organization.
From operations efficiency to customer delivery, supply chain, financial performance, technology infrastructure, and strategic execution – this tool tracks 100+ mission-critical KPIs used by elite operations leaders.
This is not just another spreadsheet.
This is your Operational Control Tower.
📊 A Complete COO Performance Management System
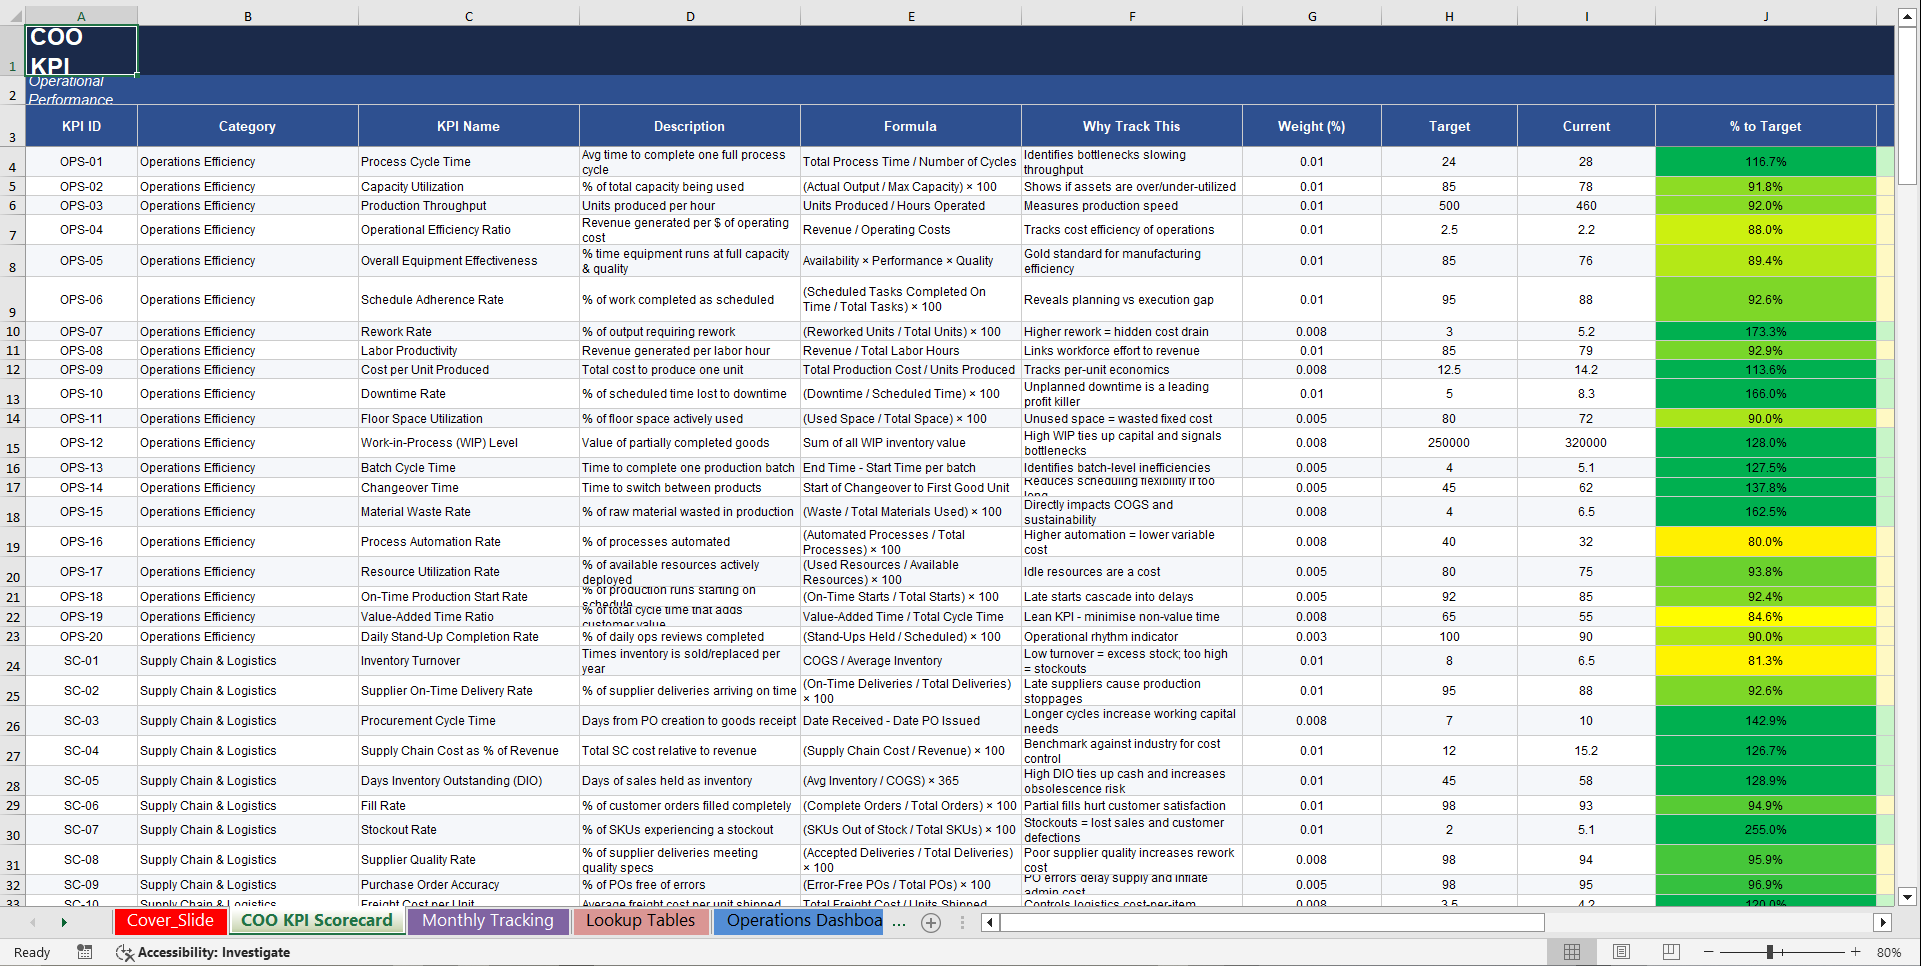
The tool contains 100+ professionally structured KPIs, each documented with a complete operational framework:
Each KPI includes:
• KPI ID
• Category
• KPI Name
• Description
• Formula
• Why Track This
• Weight (%)
• Target
• Current
• % to Target
• Status
• Priority
• Business Impact
• Light Indicator
• Trend
• Last Updated
This means your organization gains instant KPI governance, reporting clarity, and performance alignment.
⚙️ Monitor Every Critical Operations Domain
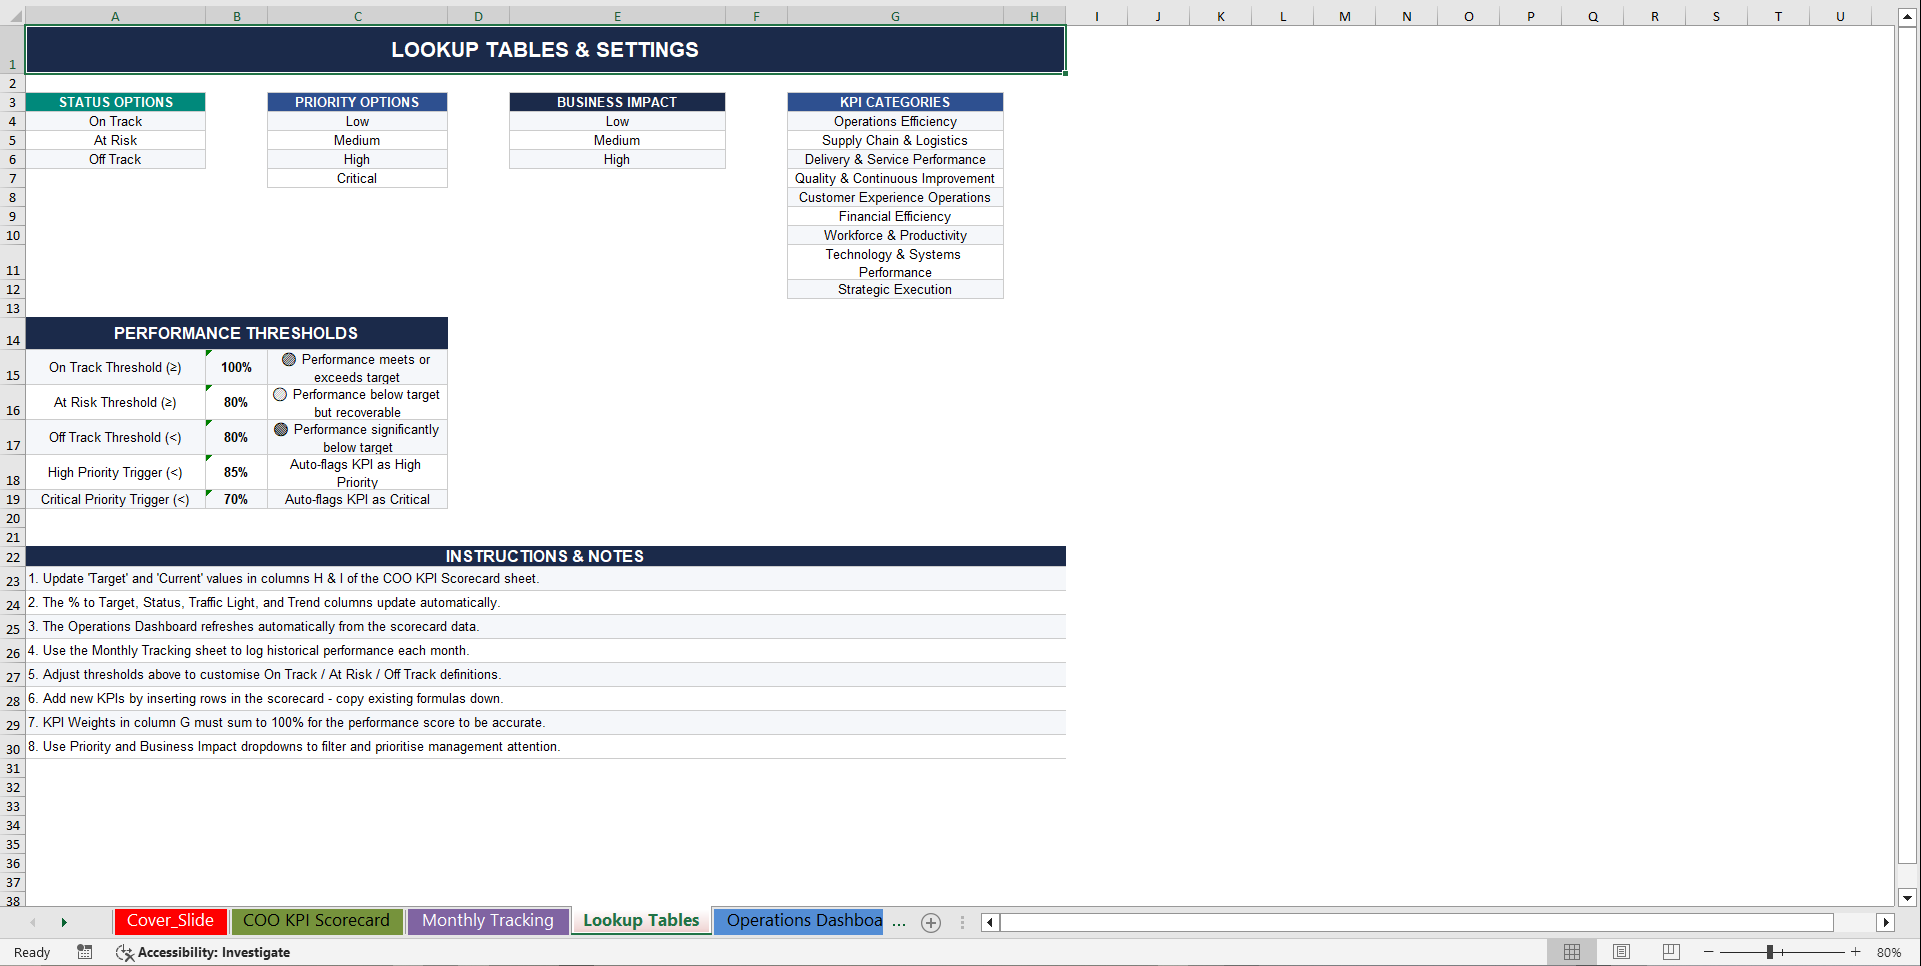
The COO KPI Scorecard organizes performance across 9 core operational categories:
Operations Efficiency
Track operational output and production performance:
• Process Cycle Time
• Capacity Utilization
• Production Throughput
• Operational Efficiency Ratio
• Overall Equipment Effectiveness
• Schedule Adherence Rate
• Rework Rate
• Labor Productivity
• Cost per Unit Produced
• Downtime Rate
• Floor Space Utilization
• Work-in-Process (WIP) Level
• Batch Cycle Time
• Changeover Time
• Material Waste Rate
• Process Automation Rate
• Resource Utilization Rate
• On-Time Production Start Rate
• Value-Added Time Ratio
• Daily Stand-Up Completion Rate
Supply Chain & Logistics
Optimize procurement and logistics performance:
• Inventory Turnover
• Supplier On-Time Delivery Rate
• Procurement Cycle Time
• Supply Chain Cost as % of Revenue
• Days Inventory Outstanding (DIO)
• Fill Rate
• Stockout Rate
• Supplier Quality Rate
• Purchase Order Accuracy
• Freight Cost per Unit
• Warehouse Capacity Utilization
• Perfect Order Rate
• Lead Time Variability
• Return Rate
• Backorder Rate
• Supplier Concentration Risk
• Inbound Logistics Cost
• Demand Forecast Accuracy
• Reverse Logistics Cost Rate
• Carrier On-Time Performance
Delivery & Service Performance
Ensure flawless order fulfillment:
• Order Fulfillment Rate
• On-Time Delivery Rate
• Order Fulfillment Cycle Time
• Service Response Time
• SLA Compliance Rate
• Delivery Accuracy Rate
• Last-Mile Delivery Cost
• Delivery Attempt Rate
• Order Cancellation Rate
• Picking Accuracy Rate
• Dock-to-Stock Time
• Emergency Shipment Rate
• Damage in Transit Rate
• Customer Delivery Satisfaction Score
Quality & Continuous Improvement
Drive operational excellence:
• Defect Rate
• First Pass Yield
• Process Error Rate
• Quality Incident Rate
• Cost of Poor Quality (COPQ)
• Customer Complaint Rate
• Audit Non-Conformance Rate
• Corrective Action Closure Rate
• Warranty Claim Rate
• Kaizen Ideas Implemented
• Six Sigma Projects Active
• Scrap Rate
• Internal Audit Completion Rate
Built to support Six Sigma, Lean Manufacturing, and continuous improvement frameworks.
Customer Experience Operations
Monitor operational impact on customers:
• Mean Time Between Failures (MTBF)
• Mean Time To Repair (MTTR)
• Average Support Resolution Time
• Customer Escalation Rate
• Support Ticket Backlog
• First Contact Resolution Rate
• Customer Effort Score (CES)
• Net Promoter Score (NPS)
• Customer Satisfaction Score (CSAT)
• Self-Service Resolution Rate
• Repeat Contact Rate
These are industry-standard metrics used by leaders applying the Net Promoter System.
Financial Efficiency
Connect operations directly to financial performance:
• Operating Cost Ratio
• EBITDA Margin
• Revenue per Employee
• Cost of Goods Sold (COGS) %
• Cash Conversion Cycle
• Operating Expense per Unit
• Budget Variance Rate
• Working Capital Efficiency
• Gross Margin
• SG&A as % of Revenue
• Capital Expenditure Efficiency
• Accounts Payable Days (DPO)
• Accounts Receivable Days (DSO)
• Cost Reduction Achievement
• Return on Assets (ROA)
Workforce & Productivity
Optimize the performance of your workforce:
• Employee Productivity Index
• Absenteeism Rate
• Employee Turnover Rate
• Labor Cost per Output Unit
• Time to Fill
• Training Completion Rate
• Employee Engagement Score
• Overtime Hours Rate
• Headcount vs Budget Variance
• Internal Promotion Rate
• New Hire Retention (90 Day)
• Safety Incident Rate
• Workforce Utilization Rate
• Skills Gap Coverage Rate
• Cost per Hire
• Performance Review Completion Rate
• Employee Net Promoter Score (eNPS)
• Cross-Training Coverage
• Labor Cost as % of Revenue
• Manager-to-Employee Ratio
Technology & Systems Performance
Ensure your operational technology runs flawlessly:
• System Uptime Rate
• IT Incident Resolution Time
• Automation Rate
• Digital Adoption Rate
• Data Accuracy Rate
• Cybersecurity Incident Rate
• Technology ROI
• Mean Time to Detect (MTTD)
• Change Success Rate
• Software License Utilization
• API Availability Rate
• Help Desk Ticket Volume
• Data Backup Success Rate
• Cloud Cost Efficiency
• ERP Data Completeness
Strategic Execution
Measure how well operations drive strategy:
• Strategic Initiative Completion Rate
• Project On-Time Delivery Rate
• OKR Completion Rate
• Budget Adherence Rate
• Revenue vs Target
• Market Share Growth
• New Product/Service Launch Rate
• Risk Mitigation Coverage
• Cross-Functional Project Completion
• Decision Turnaround Time
• Board Reporting Accuracy
• Operational Plan Adherence
• Partnership/Vendor KPI Achievement
• Innovation Pipeline Value
• Strategic Resource Allocation Efficiency
Fully compatible with Objectives and Key Results frameworks.
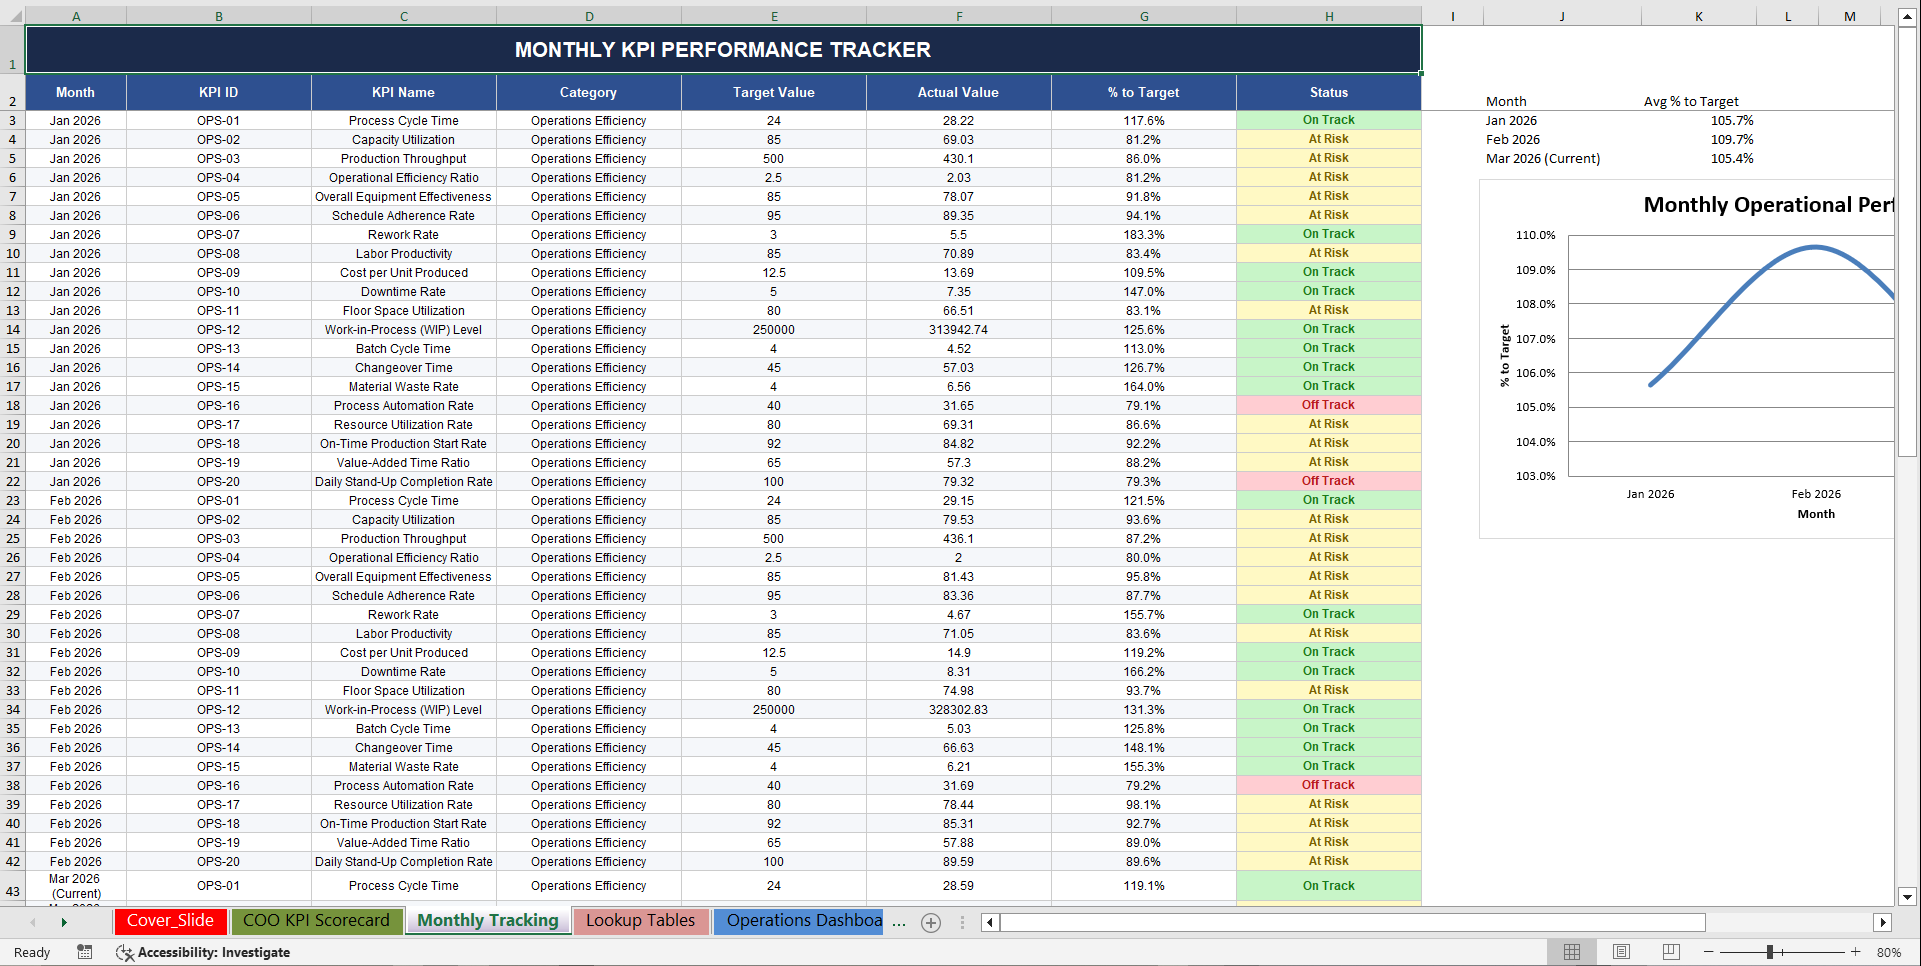
📈 Powerful Dynamic COO Dashboard
The Excel tool includes a fully automated executive dashboard displaying:
Operational Overview
• Total KPIs
• 🟢 On Track
• 🟡 At Risk
• 🔴 Off Track
• Avg % to Target
• Critical Priority KPIs
• Ops Performance Score
Plus category performance breakdowns across:
• Operations Efficiency
• Supply Chain & Logistics
• Delivery & Service Performance
• Quality & Continuous Improvement
• Customer Experience Operations
• Financial Efficiency
• Workforce & Productivity
• Technology & Systems Performance
• Strategic Execution
This means one glance tells you exactly where operations are winning – and where they are failing.
💡 Why Operations Leaders Love This Tool
1️⃣ Instant Executive Visibility
No more digging through reports.
Your entire operational ecosystem is visible in one place.
2️⃣ Data-Driven Leadership
Make decisions backed by 100+ operational KPIs instead of intuition.
3️⃣ Align Teams to Strategy
Every KPI connects daily operations to business outcomes.
4️⃣ Identify Bottlenecks Fast
Spot inefficiencies across production, supply chain, service, and finance instantly.
5️⃣ Built for Real-World COOs
Designed around how operations leaders actually run companies.
🧠 Perfect For
• Chief Operating Officers
• Operations Directors
• Operations Consultants
• Strategy & Operations Teams
• Private Equity Portfolio Companies
• Manufacturing Leaders
• Logistics & Supply Chain Executives
• Scaling Startups
🔥 What You Get
✔ Complete COO KPI Scorecard Excel Tool
✔ 100+ Operational KPIs fully structured
✔ Executive dashboard with performance scoring
✔ KPI formulas & descriptions included
✔ Target vs current tracking
✔ Traffic-light status indicators
✔ Strategic priority system
✔ Category performance breakdown
✔ Plug-and-play Excel format
No setup.
No consultants.
No software implementation.
Just open Excel and start running operations like a world-class COO.
📊 Turn Operations Into a Competitive Advantage
Elite companies don't win because they work harder.
They win because they measure, optimize, and execute better than everyone else.
The COO KPI Scorecard gives you the data visibility, operational control, and performance discipline required to scale operations with confidence.
⚡ Get the COO KPI Scorecard Today
Start running your organization with real operational intelligence.
Track performance.
Identify bottlenecks.
Optimize processes.
Drive operational excellence.
Download the COO KPI Scorecard now and transform how your operations perform. 🚀
Key Words:
Strategy & Transformation, Growth Strategy, Strategic Planning, Strategy Frameworks, Innovation Management, Pricing Strategy, Core Competencies, Strategy Development, Business Transformation, Marketing Plan Development, Product Strategy, Breakout Strategy, Competitive Advantage, Mission, Vision, Values, Strategy Deployment & Execution, Innovation, Vision Statement, Core Competencies Analysis, Corporate Strategy, Product Launch Strategy, BMI, Blue Ocean Strategy, Breakthrough Strategy, Business Model Innovation, Business Strategy Example, Corporate Transformation, Critical Success Factors, Customer Segmentation, Customer Value Proposition, Distinctive Capabilities, Enterprise Performance Management, KPI, Key Performance Indicators, Market Analysis, Market Entry Example, Market Entry Plan, Market Intelligence, Market Research, Market Segmentation, Market Sizing, Marketing, Michael Porter's Value Chain, Organizational Transformation, Performance Management, Performance Measurement, Platform Strategy, Product Go-to-Market Strategy, Reorganization, Restructuring, SWOT, SWOT Analysis, Service 4.0, Service Strategy, Service Transformation, Strategic Analysis, Strategic Plan Example, Strategy Deployment, Strategy Execution, Strategy Frameworks Compilation, Strategy Methodologies, Strategy Report Example, Value Chain, Value Chain Analysis, Value Innovation, Value Proposition, Vision Statement, Corporate Strategy, Business Development, Business plan pdf, business plan, PDF, Business Plan DOC, Business Plan Template, PPT, Market strategy playbook, strategic market planning, competitive analysis tools, market segmentation frameworks, growth strategy templates, product positioning strategy, market execution toolkit, strategic alignment playbook, KPI and OKR frameworks, business growth strategy guide, cross-functional strategy templates, market risk management, market strategy PowerPoint doc, guide, ebook, e-book ,McKinsey Change Playbook, Organizational change management toolkit, Change management frameworks 2025, Influence model for change, Change leadership strategies, Behavioral change in organizations, Change management PowerPoint templates, Transformational leadership in change, supply chain KPIs, supply chain KPI toolkit, supply chain PowerPoint template, logistics KPIs, procurement KPIs, inventory management KPIs, supply chain performance metrics, manufacturing KPIs, supply chain dashboard, supply chain strategy KPIs, reverse logistics KPIs, sustainability KPIs in supply chain, financial supply chain KPIs, warehouse KPIs, digital supply chain KPIs, 1200 KPIs, supply chain scorecard, KPI examples, supply chain templates, Corporate Finance SOPs, Finance SOP Excel Template, CFO Toolkit, Finance Department Procedures, Financial Planning SOPs, Treasury SOPs, Accounts Payable SOPs, Accounts Receivable SOPs, General Ledger SOPs, Accounting Policies Template, Internal Controls SOPs, Finance Process Standardization, Finance Operating Procedures, Finance Department Excel Template, FP&A Process Documentation, Corporate Finance Template, Finance SOP Toolkit, CFO Process Templates, Accounting SOP Package, Tax Compliance SOPs, Financial Risk Management Procedures.
NOTE: Our digital products are sold on an "as is" basis, making returns and refunds unavailable post-download. Please preview and inquire before purchasing. Please contact us before purchasing if you have any questions! This policy aligns with the standard Flevy Terms of Usage.
Got a question about the product? Email us at support@flevy.com or ask the author directly by using the "Ask the Author a Question" form. If you cannot view the preview above this document description, go here to view the large preview instead.
Source: Best Practices in Key Performance Indicators Excel: COO (Chief Operating Officer) KPI Scorecard Excel (XLSX) Spreadsheet, SB Consulting
ABOUT THE AUTHOR
SB Consulting is dedicated to empowering businesses to communicate their ideas with impact. This consulting firm specializes in teaching organizations how to create effective corporate and management presentations. With training from top-tier global consulting firms, including McKinsey, BCG, and Porsche Consulting, extensive expertise in presentation design and ... [read more]
Ask the Author a Question
You must be logged in to contact the author.
