
 Click main image to view in full screen. Unlock all 18 preview images:
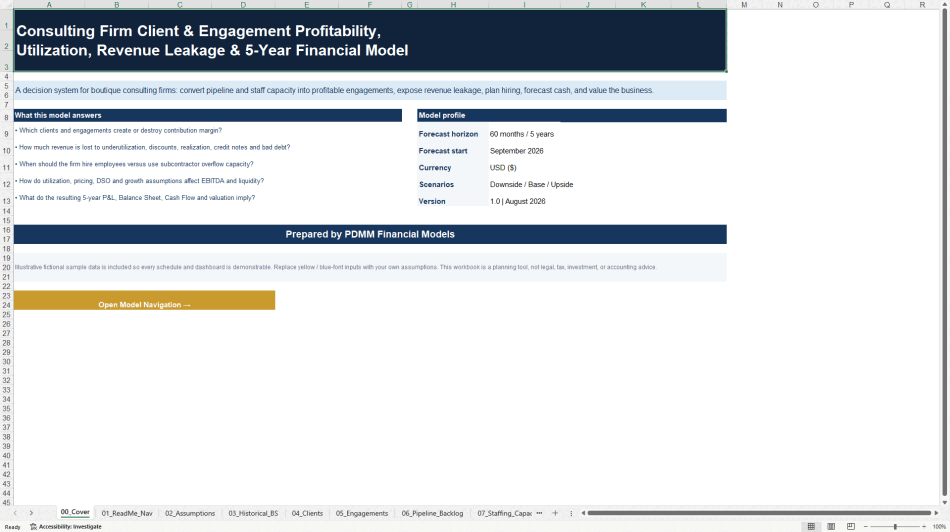
Consulting Firm Profitability & 5-Year Financial Model – Excel XLSX
Excel (XLSX) + supplemental PDF


BENEFITS OF THIS DOWNLOADABLE EXCEL DOCUMENT
- Connect consulting pipeline, engagements, staffing, utilization, pricing, and revenue leakage to an integrated five-year P&L, Balance Sheet, and Cash Flow forecast.
- Evaluate client and engagement profitability, delivery capacity, hiring economics, working capital, break-even, and scenario outcomes in one editable decision model.
- Use executive dashboards, sensitivities, DCF valuation, EBITDA-multiple cross-checks, and independent model checks to support planning and management decisions.
CONSULTING SALES EXCEL DESCRIPTION
CONSULTING FIRM PROFITABILITY & 5-YEAR FINANCIAL MODEL
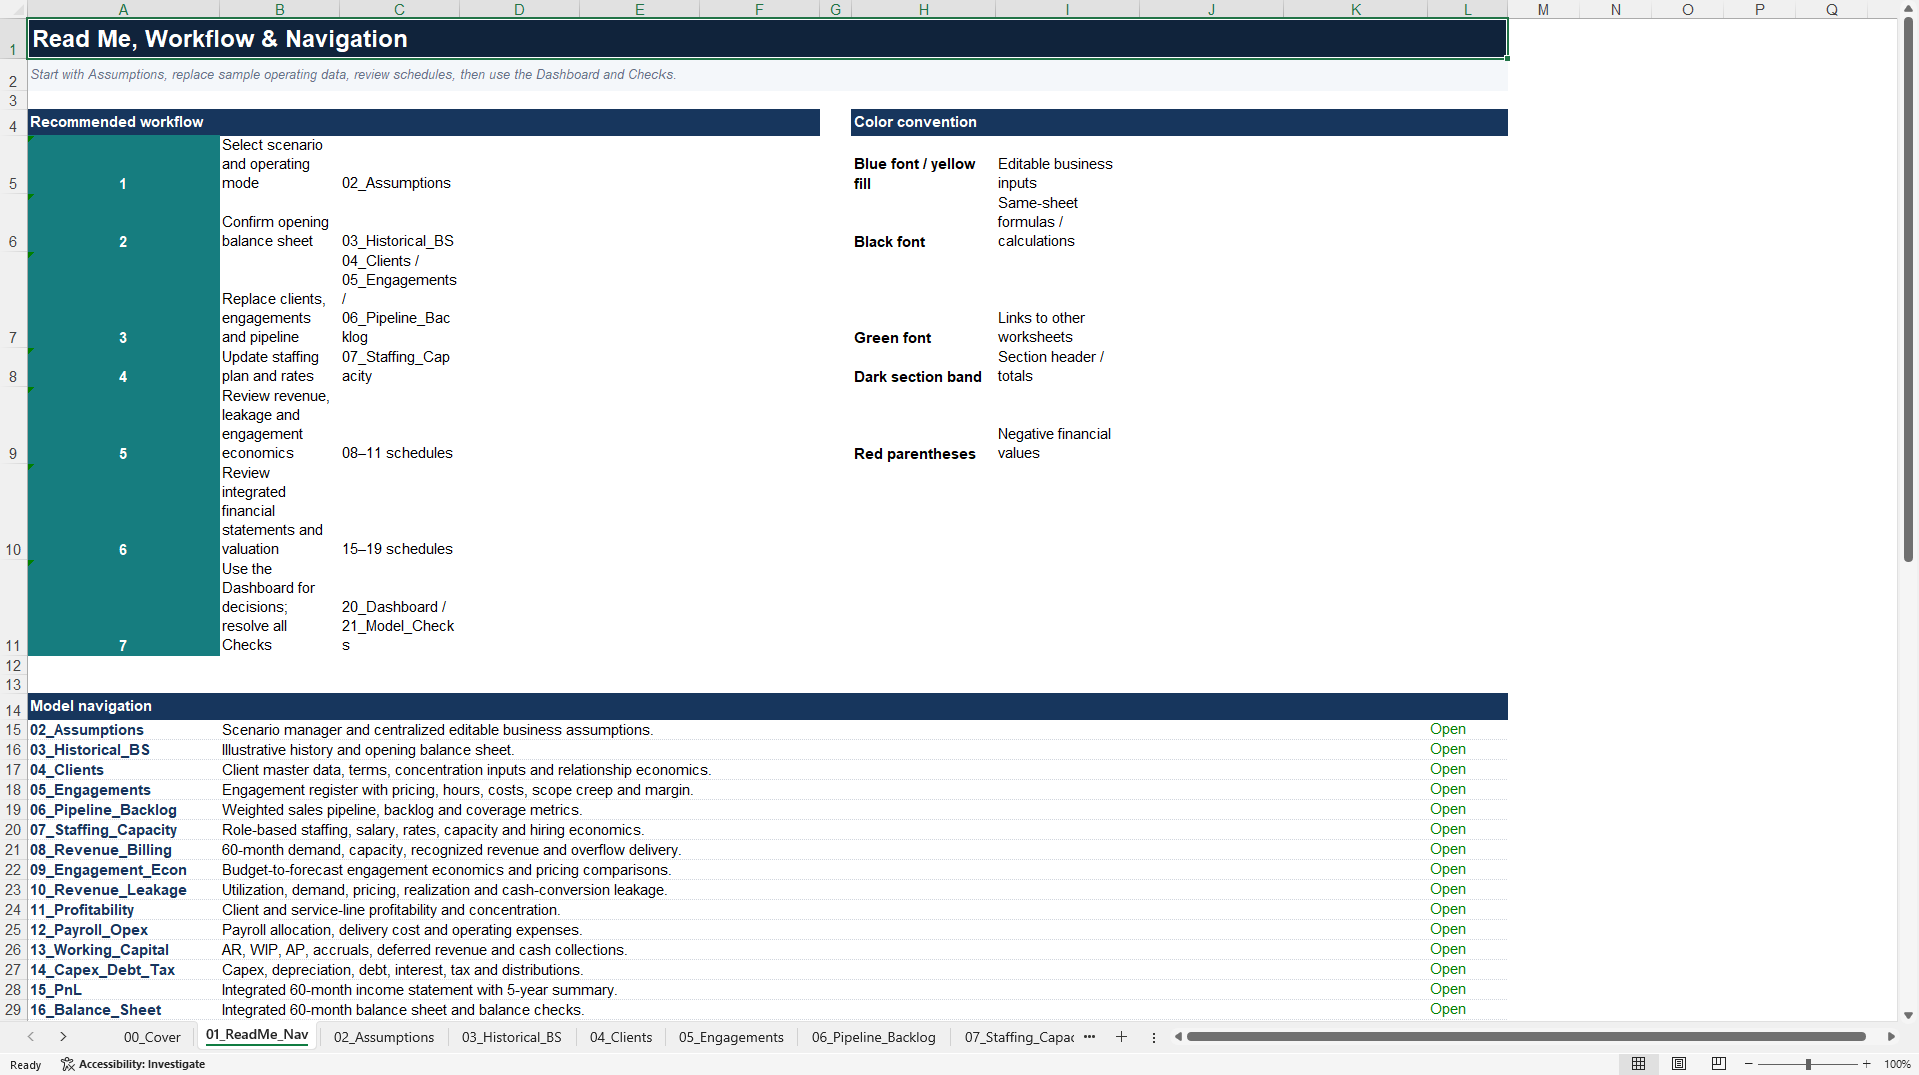
This Excel model is built for boutique consulting and professional-services firms that need to understand not only how fast revenue can grow, but whether that growth can be delivered profitably and converted into cash. It links the commercial pipeline to engagements, staffing capacity, utilization, pricing, revenue leakage, working capital, financing, and a complete five-year financial forecast.
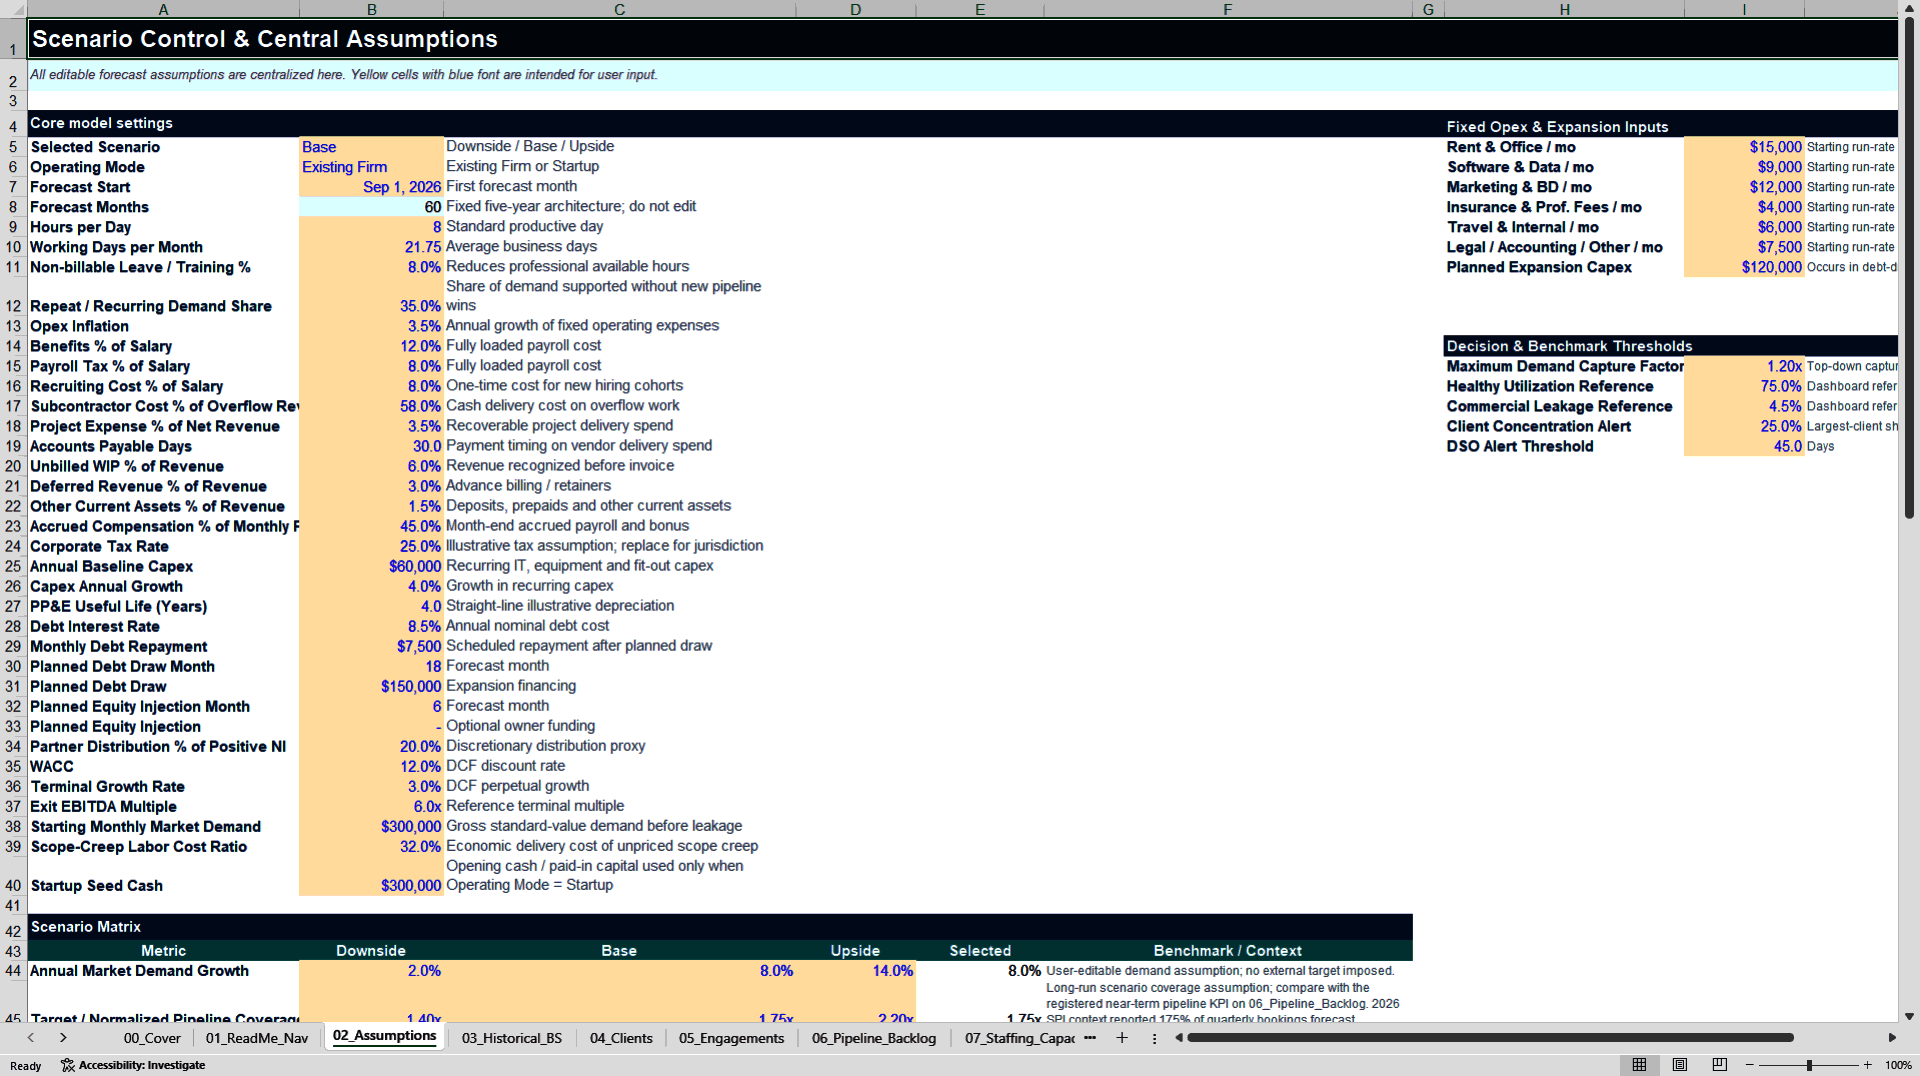
The model contains 60 monthly forecast periods with Year 1 through Year 5 summaries. Users can operate the workbook in Existing Firm or Startup mode and switch between Downside, Base, and Upside scenarios. Scenario assumptions cover market demand growth, normalized pipeline coverage, win rate, utilization, realization, discounts, credit notes, bad debt, billing-rate growth, salary inflation, scope creep, unrecovered expenses, DSO, subcontractor overflow capacity, and annual attrition.
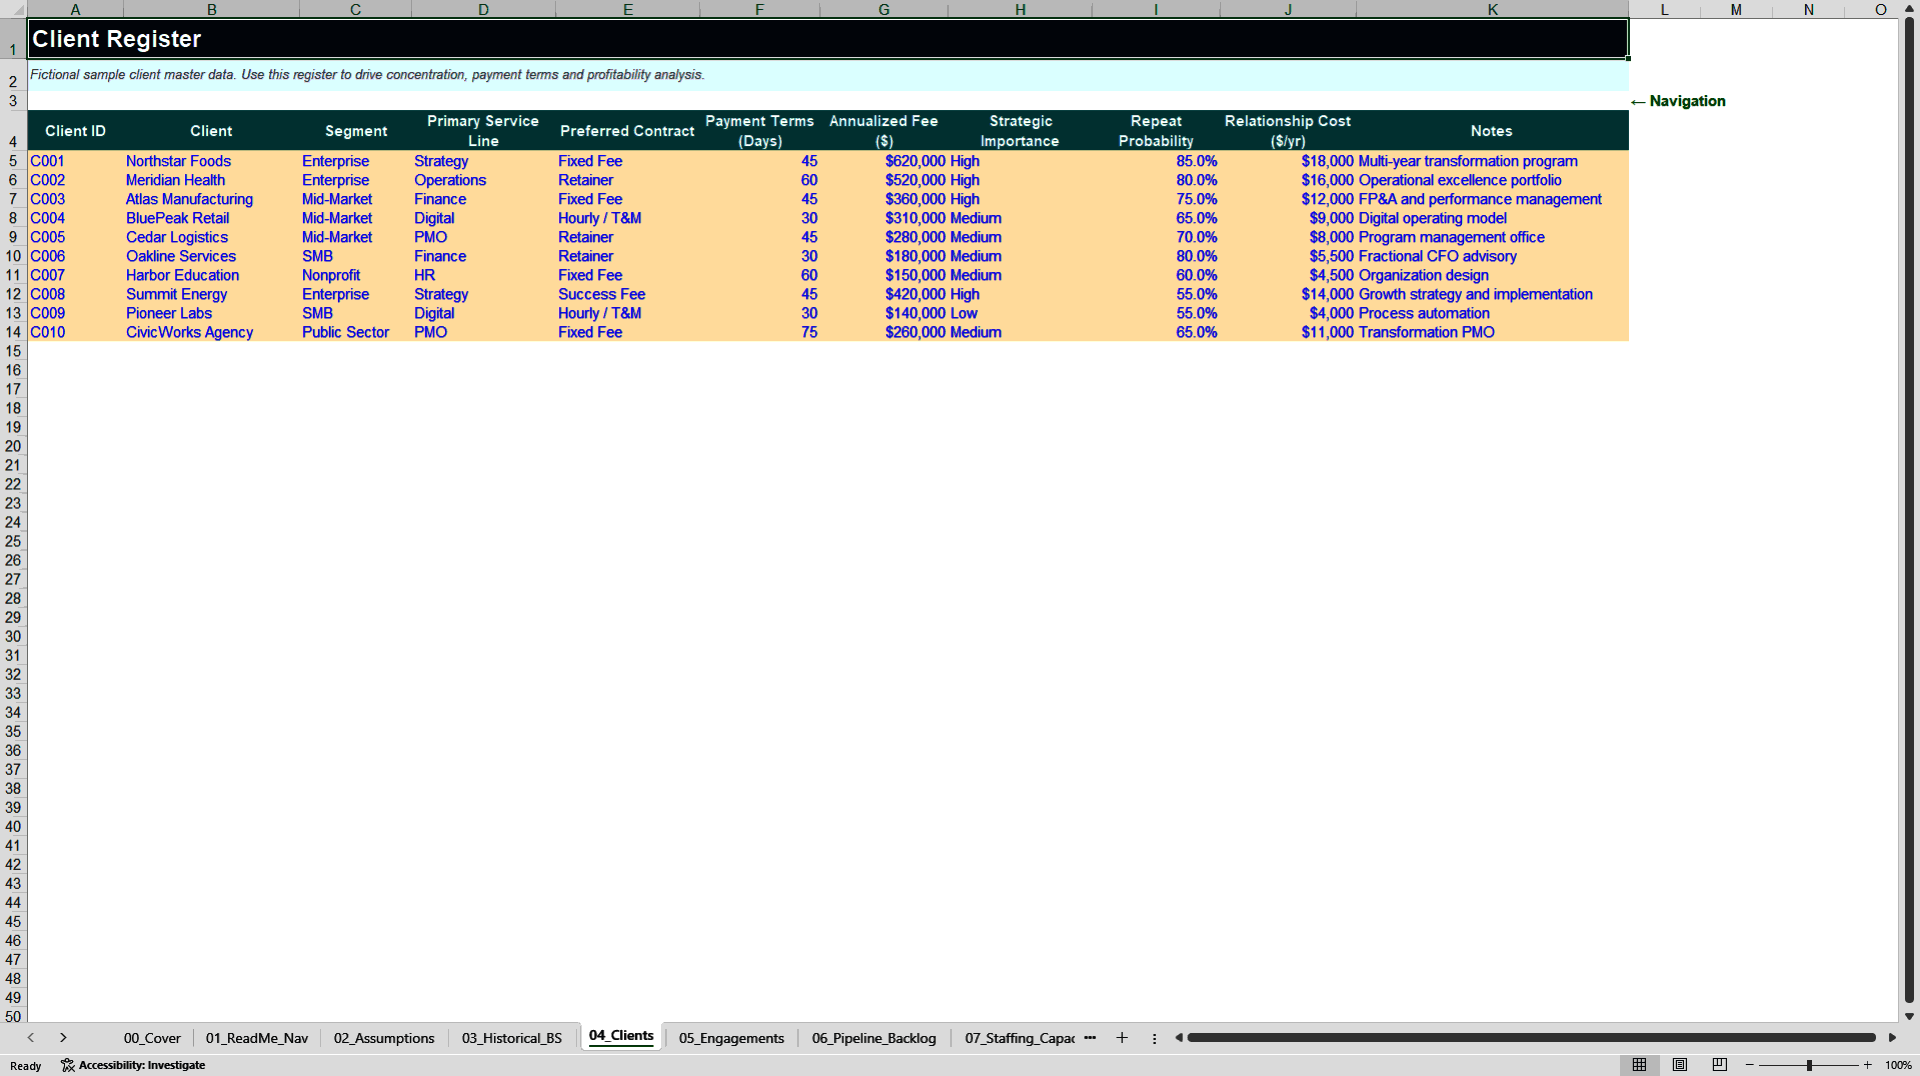
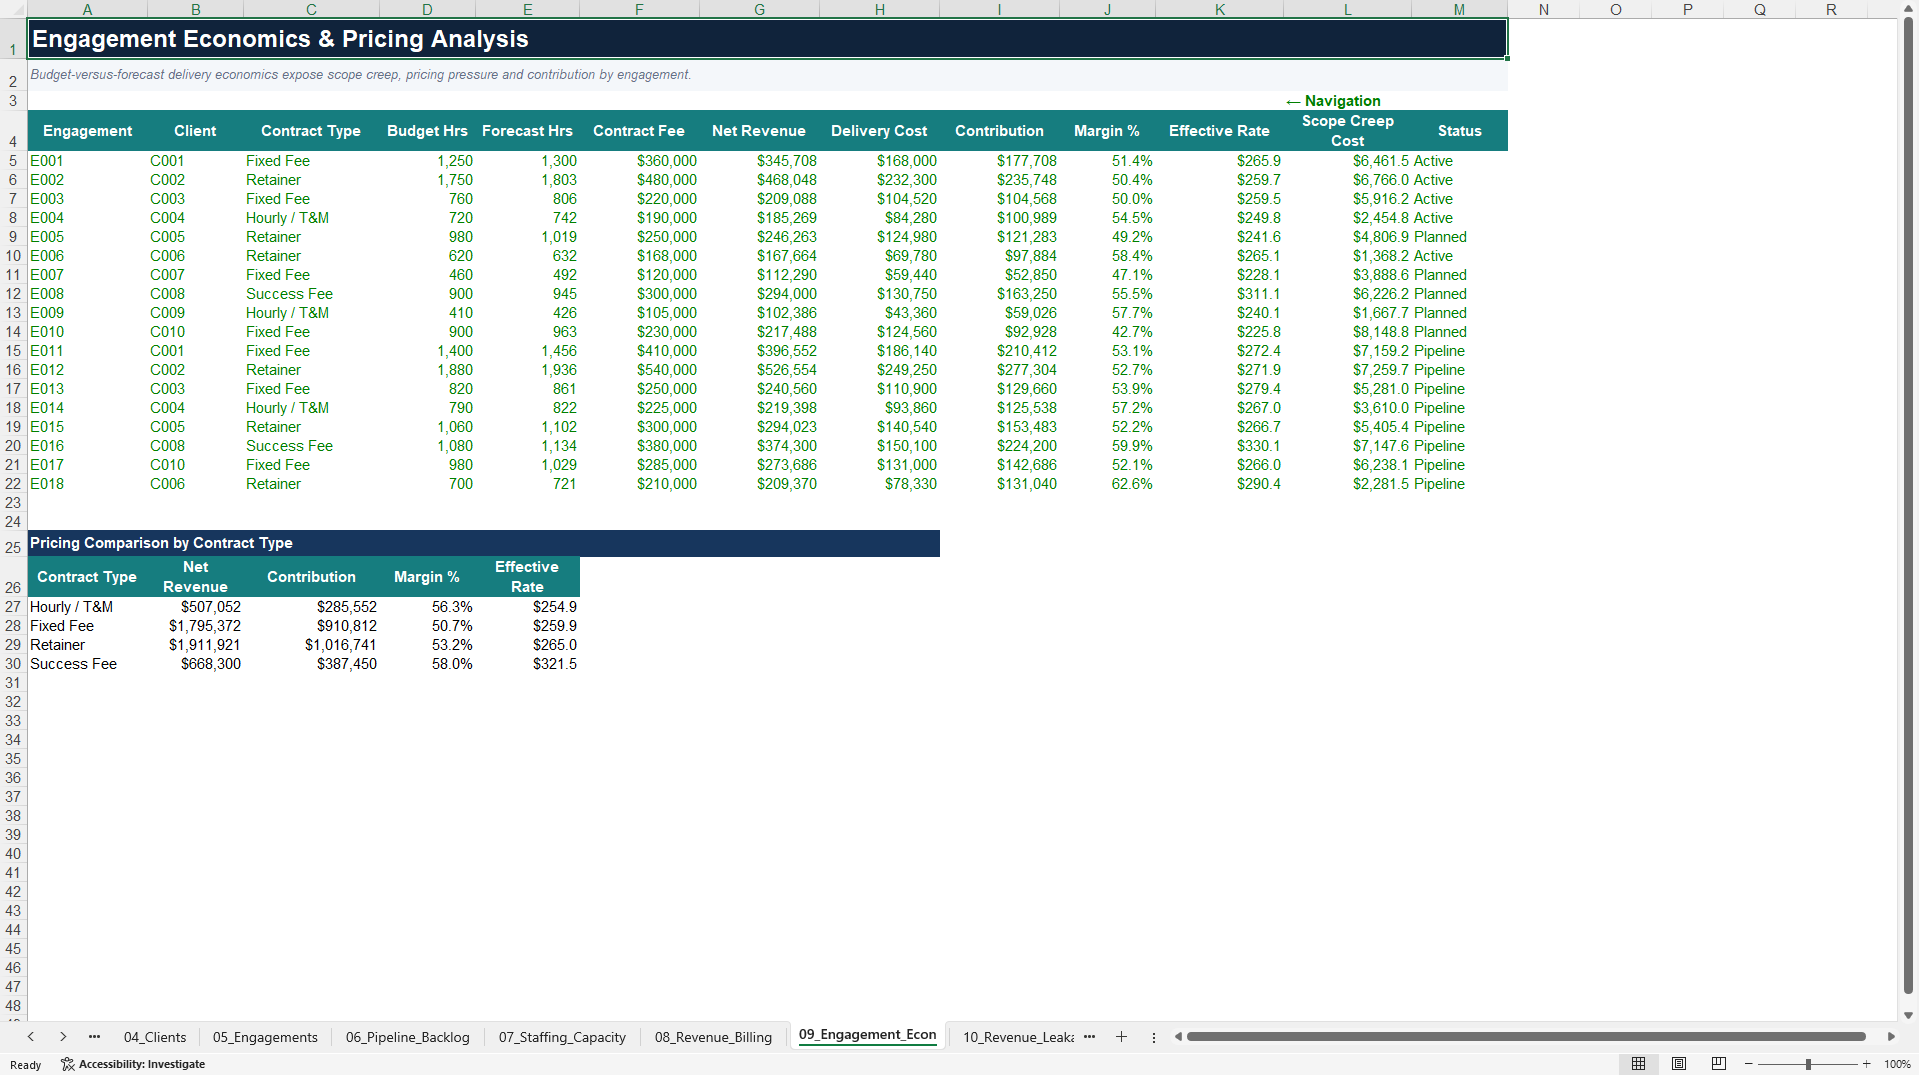
A client register captures segment, service line, contract preference, payment terms, repeat probability, strategic importance, annualized fee, and relationship cost. The engagement register supports hourly or time-and-materials, fixed-fee, retainer, and success-fee work, with inputs for contract fee, budget hours, direct cost, project expenses, discounts, scope creep, and write-downs. The model calculates forecast hours, net revenue, delivery cost, contribution margin, margin percentage, and effective billing rate for each engagement.
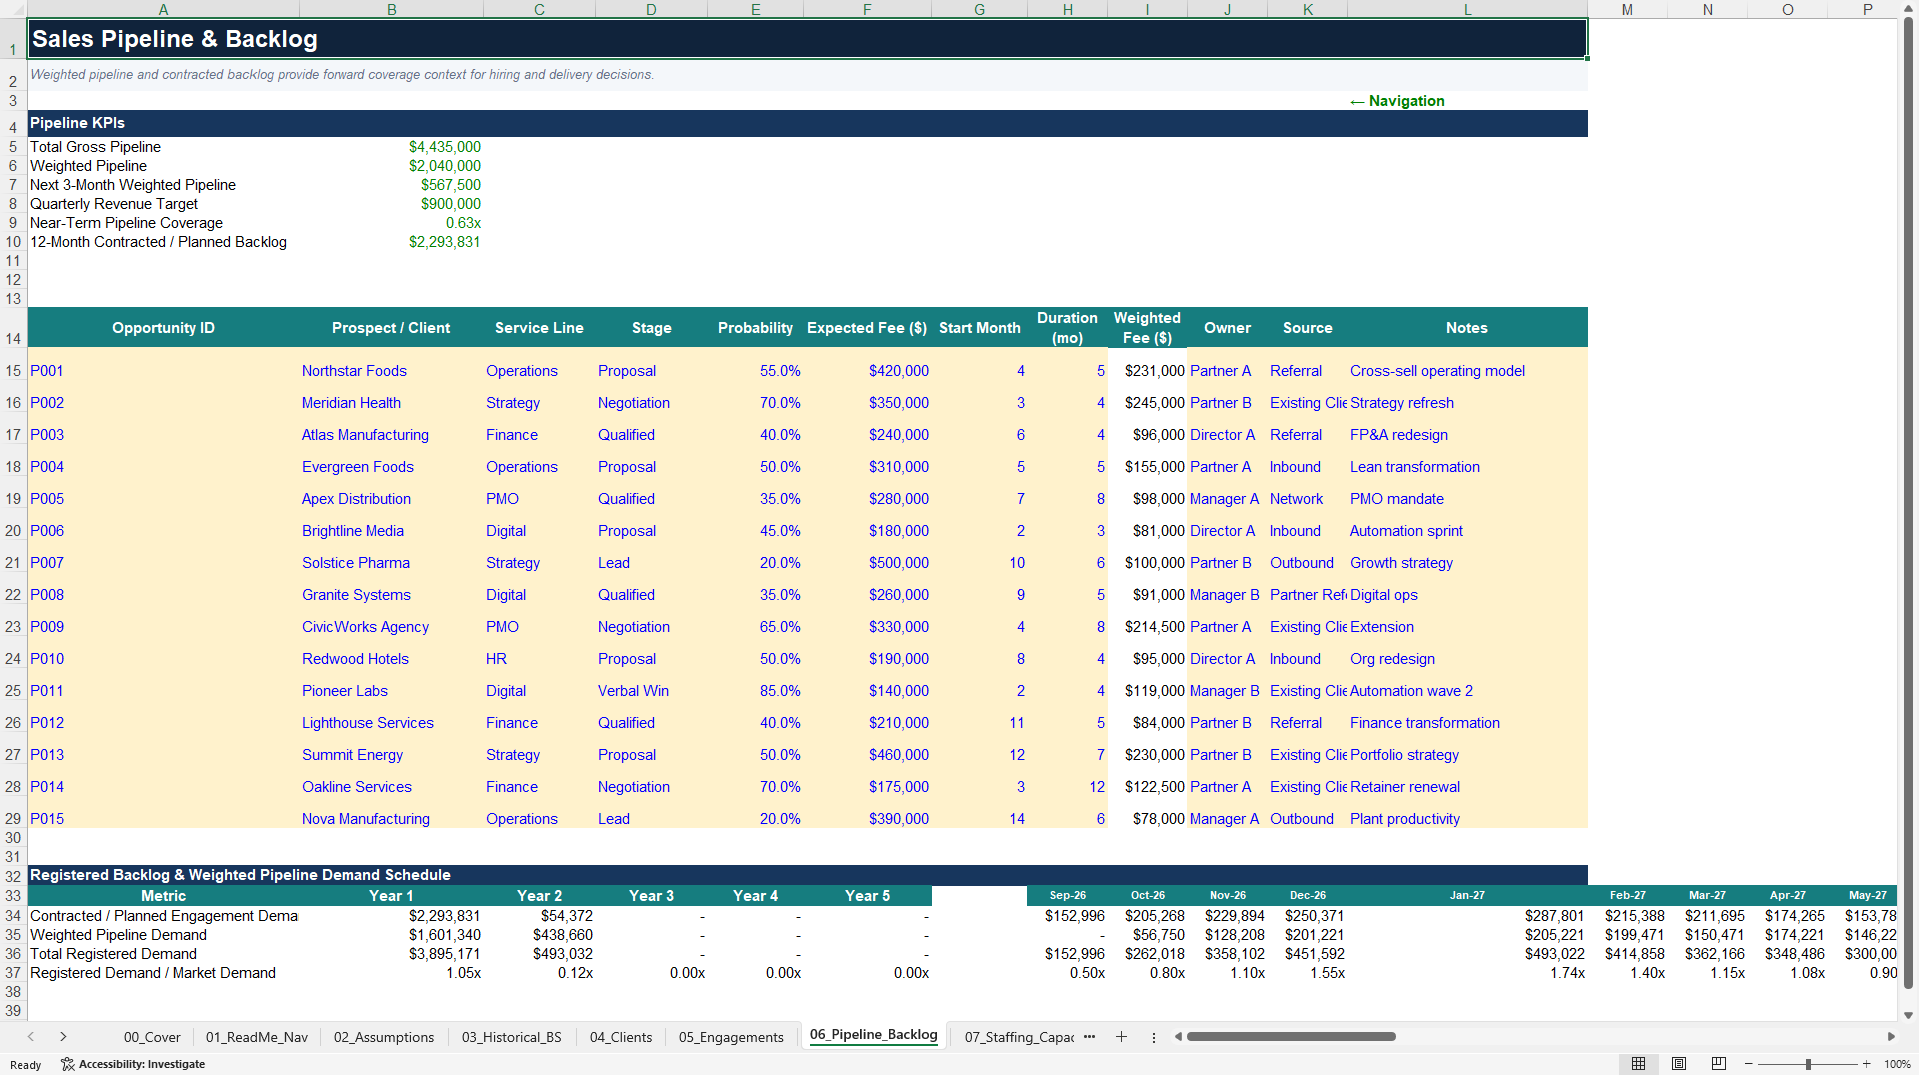
The sales pipeline and backlog schedule calculates gross pipeline, weighted pipeline, near-term pipeline coverage, contracted and planned backlog, and a monthly registered-demand schedule. That demand is linked to the revenue engine rather than being displayed as a disconnected sales table.
The staffing and capacity schedule covers partners, directors and managers, senior consultants, consultants, analysts, business development, administration, and planned hiring cohorts. Effective FTE changes with each cohort's start month and the selected annual attrition rate. The model calculates payroll, billable payroll, professional available hours, gross productive value, internal billable capacity, subcontractor overflow capacity, total delivery capacity, break-even utilization, and hiring economics.
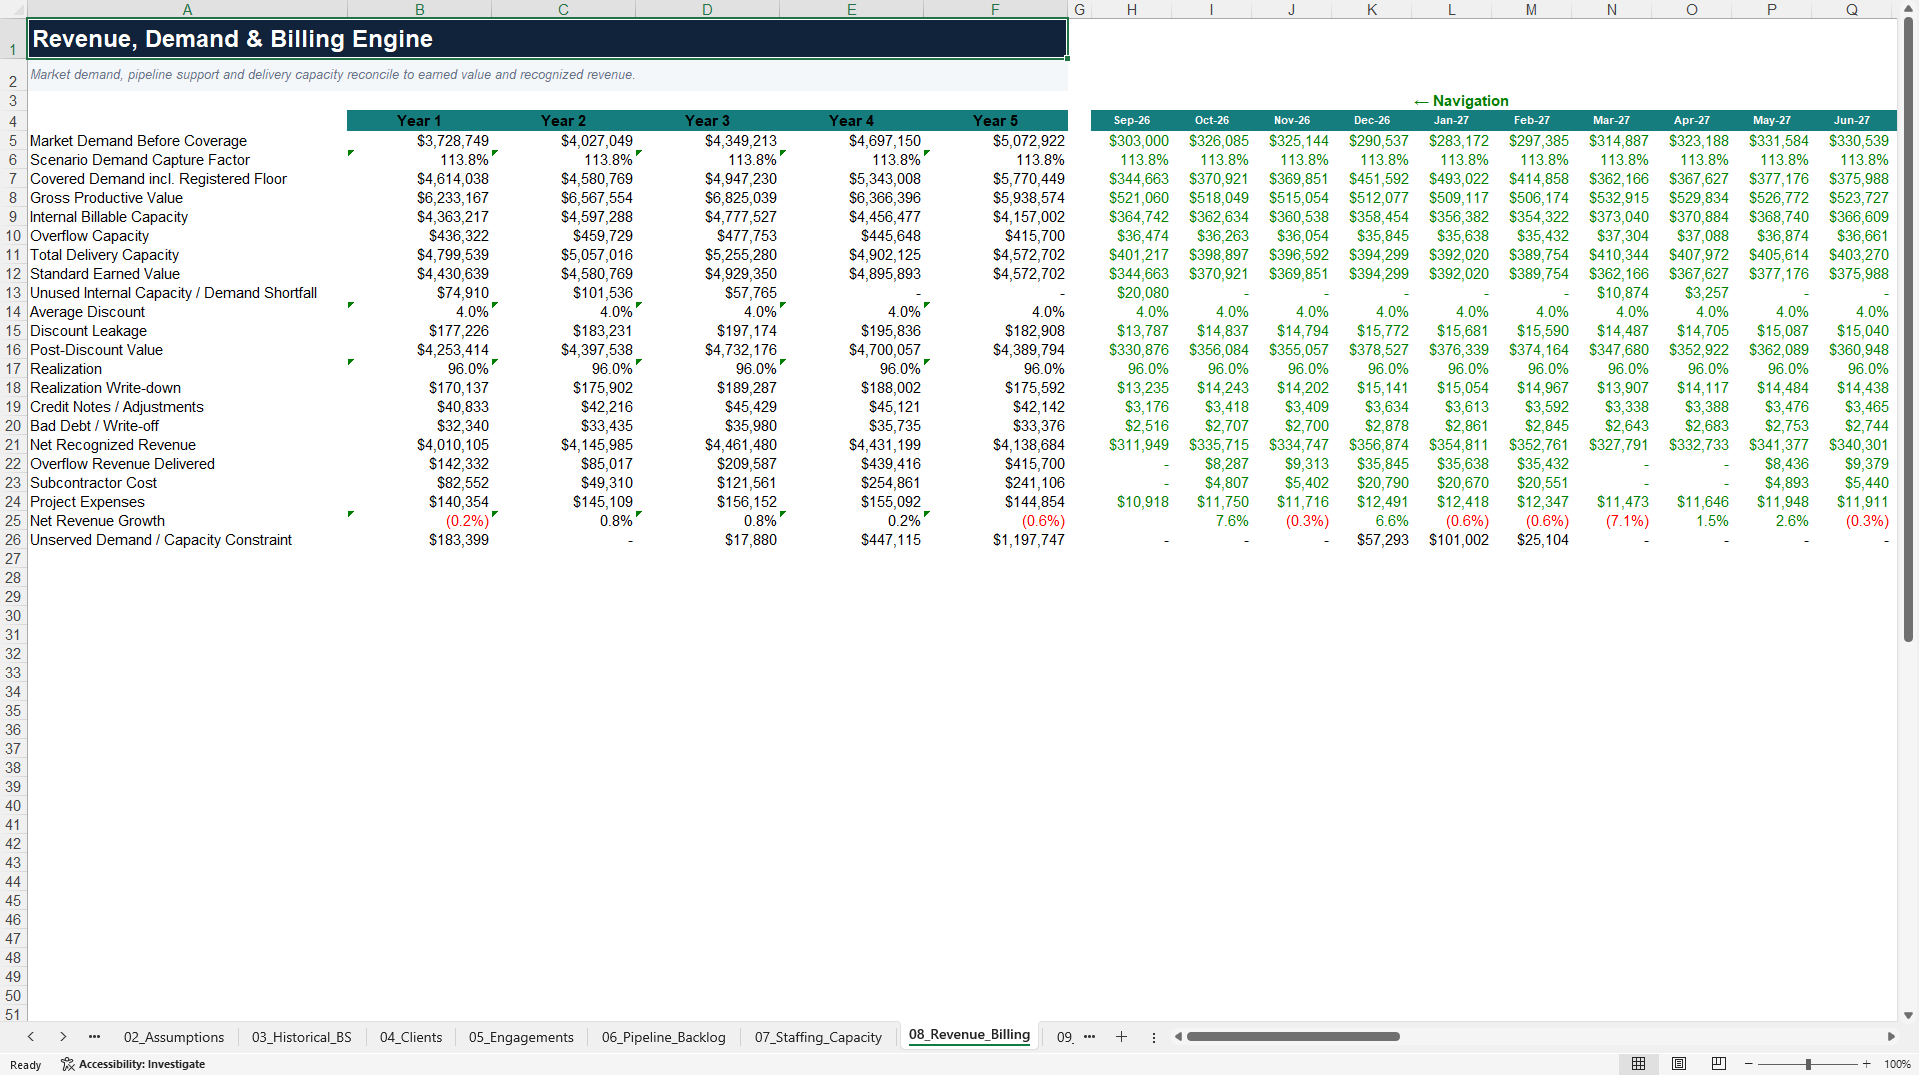
Revenue is constrained by covered demand and delivery capacity. The model distinguishes unused internal capacity from demand that cannot be served because total capacity is insufficient. It then bridges standard earned value through discounts, realization write-downs, credit notes, and bad debt to net recognized revenue. A separate revenue-leakage schedule measures utilization loss, unused capacity, commercial leakage, scope-creep economics, unrecovered expenses, AR, unbilled WIP, and cash-conversion assets.
The working-capital model separates recognized revenue, invoicing, and cash receipts using AR, DSO, unbilled WIP, AP, accrued compensation, deferred revenue, and customer cash collections. Payroll and operating expenses are linked to centralized assumptions, while the capex, depreciation, debt, interest, tax, equity-contribution, and partner-distribution schedules feed the integrated statements.
The Profit & Loss, Balance Sheet, and Cash Flow statements are fully linked. The analysis section adds break-even revenue, margin of safety, break-even utilization, revenue per billable FTE, break-even billable headcount, billing-rate-versus-utilization sensitivity, DSO-versus-commercial-leakage sensitivity, and planned-hire economics.
Valuation includes a discounted cash flow based on unlevered free cash flow and an EBITDA-multiple cross-check. The executive dashboard combines revenue, EBITDA margin, utilization, commercial leakage, cash, weighted pipeline and near-term coverage, Year-5 revenue, and reference equity value. Decision charts and action messages focus on capacity, leakage, collections, and client concentration.
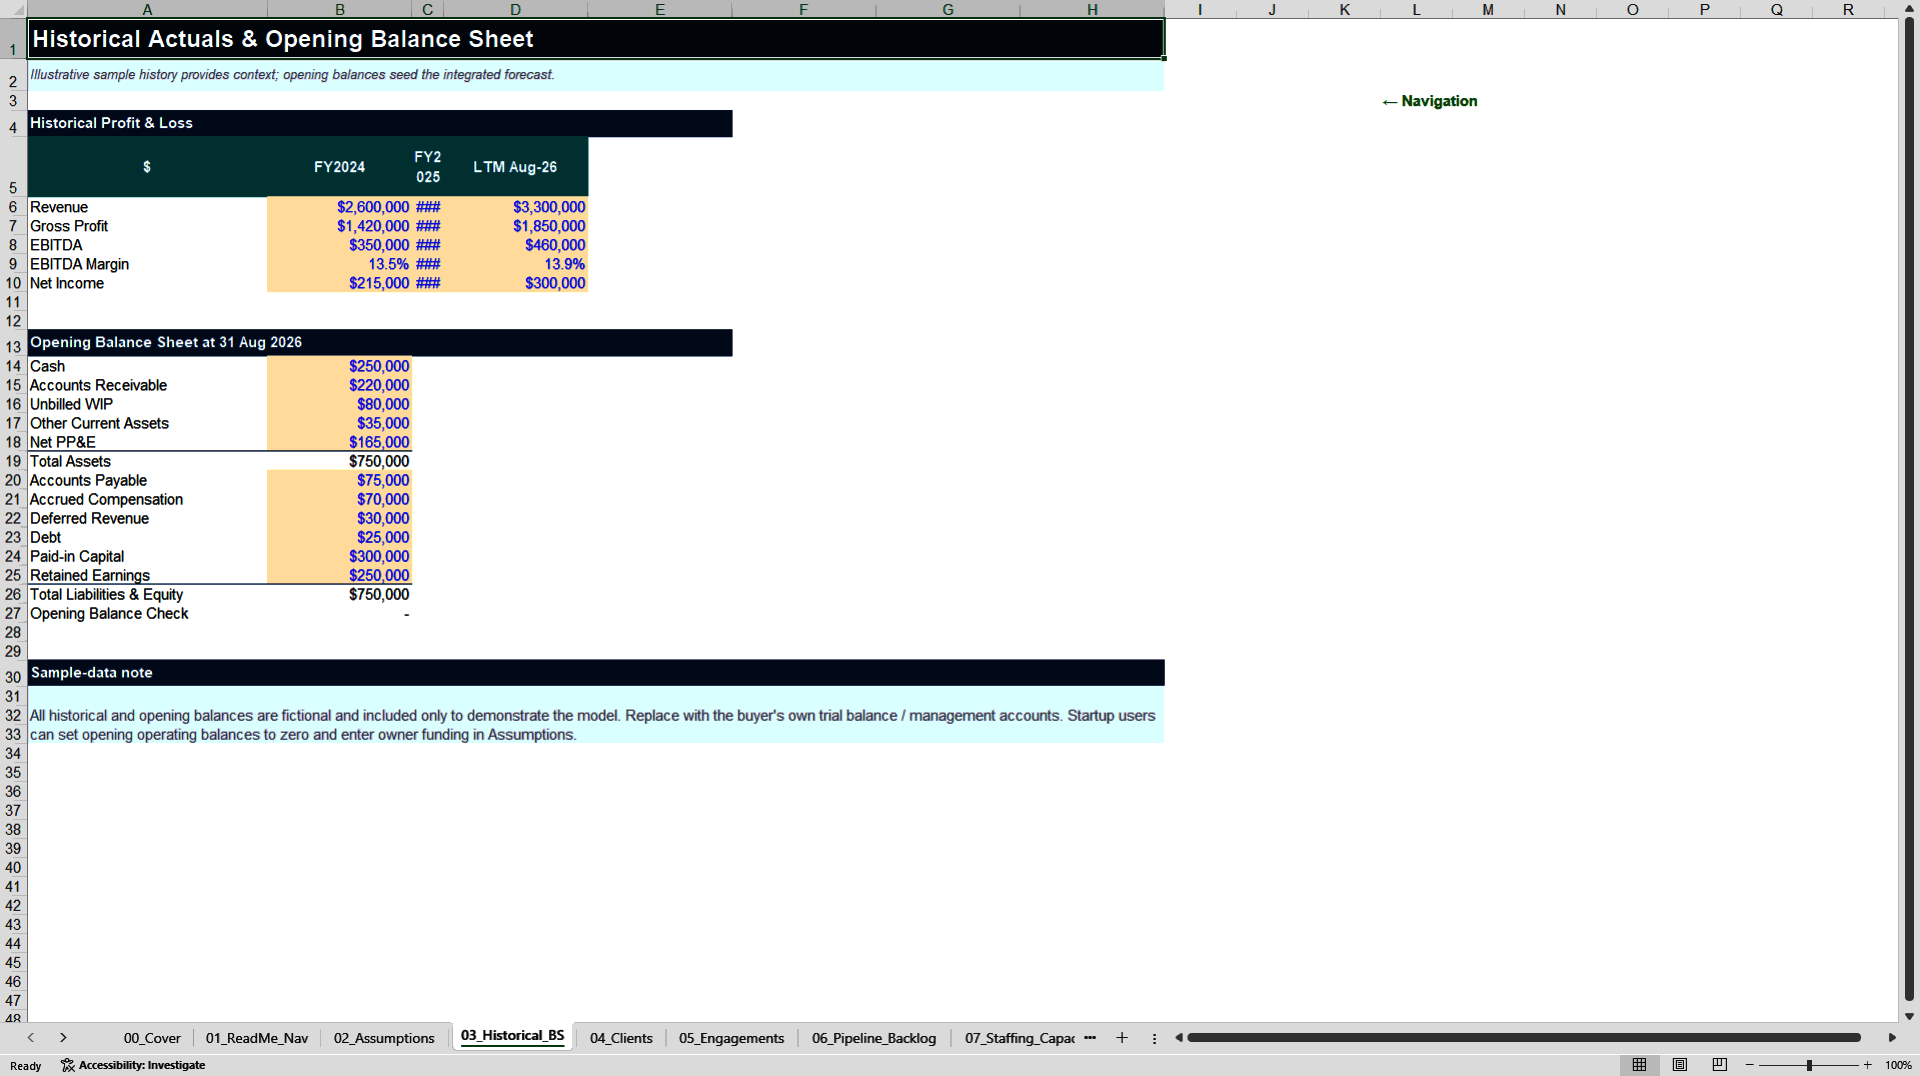
The workbook also includes independent model checks covering balance-sheet integrity, cash reconciliation, revenue reconciliation, scenario bounds, debt and PP&E roll-forwards, forecast dates, attrition linkage, profitability scope, and register boundaries. Fictional sample data is included so the model can be reviewed immediately and then replaced with the user's own consulting-firm information.
This product is suitable for consulting-firm owners, managing partners, practice leaders, CFOs, controllers, advisers, and independent consultants building a team who want a practical operating and financial model rather than a generic business-plan spreadsheet.
Got a question about the product? Email us at support@flevy.com or ask the author directly by using the "Ask the Author a Question" form. If you cannot view the preview above this document description, go here to view the large preview instead.
Source: Best Practices in Consulting Sales, Integrated Financial Model Excel: Consulting Firm Profitability & 5-Year Financial Model Excel (XLSX) Spreadsheet, PDMM Financial Models
ABOUT THE AUTHOR

PDMM Financial Models develops professional, decision-ready Excel models for business owners, entrepreneurs, investors, consultants, analysts, and finance teams. Our objective is to transform complex business assumptions into clear, structured analysis that supports better planning and investment decisions.
Our models cover business planning, forecasting, budgeting, feasibility analysis,
... [read more]
Ask the Author a Question
You must be logged in to contact the author.