
 Click main image to view in full screen.
Co-Located Solar + BESS: Shared-POI Underwriting – Excel XLSX
Excel (XLSX) + supplemental PDF


BENEFITS OF THIS DOWNLOADABLE EXCEL DOCUMENT
- Value the same hybrid project twice and see how much of the sponsor case survives a shared grid connection.
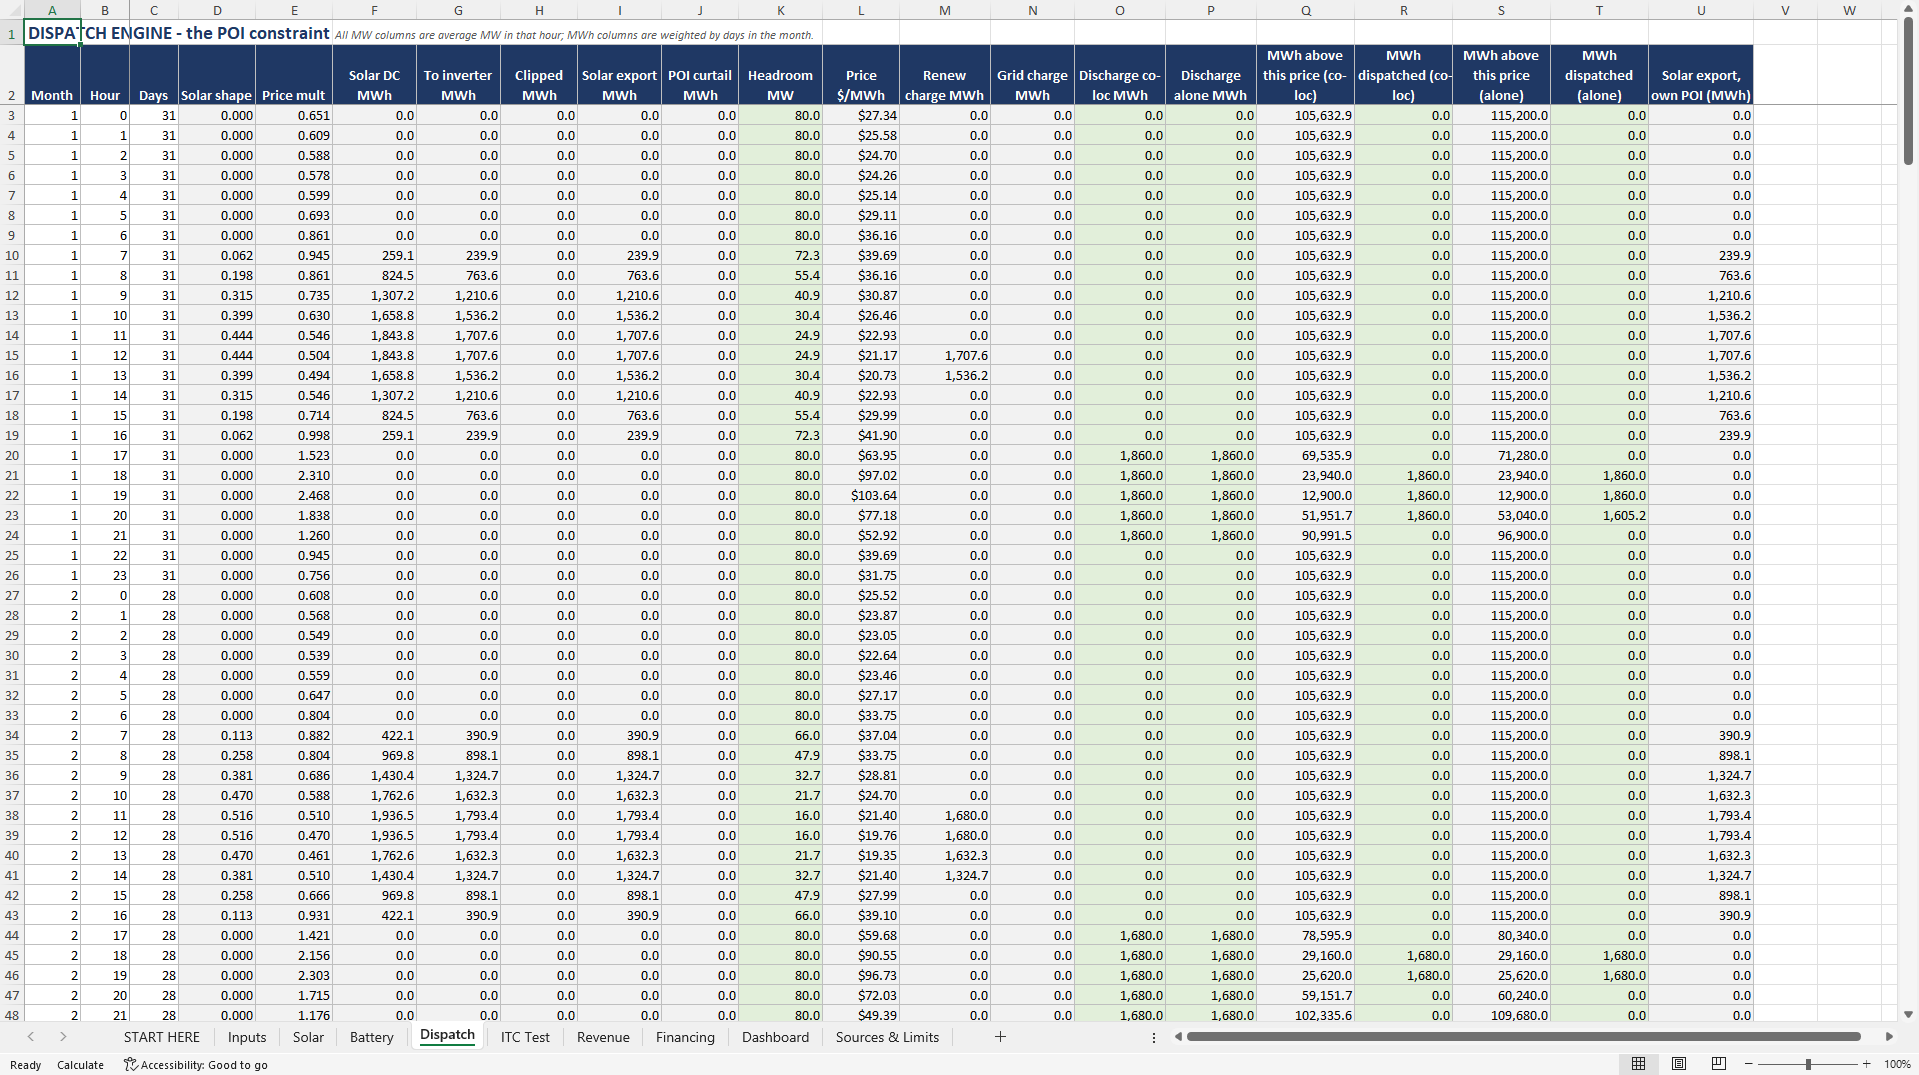
- Apply the interconnection limit hour by hour instead of a flat percentage haircut, and count the hours it actually costs you.
- Test the investment tax credit every year against a threshold you select, with a recapture ladder rather than a lump sum.
SOLAR ENERGY EXCEL DESCRIPTION
A hybrid solar-plus-storage project is not the solar project plus the battery project. Both assets sit behind one point of interconnection, so they compete for export capacity hour by hour. The battery's investment tax credit depends on where its charging energy comes from, and that is tested every year, not once at closing. A valuation built by adding two standalone forecasts together misses both constraints by construction.
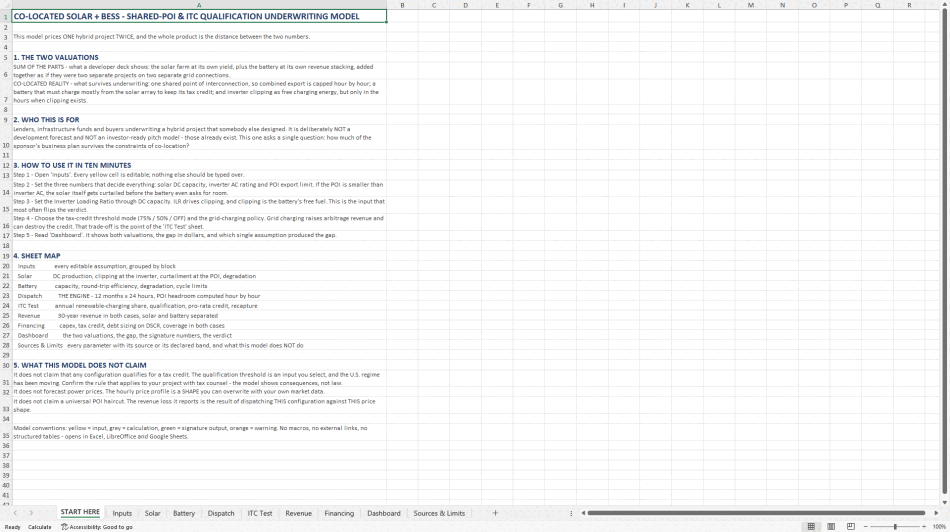
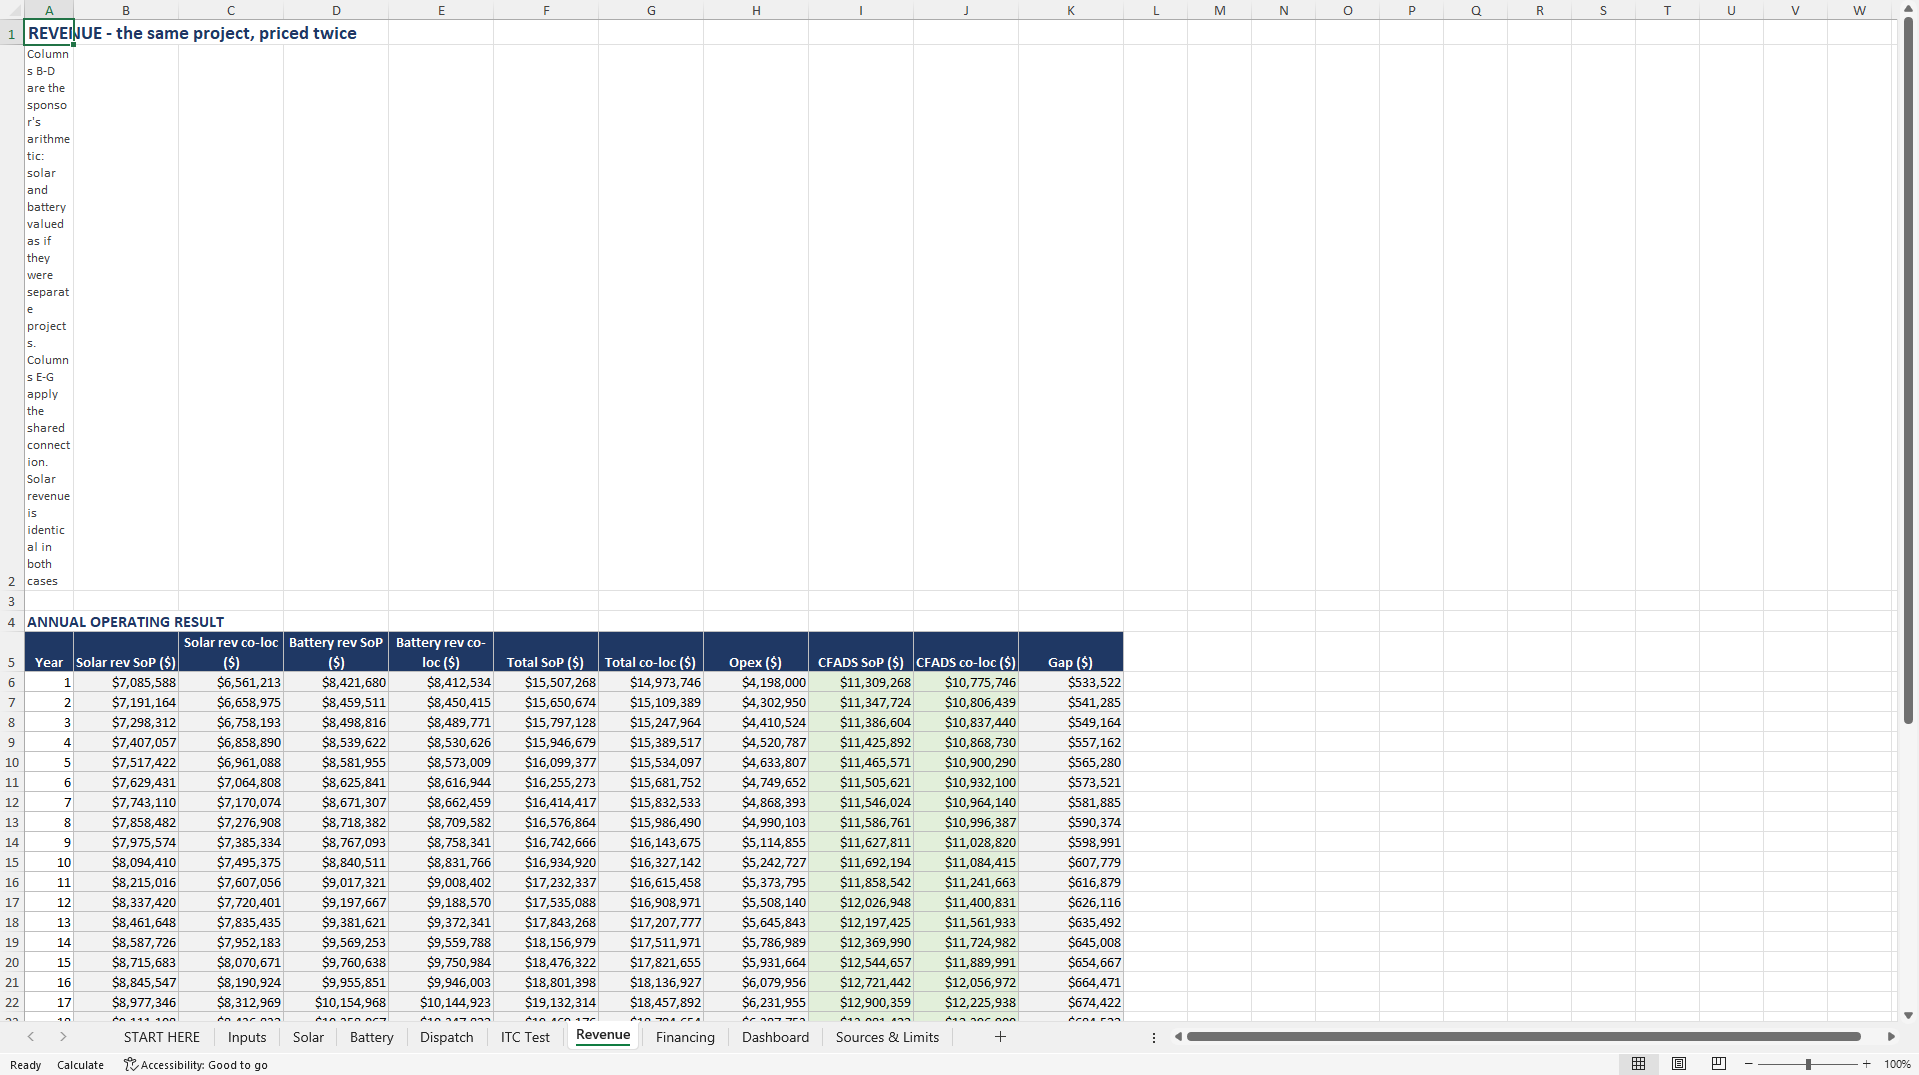
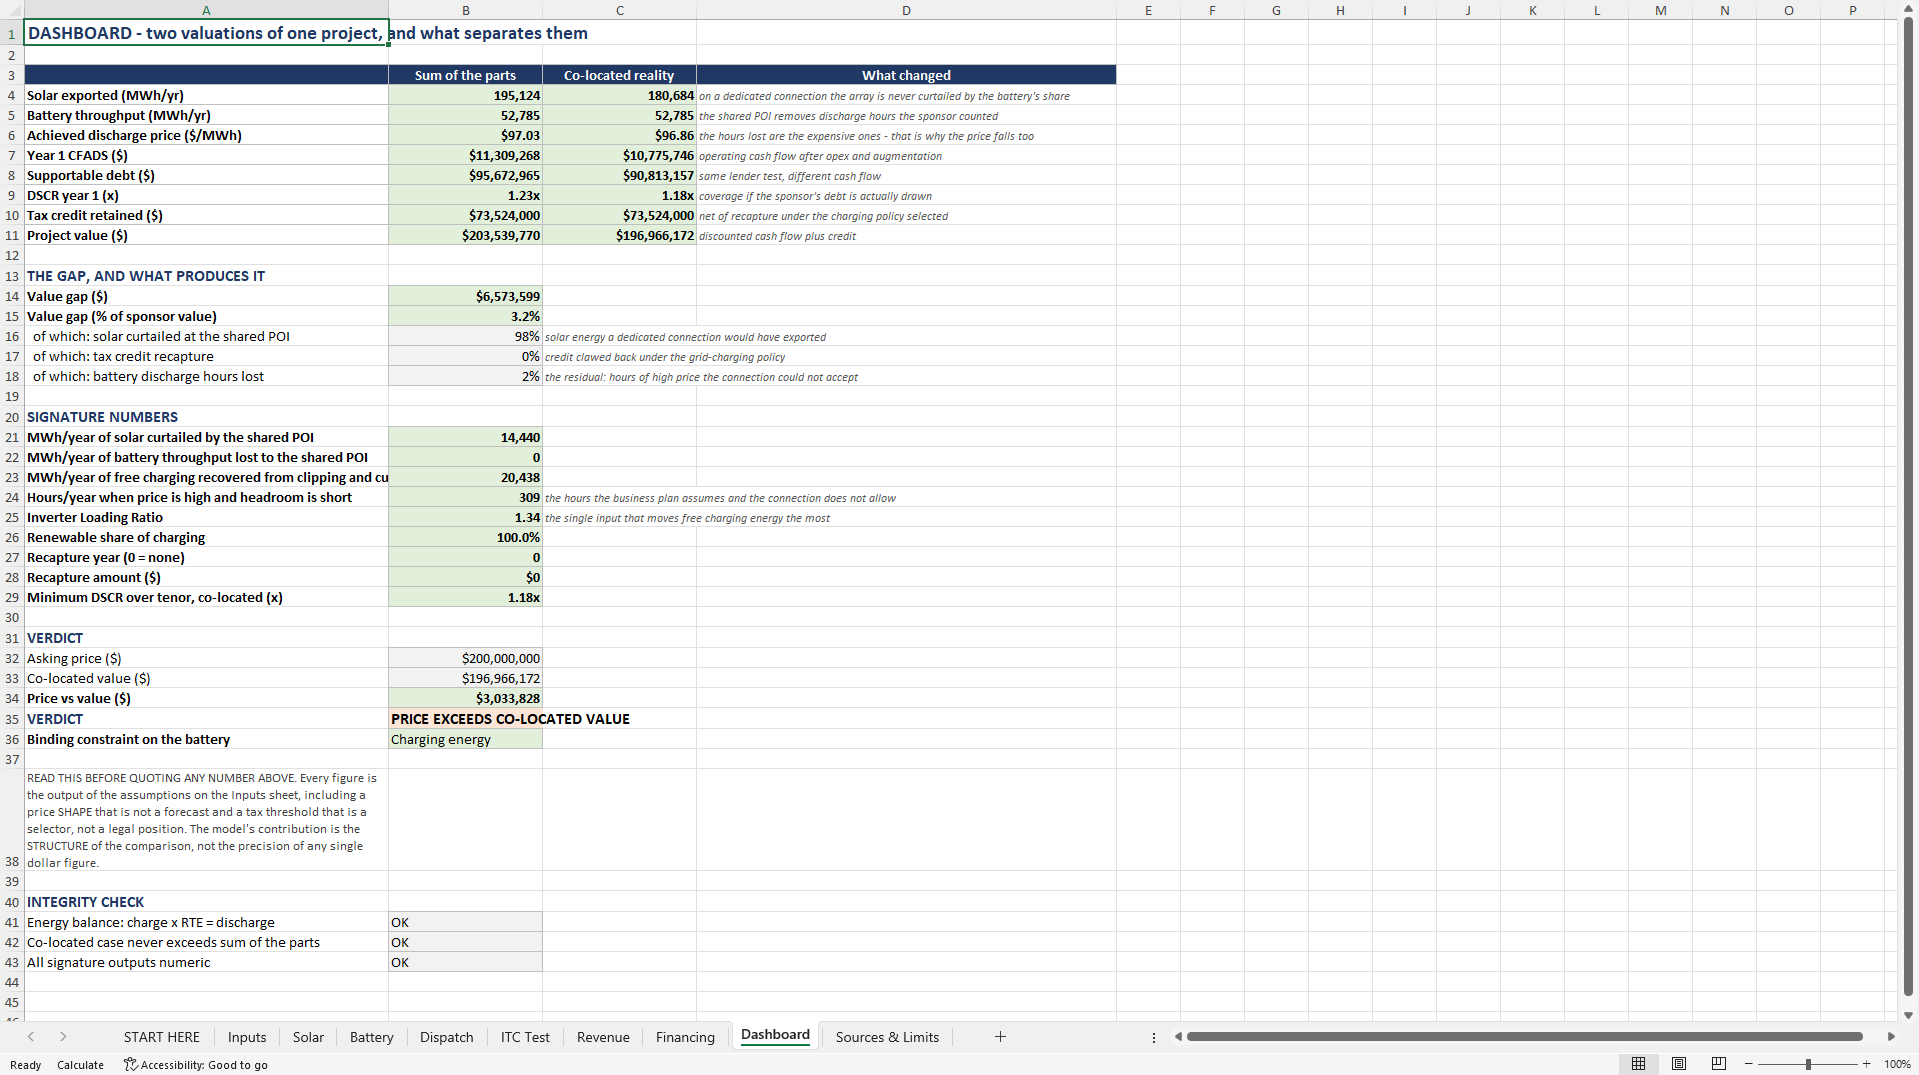
This model prices the same project twice and reports the distance between the two numbers.
The first valuation is the sum of the parts: the solar farm at its own yield plus the battery at its own revenue stacking, added together as if they were two projects on two separate grid connections. That is what a developer deck shows. The second is the co-located reality: a single export limit capping combined output hour by hour, a battery that must charge mostly from the array to keep its credit, and inverter clipping as free charging energy but only in the hours when clipping actually exists.
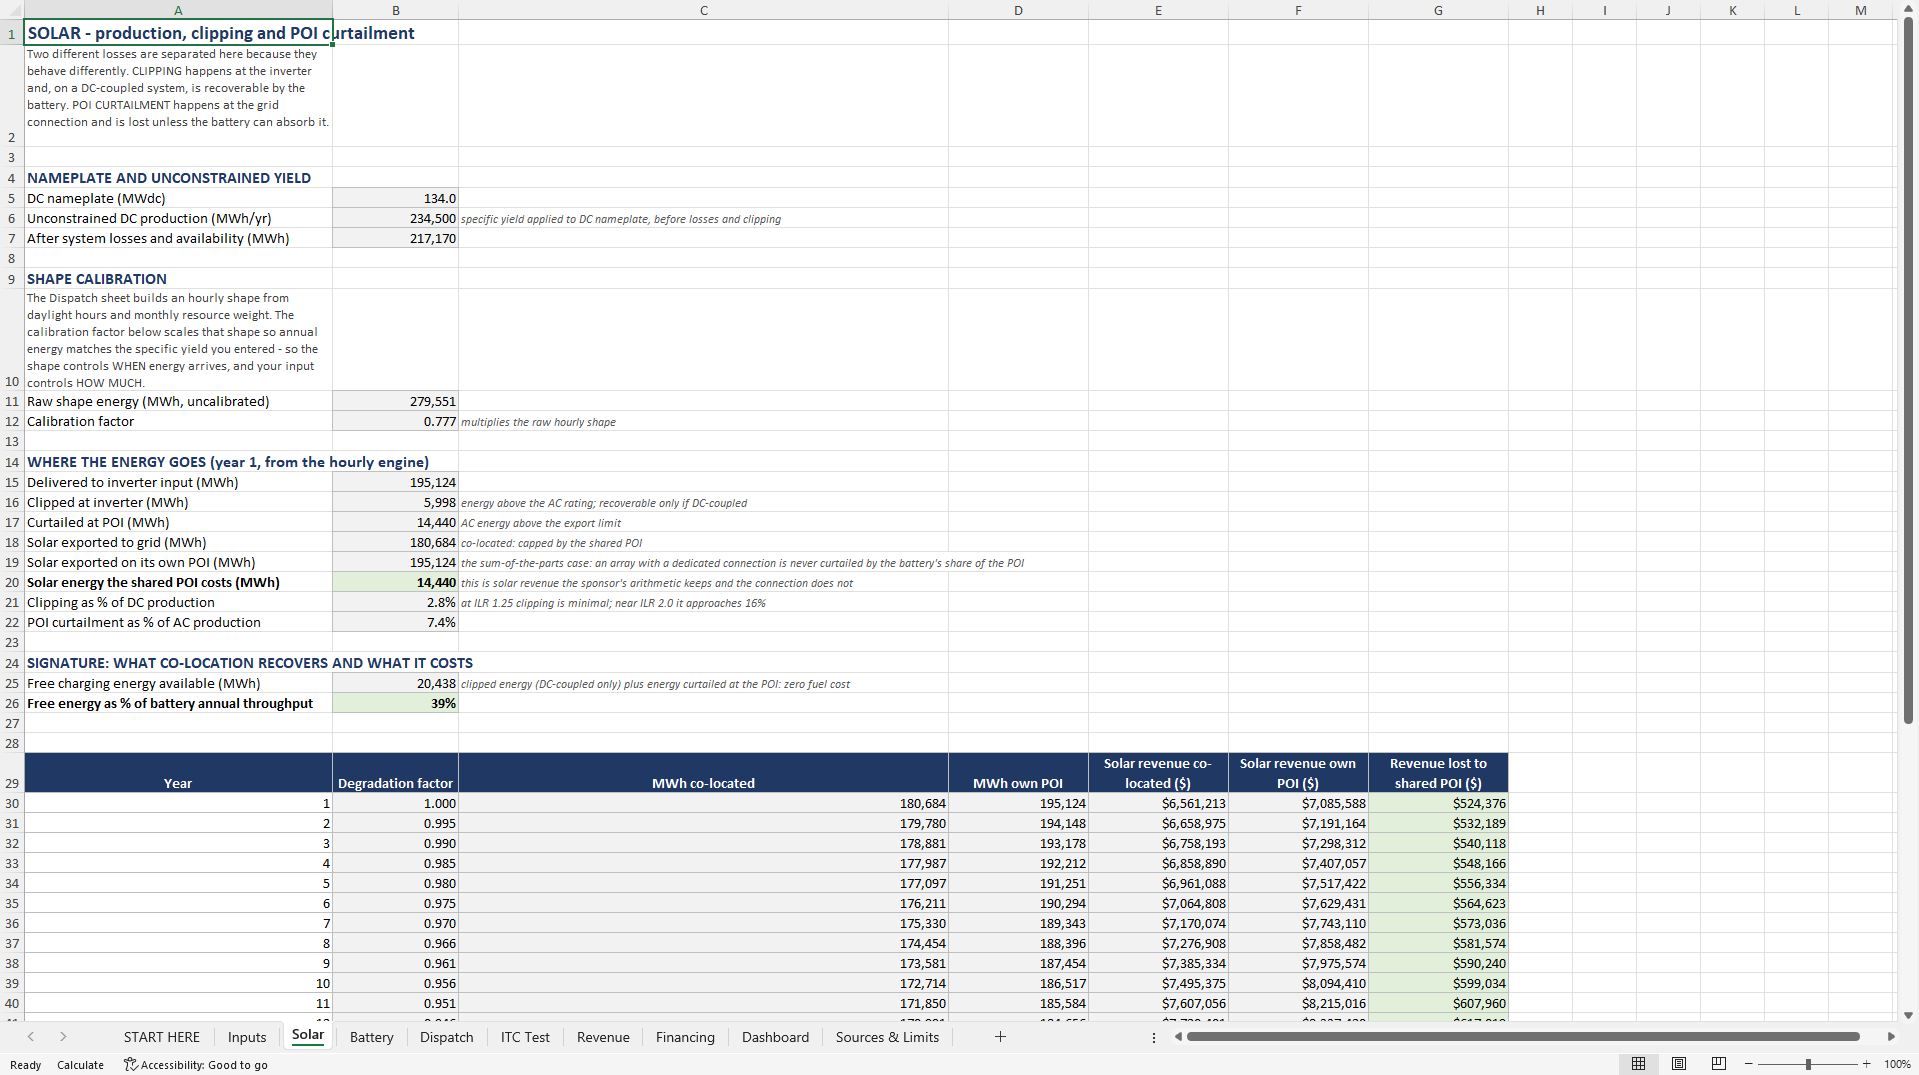
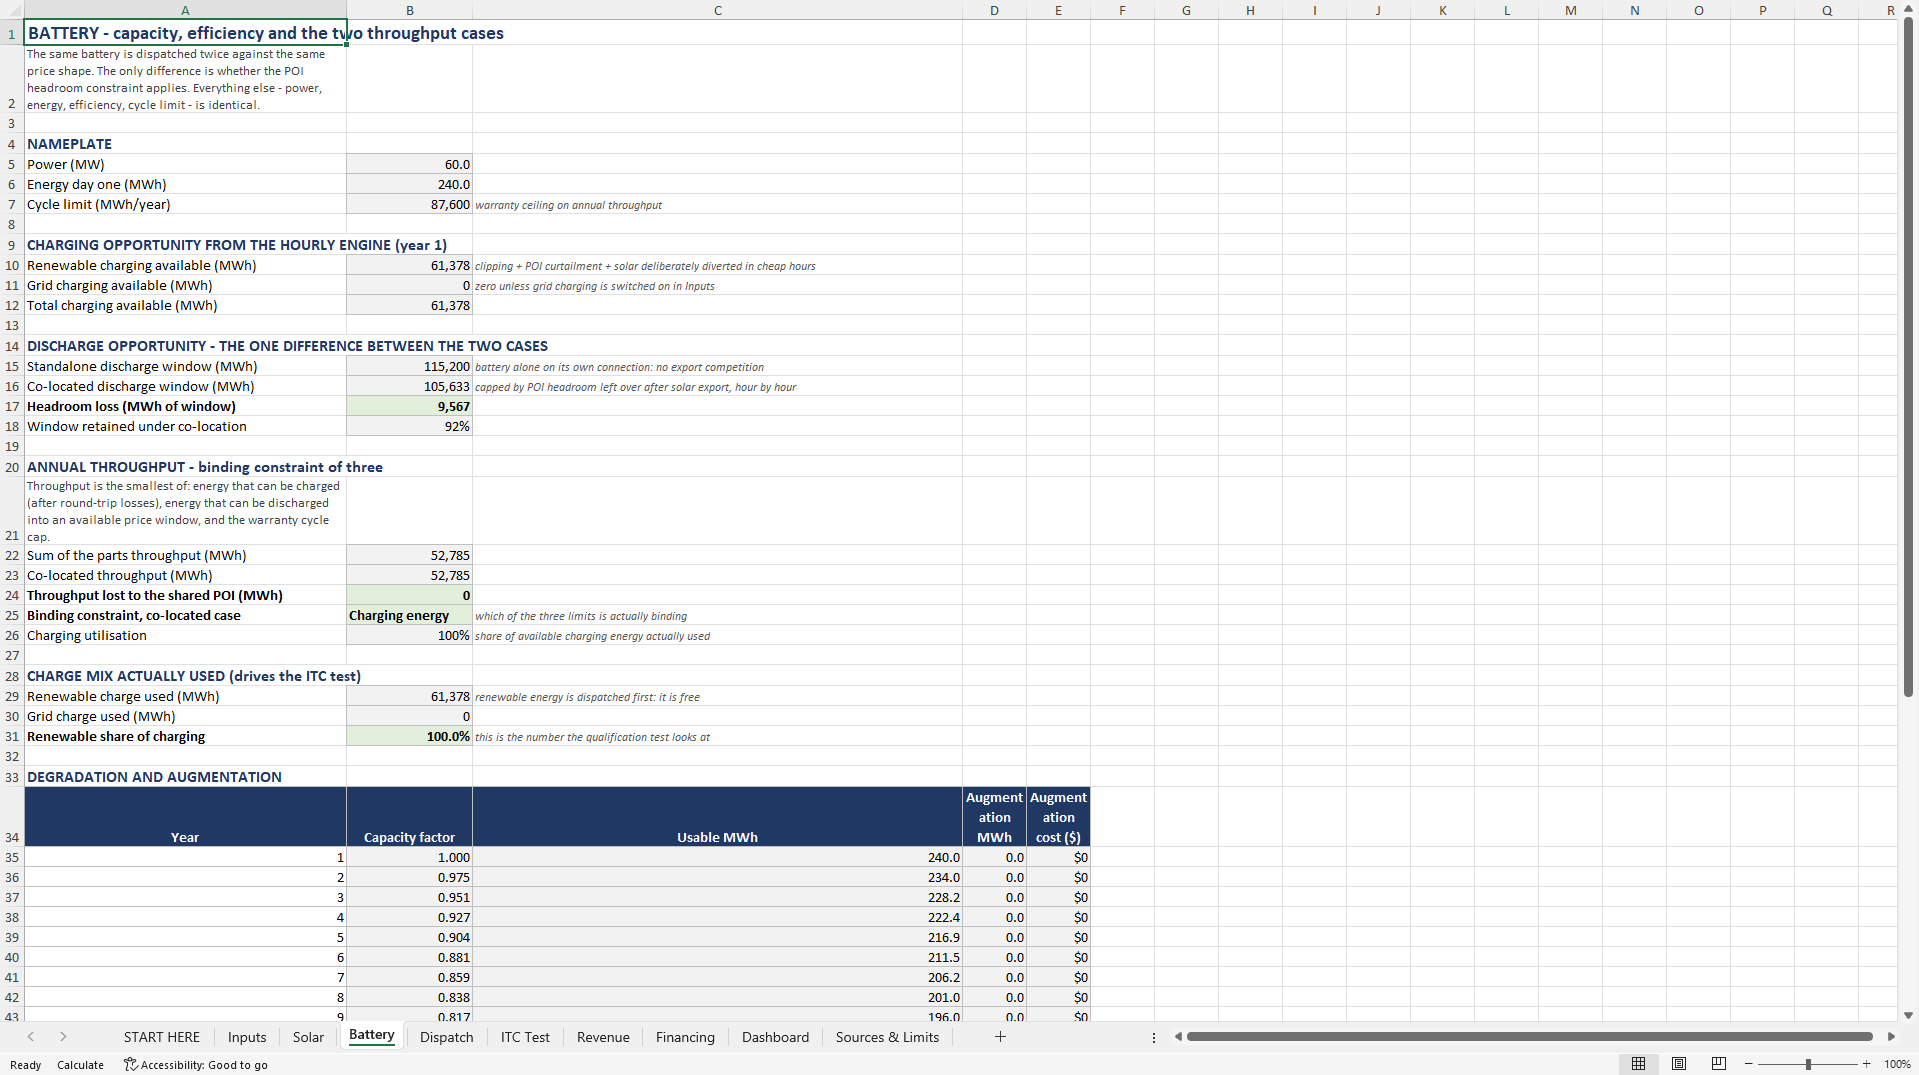
The engine is a 12-month by 24-hour dispatch grid. For every month-hour combination the model computes how much export capacity is left after the solar array has taken its share, and that residual headroom is what the battery has to work with. The constraint bites in two distinct ways. The array itself is curtailed whenever its AC output exceeds the export limit. And the battery loses discharge hours precisely when it wants them most, because on a summer-peaking price curve some of the expensive hours arrive while the sun is still up. The model counts those hours explicitly, and reports how many of them there are in a year.
The tax credit is treated as an annual test with a recapture ladder rather than a lump sum at closing. Storage co-located with a renewable generator has historically qualified only when a minimum share of charging energy came from the generator rather than the grid, pro-rata above the threshold and zero below it, with credit already claimed clawed back if a disqualifying change happens during the vesting period. Switch grid charging on and the model shows the arbitrage gained, the credit put at risk, the year the recapture lands, and how many years of extra arbitrage would be needed to repay it. That trade-off is what turns charging policy into a financeable variable instead of a footnote.
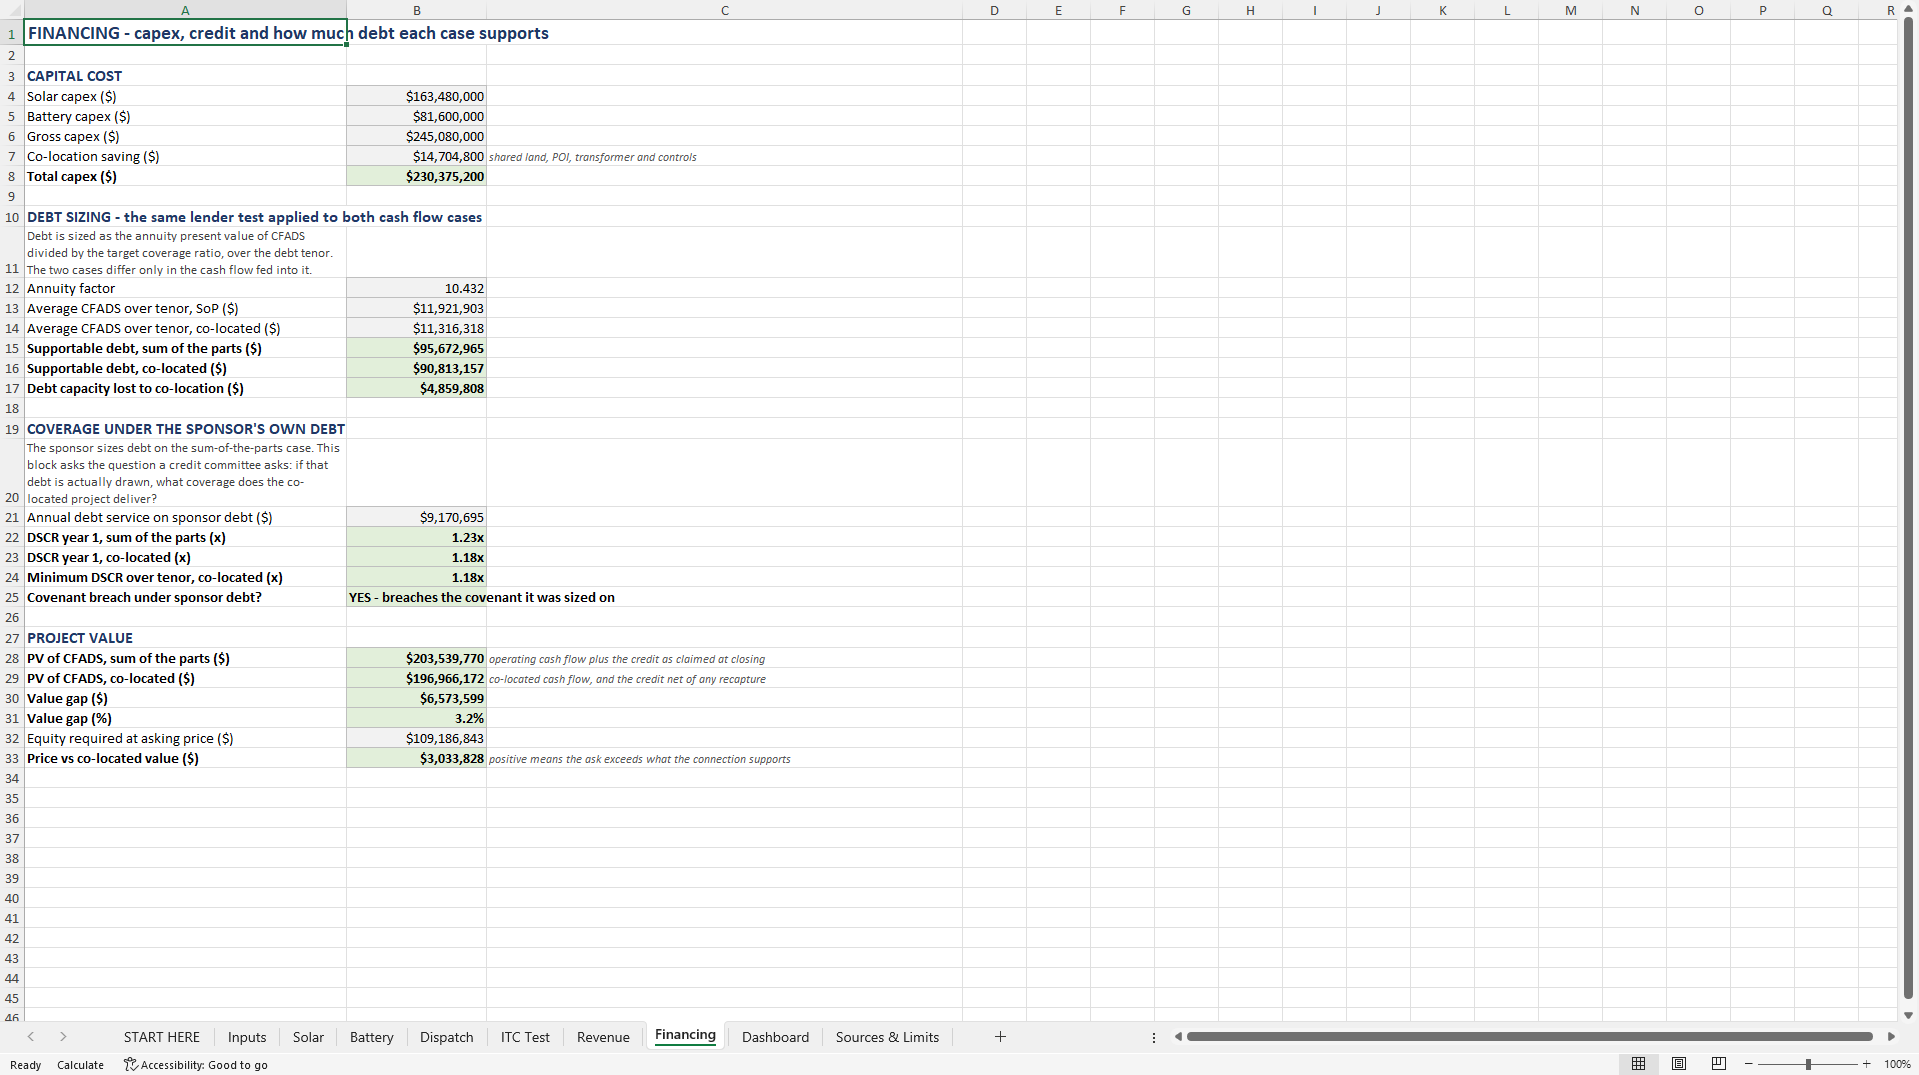
Debt is then sized on each cash flow case using the same lender test, and the model answers the question a credit committee actually asks: if the sponsor's debt is drawn, what coverage does the real project deliver?
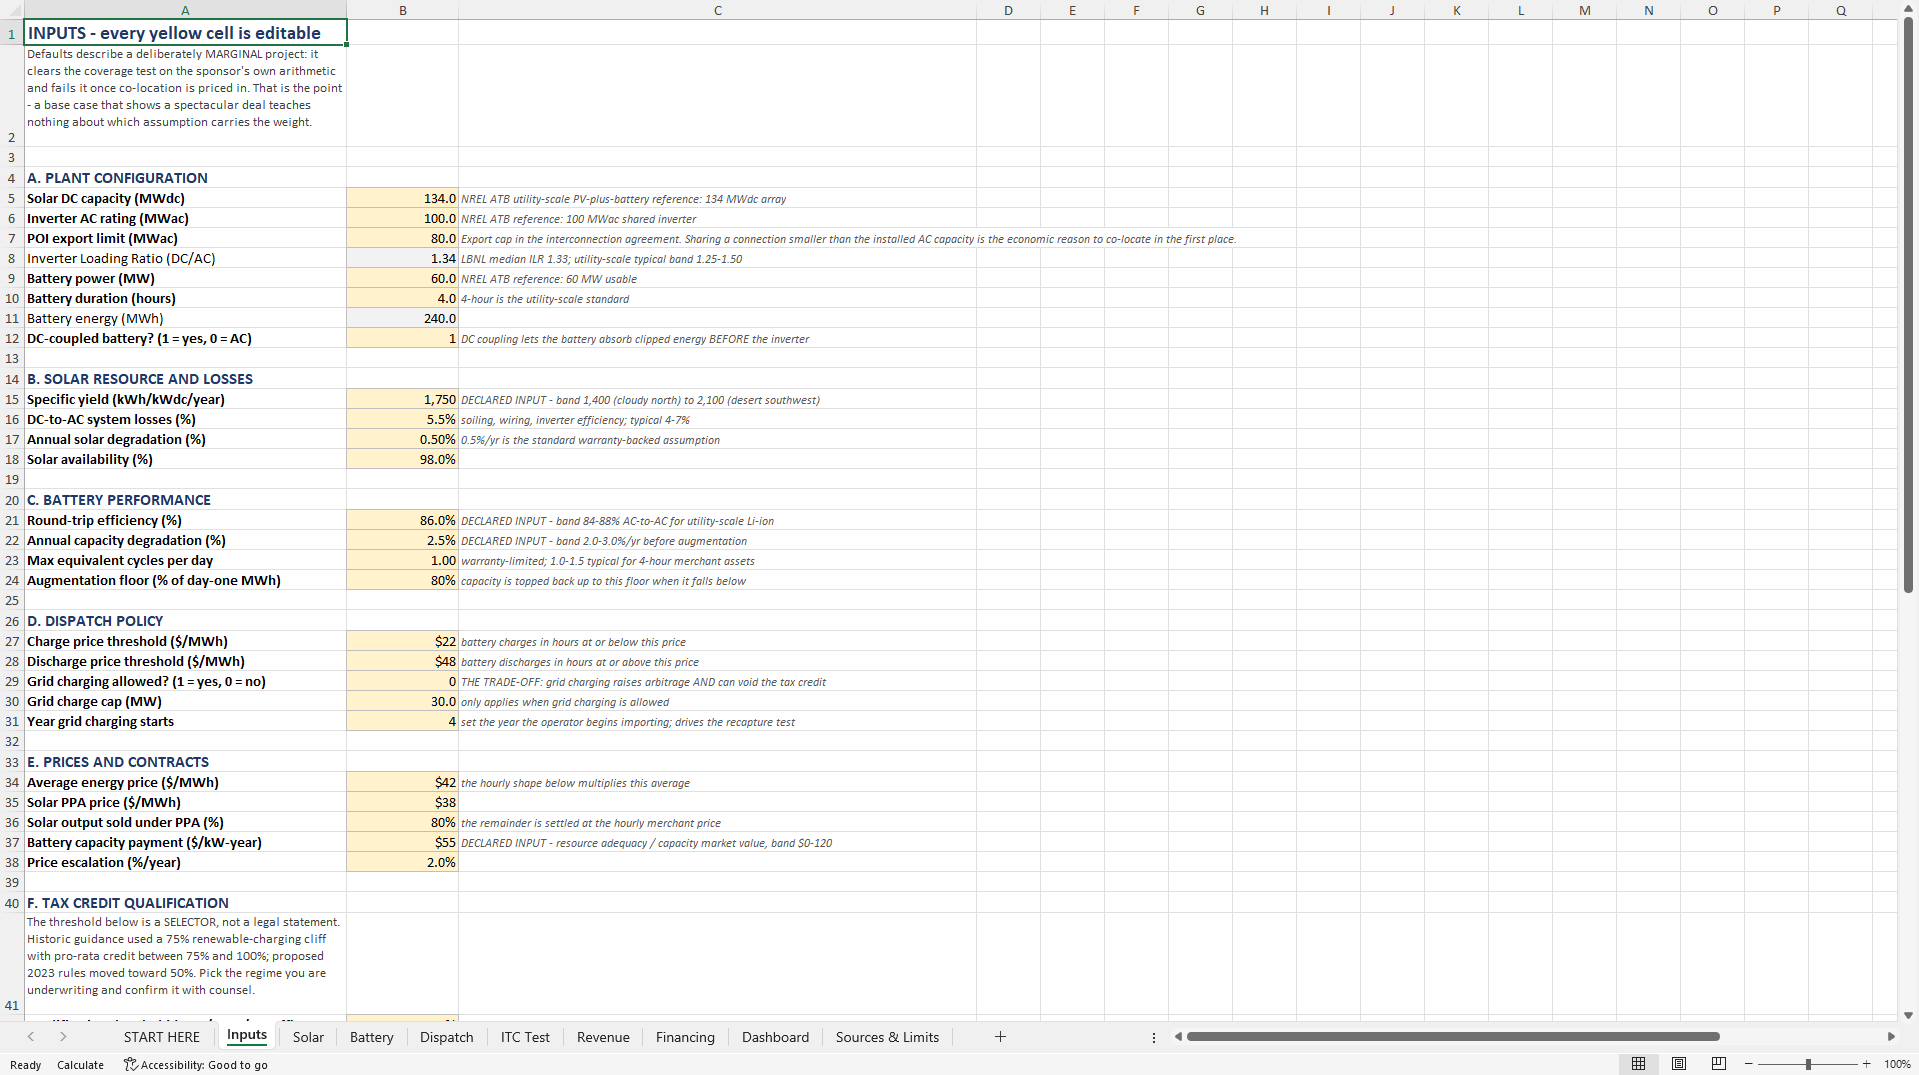
The workbook has ten sheets. Every input is editable and highlighted. Every parameter is either traced to a public source or flagged as a declared input with the band it should sit in, on a dedicated Sources and Limits sheet that also lists explicitly what the model does not do. There are no macros, no external links and no structured tables, so it opens in Excel, LibreOffice and Google Sheets alike. A five-page guide walks a real deal through the model in order, with worked scenarios for a generous interconnection limit, a tight one, a high inverter loading ratio, and a grid-charging policy that triggers recapture.
The threshold selector is not a legal statement and the hourly price profile is not a forecast. The model tells you the consequence of a rule and a market that you specify. What it contributes is the structure of the comparison.
Got a question about the product? Email us at support@flevy.com or ask the author directly by using the "Ask the Author a Question" form. If you cannot view the preview above this document description, go here to view the large preview instead.
Source: Best Practices in Solar Energy, Integrated Financial Model Excel: Co-Located Solar + BESS: Shared-POI Underwriting Excel (XLSX) Spreadsheet, ProformaWorks
ABOUT THE AUTHOR

ProformaWorks builds acquisition-grade financial models for Main Street and lower-middle-market businesses - the kind of deal financed with an SBA 7(a) loan or a small commercial facility.
Every model answers one question: does this deal pencil at the bank? That means SDE or NOI rebuilt from the seller's own numbers, the add-backs a lender will and will not accept, a debt-service
... [read more]
Ask the Author a Question
You must be logged in to contact the author.




























