
Casino Hotel 10-Year Financial Model – Excel XLSX
Excel (XLSX)
BENEFITS OF THIS DOWNLOADABLE EXCEL DOCUMENT
- Fully integrated 3-statement Casino Hotel financial model with 10-year forecast.
- Models hotel occupancy, gaming revenue, F&B, and resort fees from a single Assumptions tab across 15 linked sheets.
- Built for casino developers, hospitality investors, and gaming operators who need bankable numbers fast.
HOTEL INDUSTRY EXCEL DESCRIPTION
Curated by McKinsey-trained Executives
🎰 Casino Hotel Financial Model | 3-Statement 10-Year Forecast
Turn your Casino Hotel into a fundable, bankable, investor-ready operation – modeled with institutional-grade precision.
Whether you're a developer pitching a gaming resort to institutional lenders, a hospitality operator crossing $10M in annual gaming revenue, a private equity firm evaluating a casino acquisition, or a CFO preparing for a debt refinancing – this fully integrated 3-Statement Financial Model gives you the exact financial infrastructure to plan, pitch, fund, and exit with complete confidence.
💡 What's Inside
This model covers every financial dimension of building and scaling a Casino Hotel – from your opening ramp through a 10-year path to stabilized operations, refinancing, or full exit. Built on Financial Modeling World Cup best practices, it's fully dynamic, cross-linked across 15 tabs, and ready to customize for your specific room count, gaming floor configuration, and market positioning.
📥 Inputs
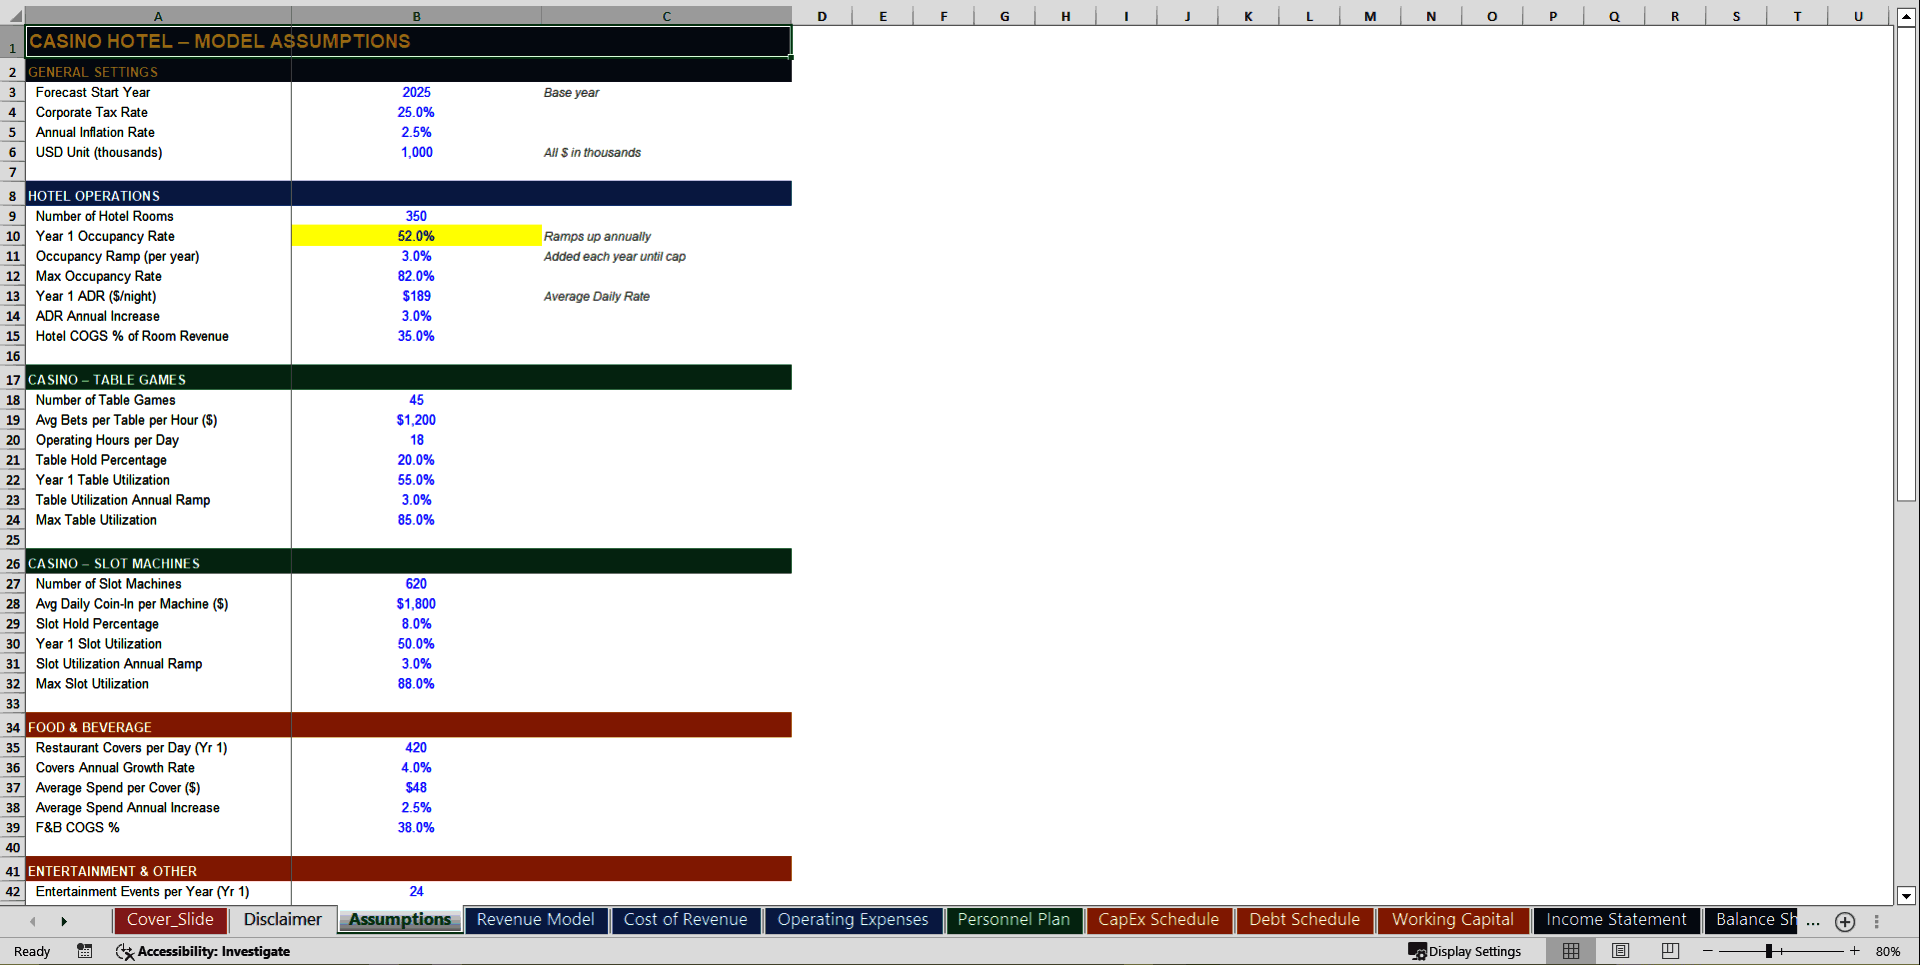
• 🎯 Hotel Occupancy & ADR Drivers – Starting occupancy rate, annual ramp-up percentage, maximum stabilized occupancy cap, Year 1 Average Daily Rate, and ADR annual growth rate – every lever that drives your room revenue waterfall, fully adjustable from a single Assumptions tab
• 🎲 Dual-Stream Casino Revenue Engine – Separate modeling for Table Games (number of tables, average bets per hour, operating hours, hold percentage, utilization ramp) and Slot Machines (machine count, daily coin-in per machine, hold percentage, utilization ramp) – blended gaming revenue auto-calculated with realistic ramp curves built in
• 🍽️ 4-Segment Ancillary Revenue Stack – Food & Beverage driven by daily covers and spend per guest, Entertainment & Events driven by event count and ticket prices, Resort Fees driven by occupied rooms, and Spa/Retail/Parking driven by guest penetration – every non-gaming dollar modeled to its operational root cause
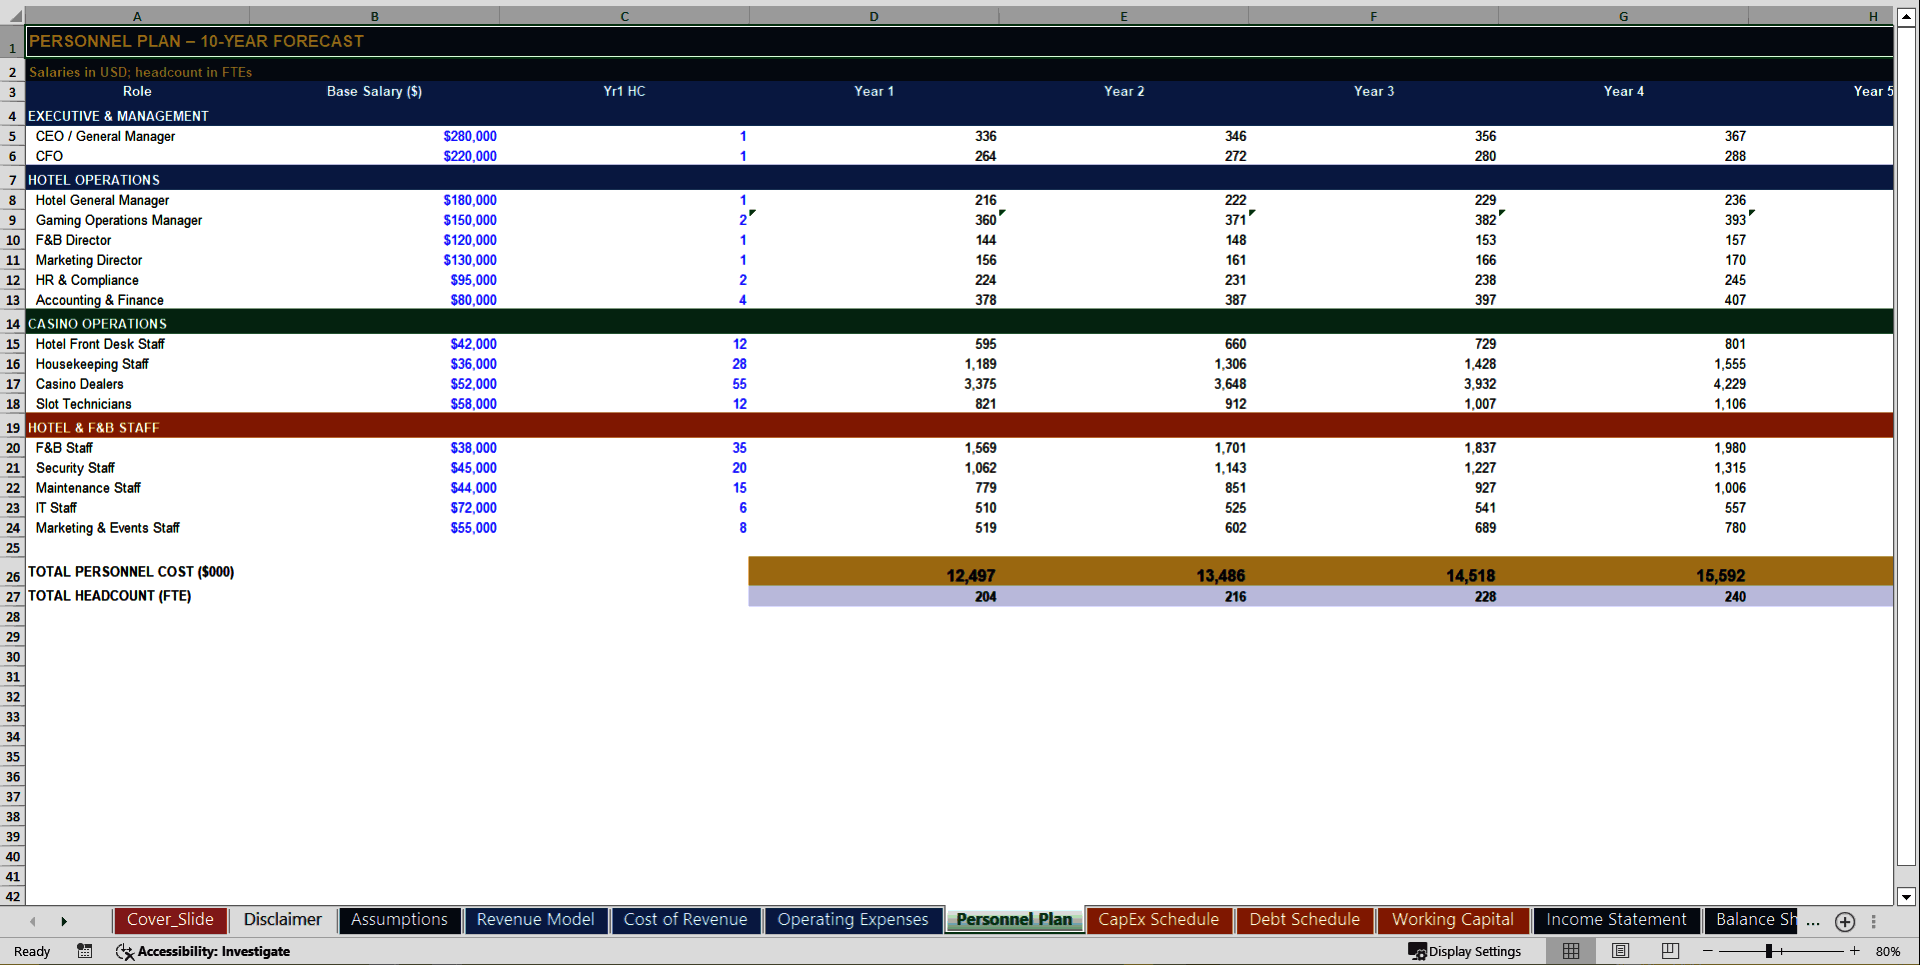
• 👥 17-Role Personnel Plan – CEO, CFO, Hotel GM, Gaming Operations Manager, F&B Director, Marketing Director, HR, Accounting, Front Desk, Housekeeping, Casino Dealers, Slot Technicians, F&B Staff, Security, Maintenance, IT, and Marketing & Events – with Year 1 salaries, annual raises, benefits load, and a role-by-role headcount scaling plan across all 10 years
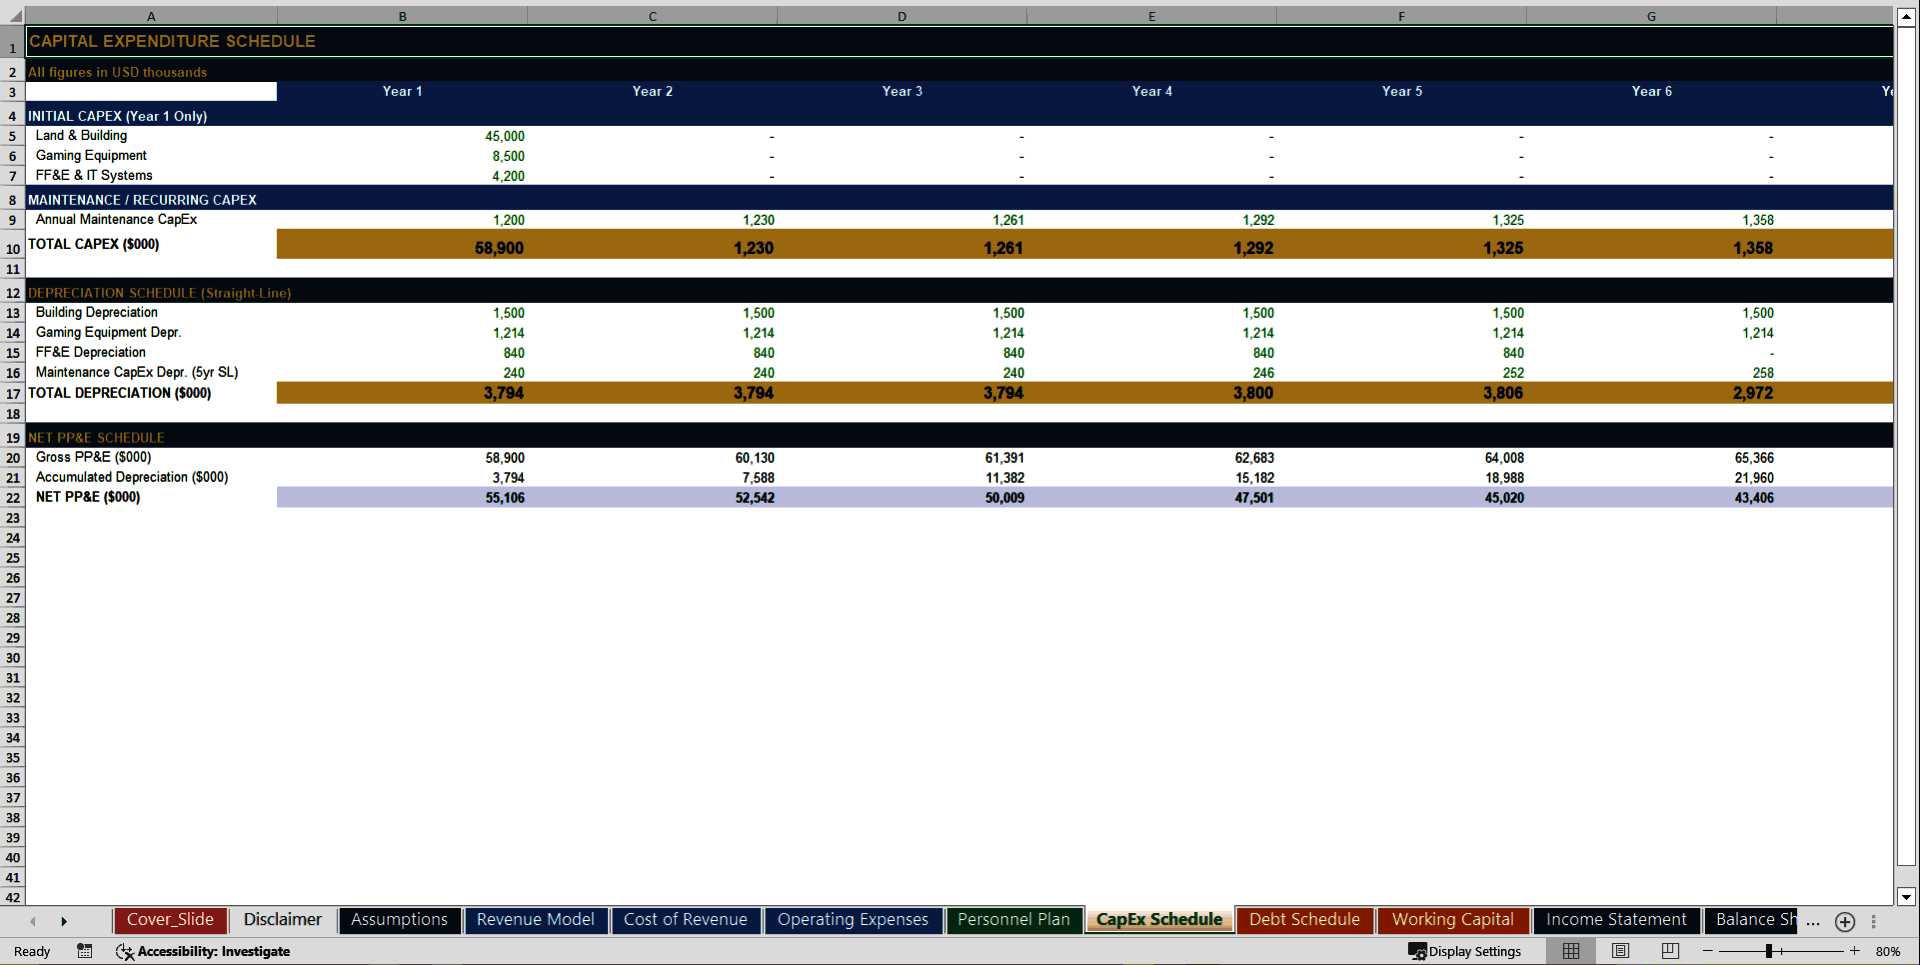
• 🏗️ 3-Asset-Class CapEx & Depreciation Schedule – Land & Building ($45M, 30-year straight-line), Gaming Equipment ($8.5M, 7-year), and FF&E & IT ($4.2M, 5-year) – plus annual maintenance CapEx inflating with CPI, accumulated depreciation tracking, and Net PP&E for every year
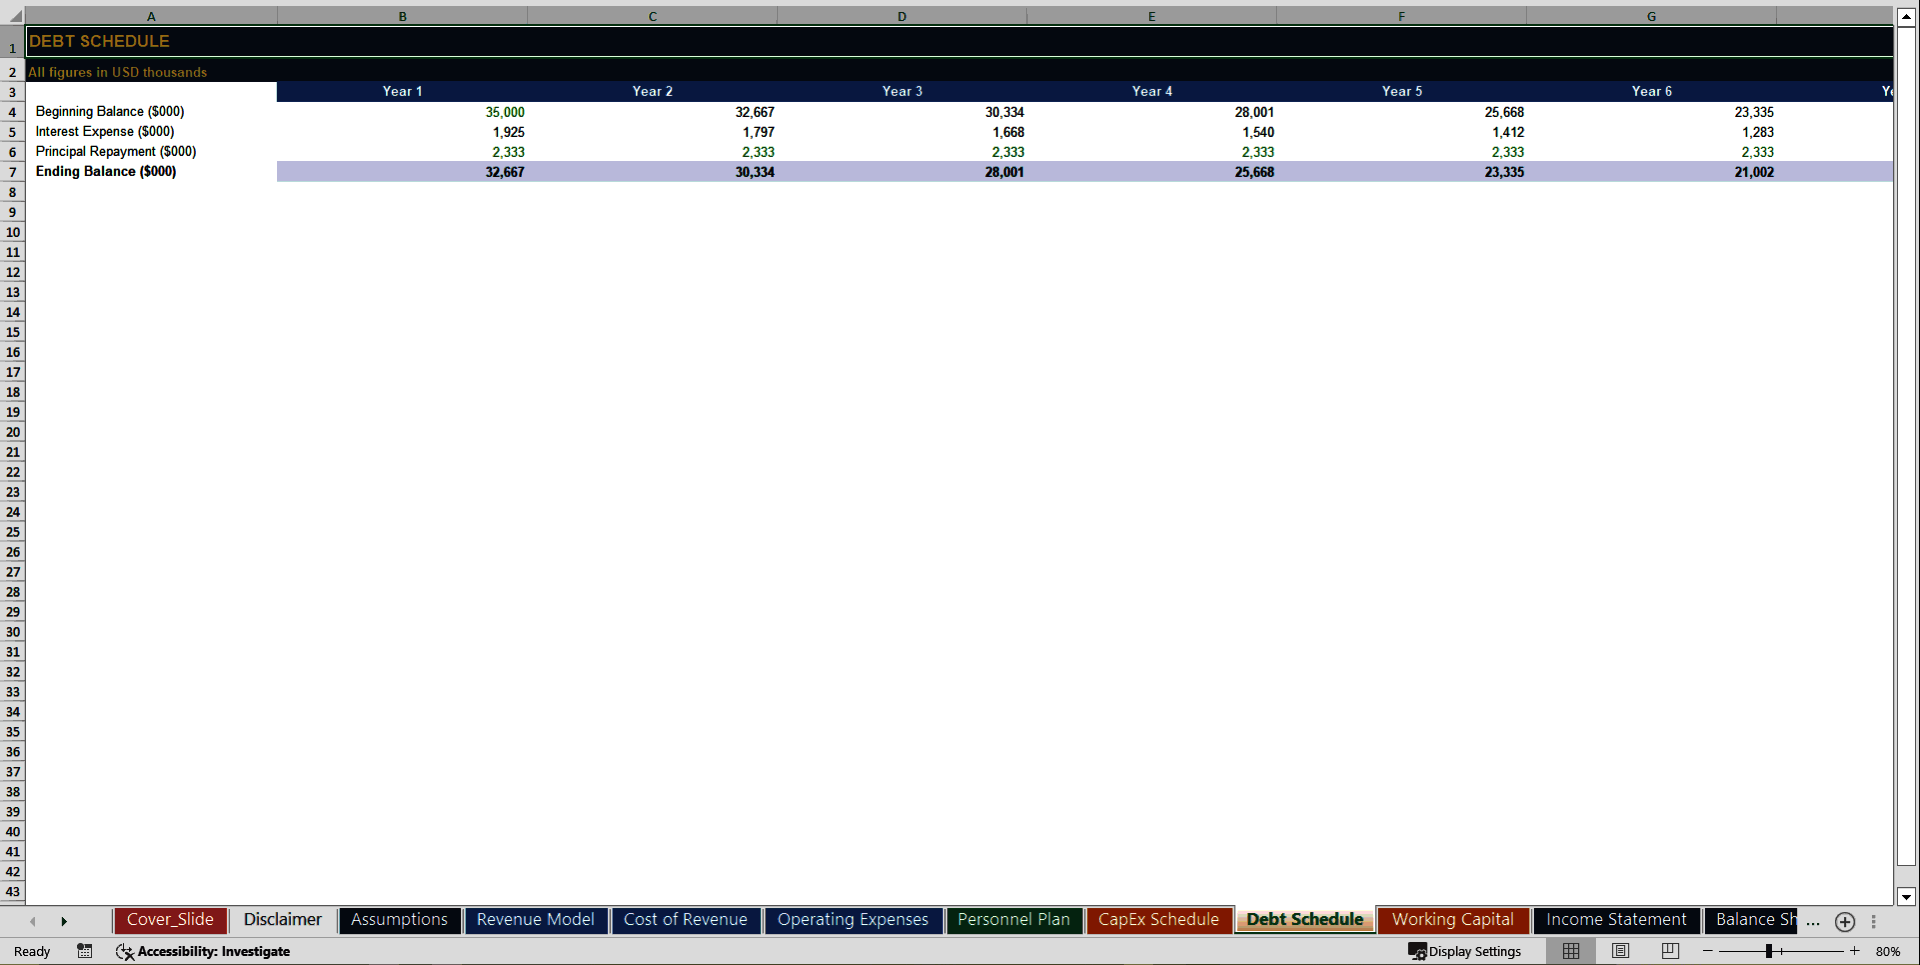
• 🏦 Full Debt & Equity Capital Structure – $35M senior debt at 5.5% with a 15-year amortization schedule, $25M equity investment, beginning/ending debt balance by year, interest expense, and principal repayment – all flowing directly into the Cash Flow Statement and Balance Sheet
• 📊 Sensitivity & Scenario Analysis – Stress-test your model instantly: a 5×5 Occupancy Rate vs. ADR matrix showing Year 5 EBITDA across 25 combinations, plus a Gaming Volume vs. Hold Percentage casino revenue table – so you always know your downside floor and your upside ceiling
📤 Outputs
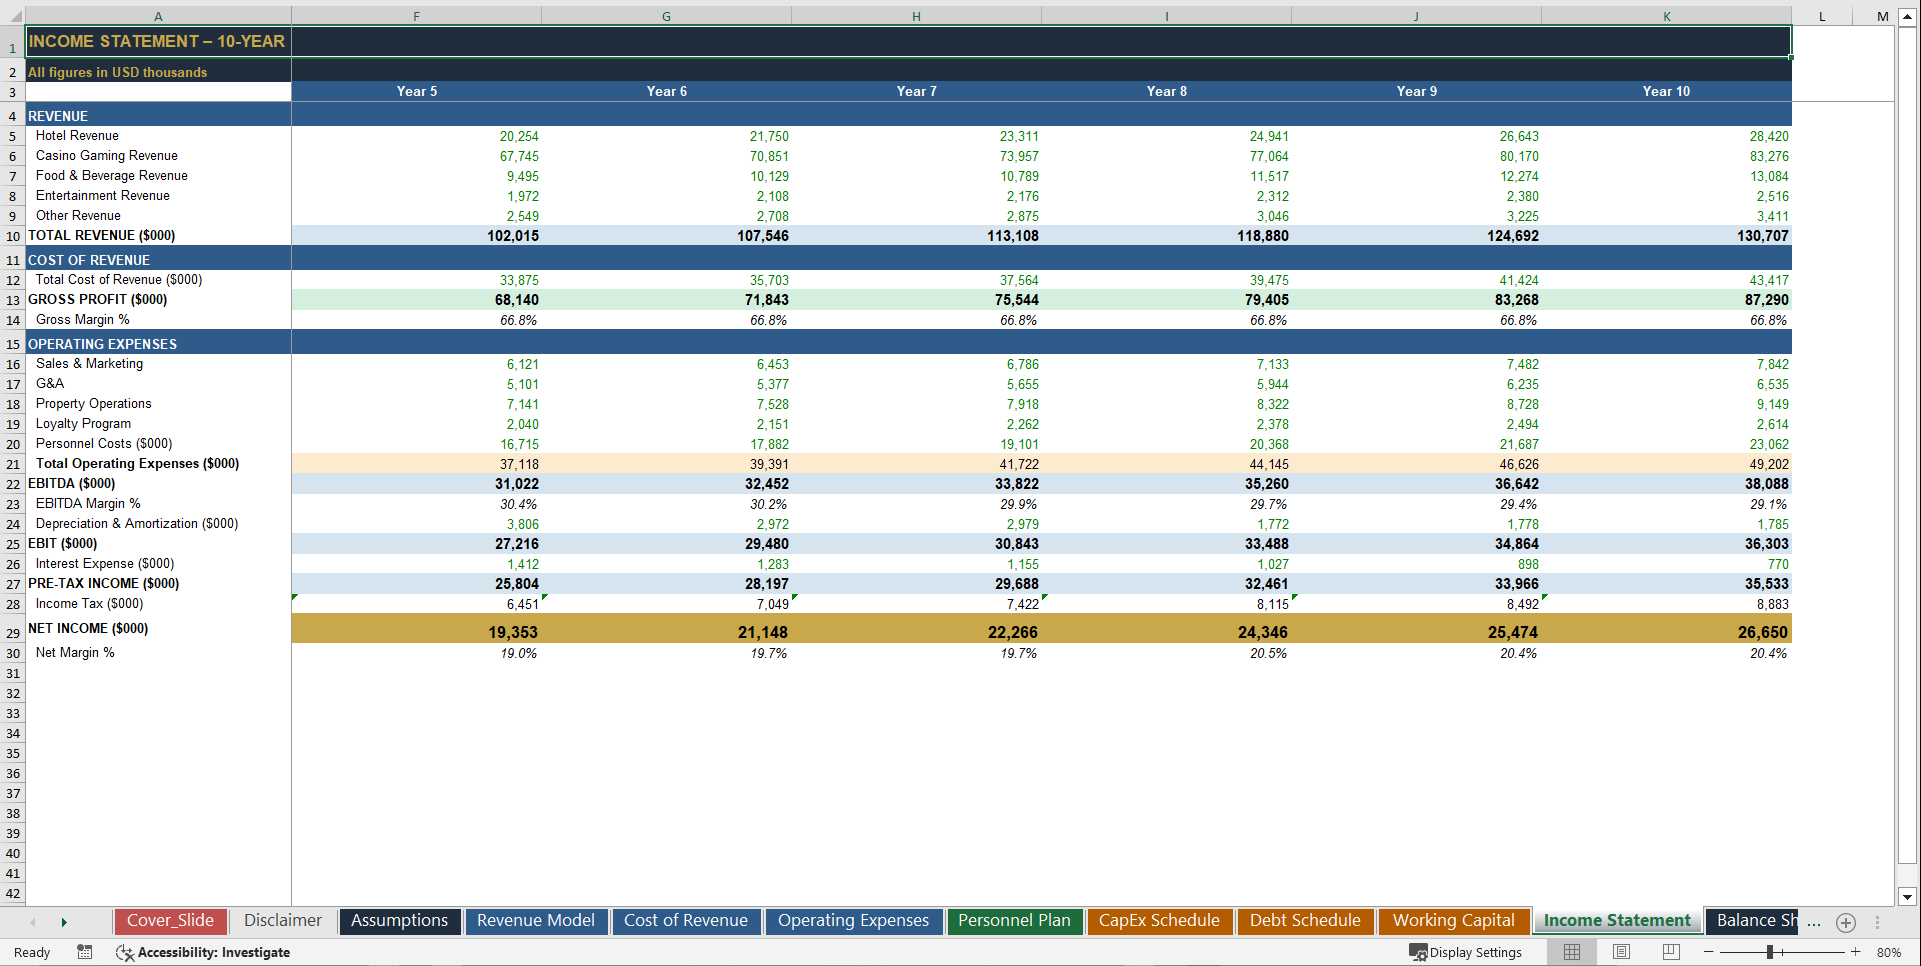
• 📈 10-Year 3-Statement Financial Model – Fully integrated Income Statement, Balance Sheet, and Cash Flow Statement, cross-linked and auto-balancing across all 10 years
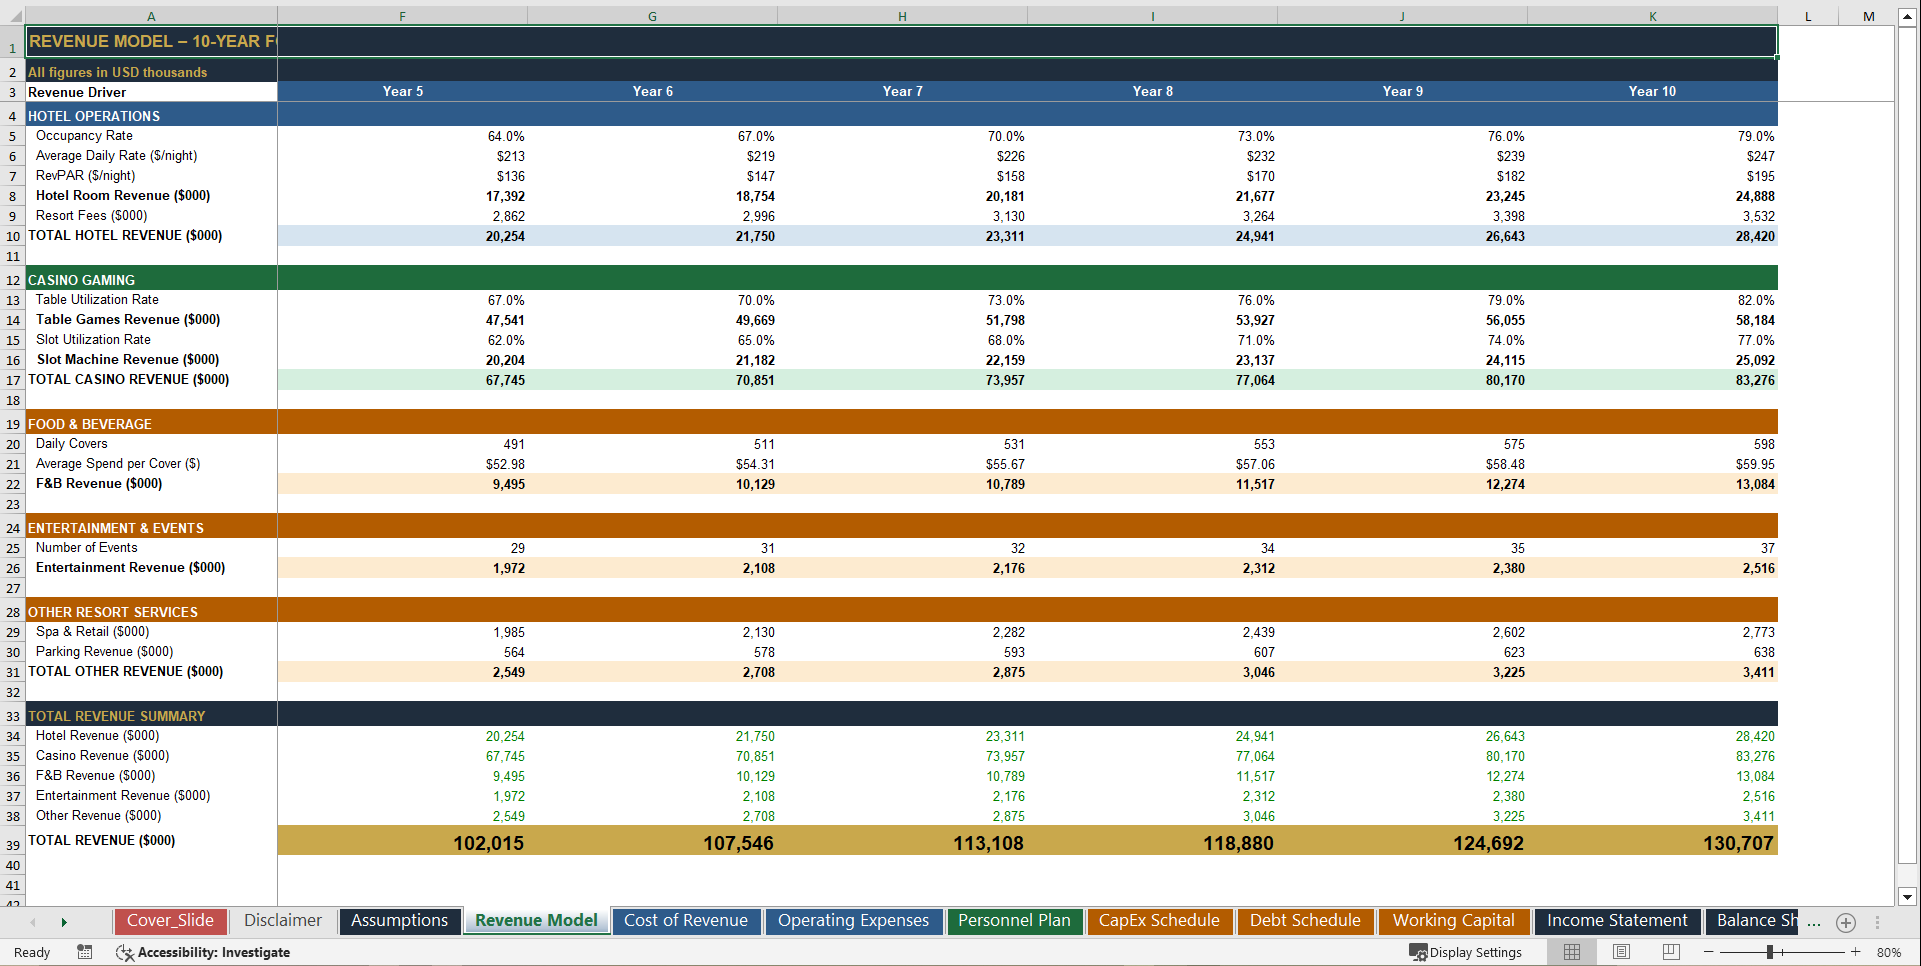
• 🎰 5-Segment Revenue Breakdown – Annual projections for Hotel Rooms, Casino Gaming (Tables + Slots), Food & Beverage, Entertainment, and Other Resort Services – with year-over-year growth, operational driver transparency, and full revenue mix visibility
• 🛎️ Hotel Operations Dashboard – Occupancy Rate, Average Daily Rate, and RevPAR tracked annually across all 10 years – the exact metrics every hotel lender and hospitality investor interrogates on page one of their due diligence checklist
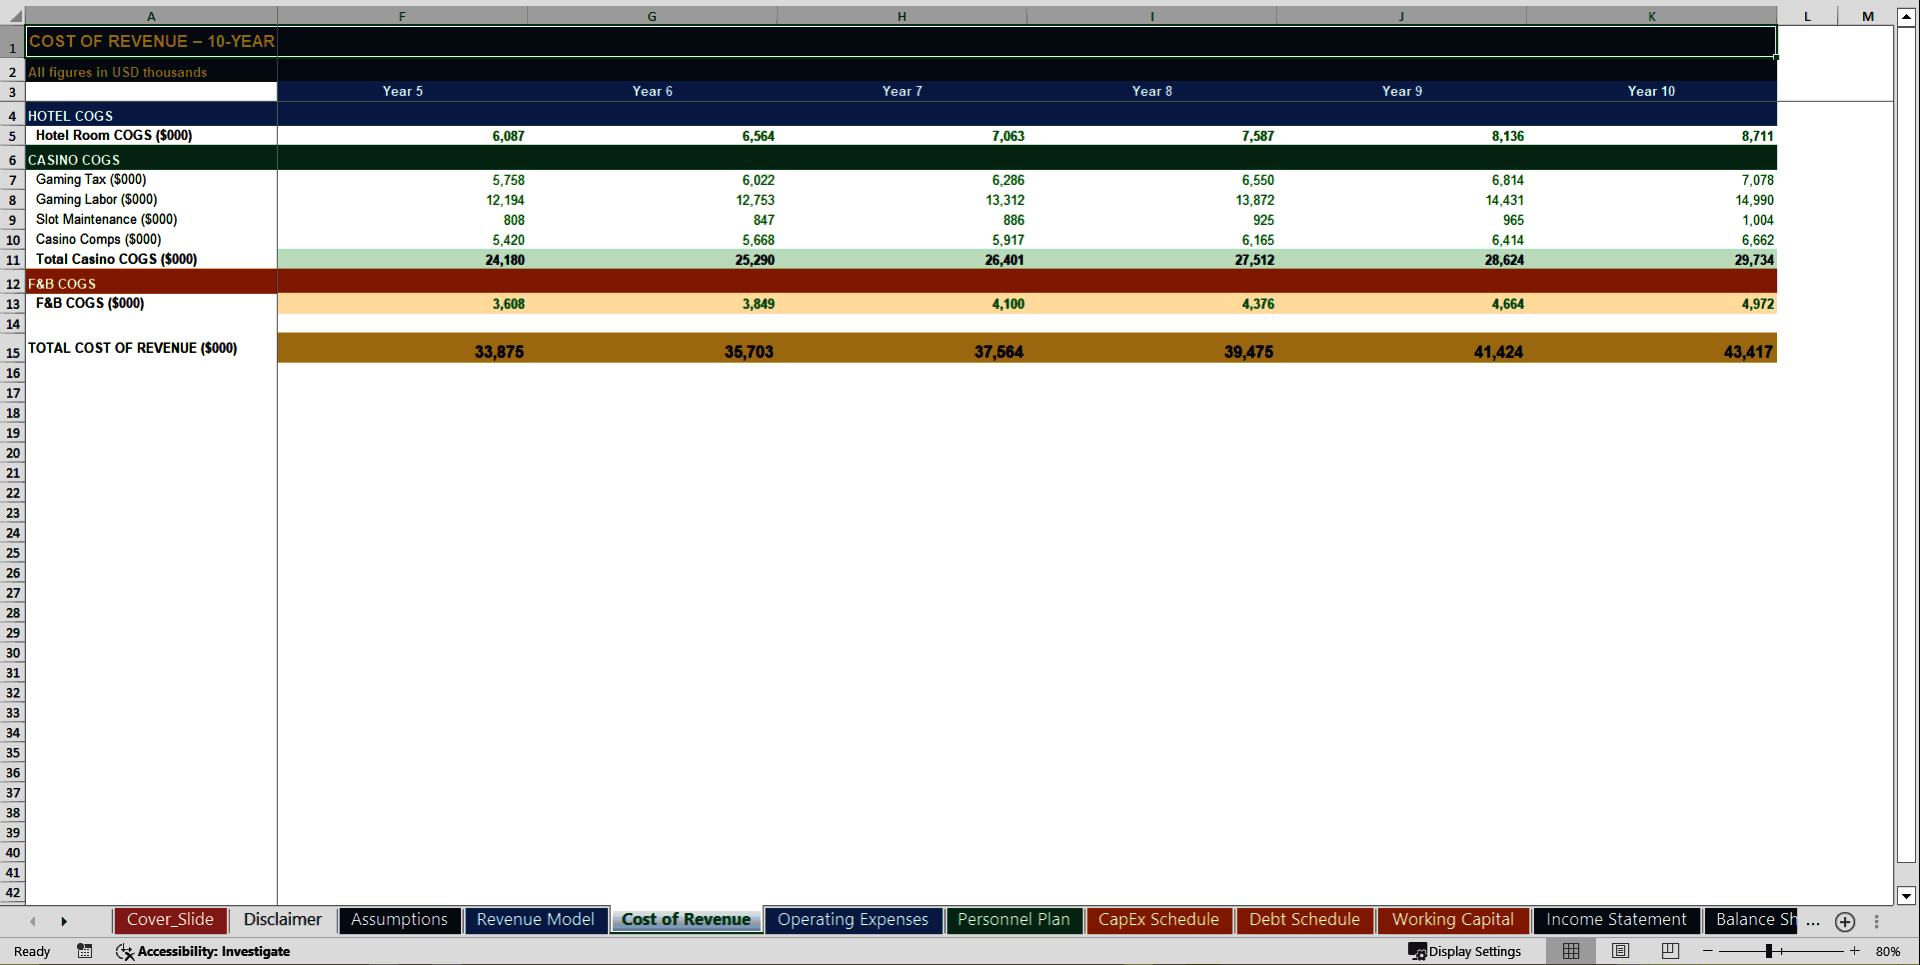
• 🃏 Casino Gaming Revenue Waterfall – Table utilization and slot utilization ramp curves fully modeled, with separate Table Games and Slot Machine revenue lines, gaming tax expense, gaming labor, comps, and slot maintenance all driver-calculated from your gaming floor configuration
• 💼 Personnel Cost Schedule – Role-by-role headcount scaling with salary × benefits × annual raise compounding, total FTE count by year, and total personnel cost fully flowing into the Income Statement as a discrete operating expense line
• 🏛️ CapEx & Depreciation Schedule – Total CapEx per year with asset-class breakdown, Year 1 initial investment surge, ongoing maintenance CapEx, total annual depreciation by asset class, accumulated depreciation, gross PP&E, and Net PP&E end-of-period for all 10 years
• 🔄 Working Capital Schedule – Accounts Receivable (30-day revenue), F&B Inventory (14-day COGS), Prepaid Expenses, Accounts Payable, and Accrued Expenses – with Net Working Capital and annual change in NWC fully linked into the Cash Flow Statement
• 🔍 Dual Sensitivity Analysis – Hotel Occupancy × ADR EBITDA matrix (25-cell scenario table, color-coded green/red) and Gaming Volume × Hold Percentage casino revenue matrix (25-cell scenario table) – giving you instant scenario answers without touching a single formula
• 📊 Executive Dashboard – 6 dynamic working charts covering Total Revenue Growth, Revenue Mix by Segment, EBITDA & Net Income Trend, Occupancy Rate Trend, Casino Gaming Revenue, and ADR Trend – plus 10 KPI summary cards covering every metric lenders, operators, and investors ask about
• 📐 Project Evaluation Sheet – Full investor return analysis: NPV, IRR, Terminal Value at exit EBITDA multiple, Investor Equity Share, and Payback Period – with configurable discount rate, equity percentage, required return hurdle, and exit multiple so any investor can stress-test their return on the spot
🏆 Why This Model Stands Out
✅ Fully integrated – every sheet talks to every other sheet. Change one assumption and 1,474 formulas update instantly across all 15 tabs – no broken links, no manual reconciliation, no version control nightmares
✅ Lender and investor-ready – structured and formatted to answer the exact questions construction lenders, gaming regulators, REIT analysts, private equity buyers, and debt refinancing committees ask on day one: What is stabilized EBITDA? What is the debt service coverage ratio? When does the property cash-flow positive? What is the IRR at a 8× exit?
✅ Casino Hotel realistic – built around how gaming resorts actually generate and lose revenue: hotel occupancy ramping gradually from opening, casino utilization building as the property earns its reputation, gaming taxes calculated directly against gross gaming revenue, comps and promotions modeled as a percentage of gaming win, and a 17-role hiring plan that reflects how casino resorts actually staff up – not generic hotel assumptions recycled into a gaming template
✅ Color-coded for clarity – blue inputs, black formulas, green cross-sheet links, yellow flagged assumptions – industry-standard financial modeling conventions throughout, so any lender, investor, operator, or acquirer can open it and immediately understand the logic
✅ Fully unlocked – no protected sheets, no black-box formulas, no hidden logic. Every assumption is visible. Every formula is auditable. Own it, customize it, and present it to any gaming investor, hospitality lender, or acquisition buyer with complete confidence
📋 Model Structure – 15 Sheets
• Dashboard – 6 live charts + 10-year KPI summary cards across all key revenue, margin, occupancy, gaming, and cash metrics
• Assumptions – Every input centralized in one place: hotel drivers, casino floor configuration, F&B and entertainment drivers, personnel costs, gaming taxes, CapEx, and debt terms – all blue-coded for instant editing
• Revenue Model – All 5 revenue segments fully formula-driven from operational assumptions, with occupancy, ADR, RevPAR, table/slot utilization, covers, events, and resort fees all building up to Total Revenue
• Cost of Revenue – Per-segment COGS: hotel housekeeping and staffing costs, gaming taxes + labor + comps + slot maintenance, and F&B food and beverage costs – with Gross Profit and Gross Margin output
• Operating Expenses – 4 cost categories (Sales & Marketing, G&A, Property Operations, Loyalty Program) as percentage-of-revenue drivers, plus full Personnel Plan costs, all flowing into EBITDA
• Personnel Plan – All 17 roles with headcount by year, salary × benefits × raise compounding, total FTE count, and total personnel cost across all 10 years
• CapEx Schedule – Land & Building, Gaming Equipment, and FF&E/IT initial CapEx with straight-line depreciation by asset class, annual maintenance CapEx, accumulated depreciation, and Net PP&E by year
• Debt Schedule – Beginning balance, interest expense, principal repayment, and ending balance for all 10 years – fully linked into the Cash Flow Statement and Balance Sheet
• Working Capital Schedule – AR, inventory, prepaid expenses, AP, and accrued expenses – with Net Working Capital and Change in NWC fully linked to the Cash Flow Statement
• Income Statement – Revenue → Gross Profit → EBITDA → EBIT → Pre-Tax Income → Net Income, with 5 revenue sub-lines, full operating expense detail, D&A, interest expense, and tax provision – with Gross Margin %, EBITDA Margin %, and Net Margin % for every year
• Balance Sheet – Current assets (Cash, AR, Inventory, Prepaid), non-current assets (Net PP&E), current liabilities (AP, Accrued Expenses), non-current liabilities (Long-Term Debt), and Equity (Paid-in Capital + Retained Earnings) – with an auto-balancing check formula confirming Assets = Liabilities + Equity for every year
• Cash Flow Statement – Indirect method: Net Income → D&A add-back → Change in Working Capital → CapEx investing outflows → equity investment, debt proceeds, and principal repayment – with Beginning and Ending Cash fully linked to the Balance Sheet
• Breakeven Analysis – Fixed vs. variable cost split, contribution margin percentage, breakeven revenue, breakeven occupancy rate, and breakeven gaming volume – so you always know exactly how much you need to cover your cost structure
• Project Evaluation – NPV, IRR, Terminal Value, Investor Equity Share, and Payback Period – with configurable discount rate, investment amount, equity percentage, required return hurdle, and exit EBITDA multiple
• Sensitivity Analysis – Hotel Occupancy × ADR EBITDA matrix and Gaming Volume × Hold Percentage casino revenue matrix – 50 instant scenario data points, color-coded for at-a-glance risk assessment
*"Most casino hotel developers know their property inside out. The ones who close construction financing, attract institutional equity, and build trophy gaming assets also know their numbers inside out. This model is how you close that gap – in an afternoon, not a quarter."*
Key Words:
Strategy & Transformation, Growth Strategy, Strategic Planning, Strategy Frameworks, Innovation Management, Pricing Strategy, Core Competencies, Strategy Development, Business Transformation, Marketing Plan Development, Product Strategy, Breakout Strategy, Competitive Advantage, Mission, Vision, Values, Strategy Deployment & Execution, Innovation, Vision Statement, Core Competencies Analysis, Corporate Strategy, Product Launch Strategy, BMI, Blue Ocean Strategy, Breakthrough Strategy, Business Model Innovation, Business Strategy Example, Corporate Transformation, Critical Success Factors, Customer Segmentation, Customer Value Proposition, Distinctive Capabilities, Enterprise Performance Management, KPI, Key Performance Indicators, Market Analysis, Market Entry Example, Market Entry Plan, Market Intelligence, Market Research, Market Segmentation, Market Sizing, Marketing, Michael Porter's Value Chain, Organizational Transformation, Performance Management, Performance Measurement, Platform Strategy, Product Go-to-Market Strategy, Reorganization, Restructuring, SWOT, SWOT Analysis, Service 4.0, Service Strategy, Service Transformation, Strategic Analysis, Strategic Plan Example, Strategy Deployment, Strategy Execution, Strategy Frameworks Compilation, Strategy Methodologies, Strategy Report Example, Value Chain, Value Chain Analysis, Value Innovation, Value Proposition, Vision Statement, Corporate Strategy, Business Development, Business plan pdf, business plan, PDF, Business Plan DOC, Business Plan Template, PPT, Market strategy playbook, strategic market planning, competitive analysis tools, market segmentation frameworks, growth strategy templates, product positioning strategy, market execution toolkit, strategic alignment playbook, KPI and OKR frameworks, business growth strategy guide, cross-functional strategy templates, market risk management, market strategy PowerPoint doc, guide, ebook, e-book ,McKinsey Change Playbook, Organizational change management toolkit, Change management frameworks 2025, Influence model for change, Change leadership strategies, Behavioral change in organizations, Change management PowerPoint templates, Transformational leadership in change, supply chain KPIs, supply chain KPI toolkit, supply chain PowerPoint template, logistics KPIs, procurement KPIs, inventory management KPIs, supply chain performance metrics, manufacturing KPIs, supply chain dashboard, supply chain strategy KPIs, reverse logistics KPIs, sustainability KPIs in supply chain, financial supply chain KPIs, warehouse KPIs, digital supply chain KPIs, 1200 KPIs, supply chain scorecard, KPI examples, supply chain templates, Corporate Finance SOPs, Finance SOP Excel Template, CFO Toolkit, Finance Department Procedures, Financial Planning SOPs, Treasury SOPs, Accounts Payable SOPs, Accounts Receivable SOPs, General Ledger SOPs, Accounting Policies Template, Internal Controls SOPs, Finance Process Standardization, Finance Operating Procedures, Finance Department Excel Template, FP&A Process Documentation, Corporate Finance Template, Finance SOP Toolkit, CFO Process Templates, Accounting SOP Package, Tax Compliance SOPs, Financial Risk Management Procedures.
NOTE: Our digital products are sold on an "as is" basis, making returns and refunds unavailable post-download. Please preview and inquire before purchasing. Please contact us before purchasing if you have any questions! This policy aligns with the standard Flevy Terms of Usage.
Got a question about the product? Email us at support@flevy.com or ask the author directly by using the "Ask the Author a Question" form. If you cannot view the preview above this document description, go here to view the large preview instead.
Source: Best Practices in Hotel Industry, Casino Industry, Integrated Financial Model Excel: Casino Hotel 10-Year Financial Model Excel (XLSX) Spreadsheet, SB Consulting
ABOUT THE AUTHOR
SB Consulting is dedicated to empowering businesses to communicate their ideas with impact. This consulting firm specializes in teaching organizations how to create effective corporate and management presentations. With training from top-tier global consulting firms, including McKinsey, BCG, and Porsche Consulting, extensive expertise in presentation design and ... [read more]
Ask the Author a Question
You must be logged in to contact the author.
