
 Click main image to view in full screen. Unlock all 15 preview images:
BDC NAV, NII, Dividend & Leverage Financial Model – Excel XLSX
Excel (XLSX) + supplemental PDF


BENEFITS OF THIS DOWNLOADABLE EXCEL DOCUMENT
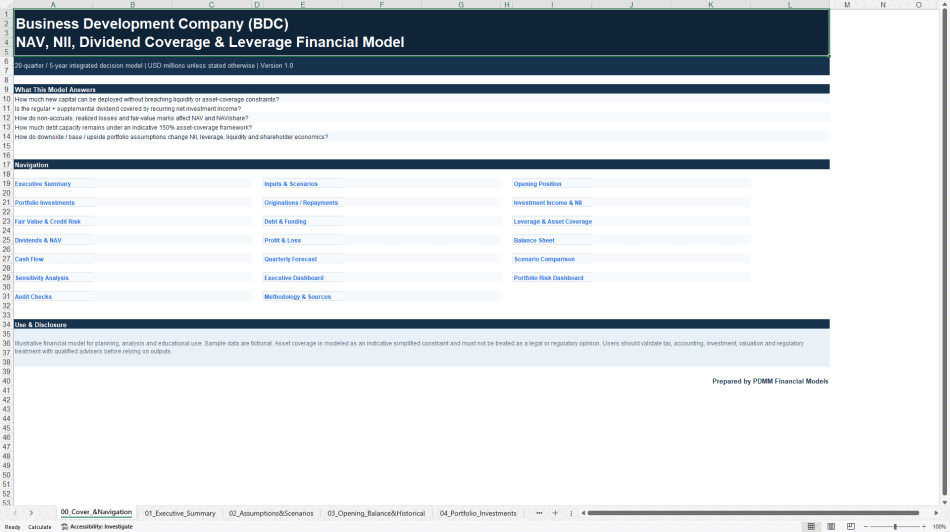
- Links 20 quarters of BDC portfolio activity, investment income, funding, NAV, dividends, liquidity and financial statements in one integrated Excel model.
- Provides Downside, Base and Upside scenario analysis plus four sensitivities for NAV/share, NII/share, dividend coverage and asset coverage.
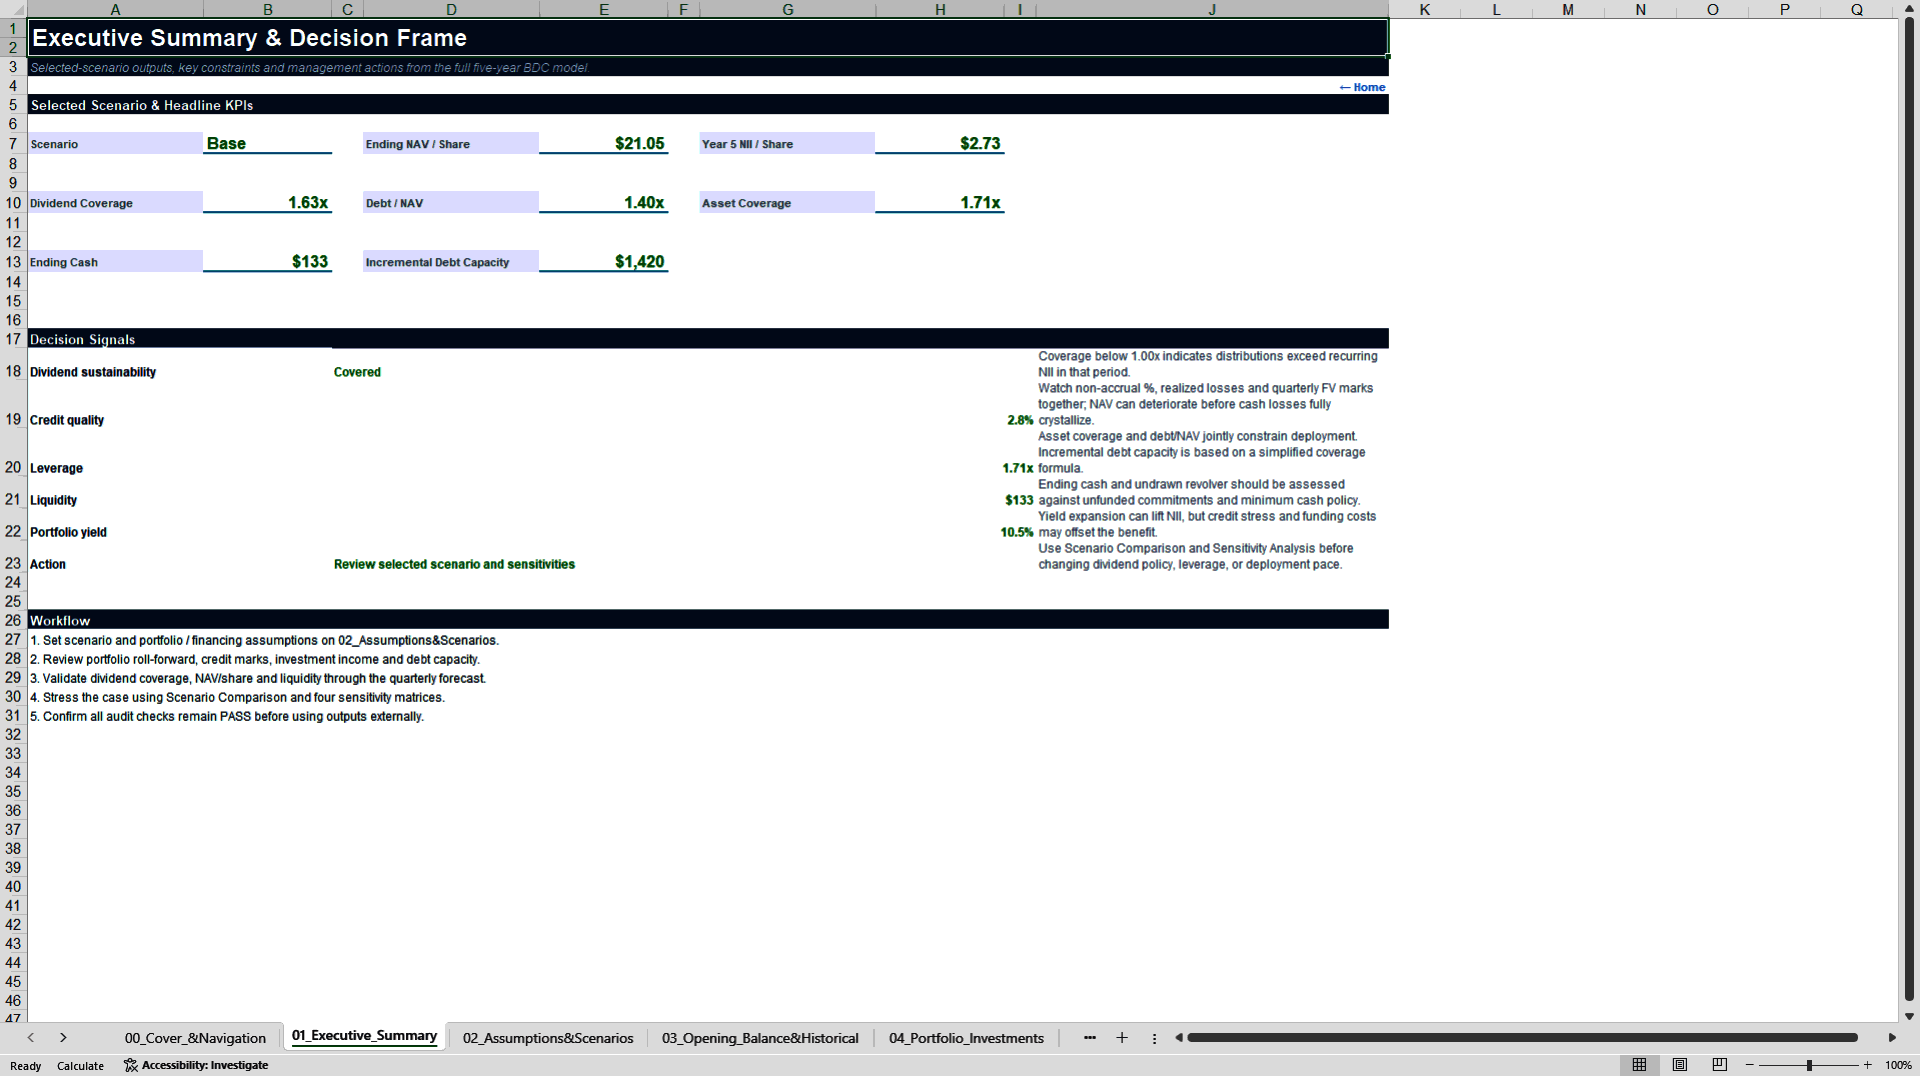
- Converts portfolio, credit and funding assumptions into decision-ready dashboards for leverage headroom, debt capacity, cash, distributions and shareholder economics.
PRIVATE EQUITY EXCEL DESCRIPTION
This Business Development Company financial model is a 20-quarter, five-year Excel decision tool built around the operating and financial mechanics that matter most to a BDC: portfolio deployment, investment income, credit quality, funding, leverage, dividends, NAV and liquidity.
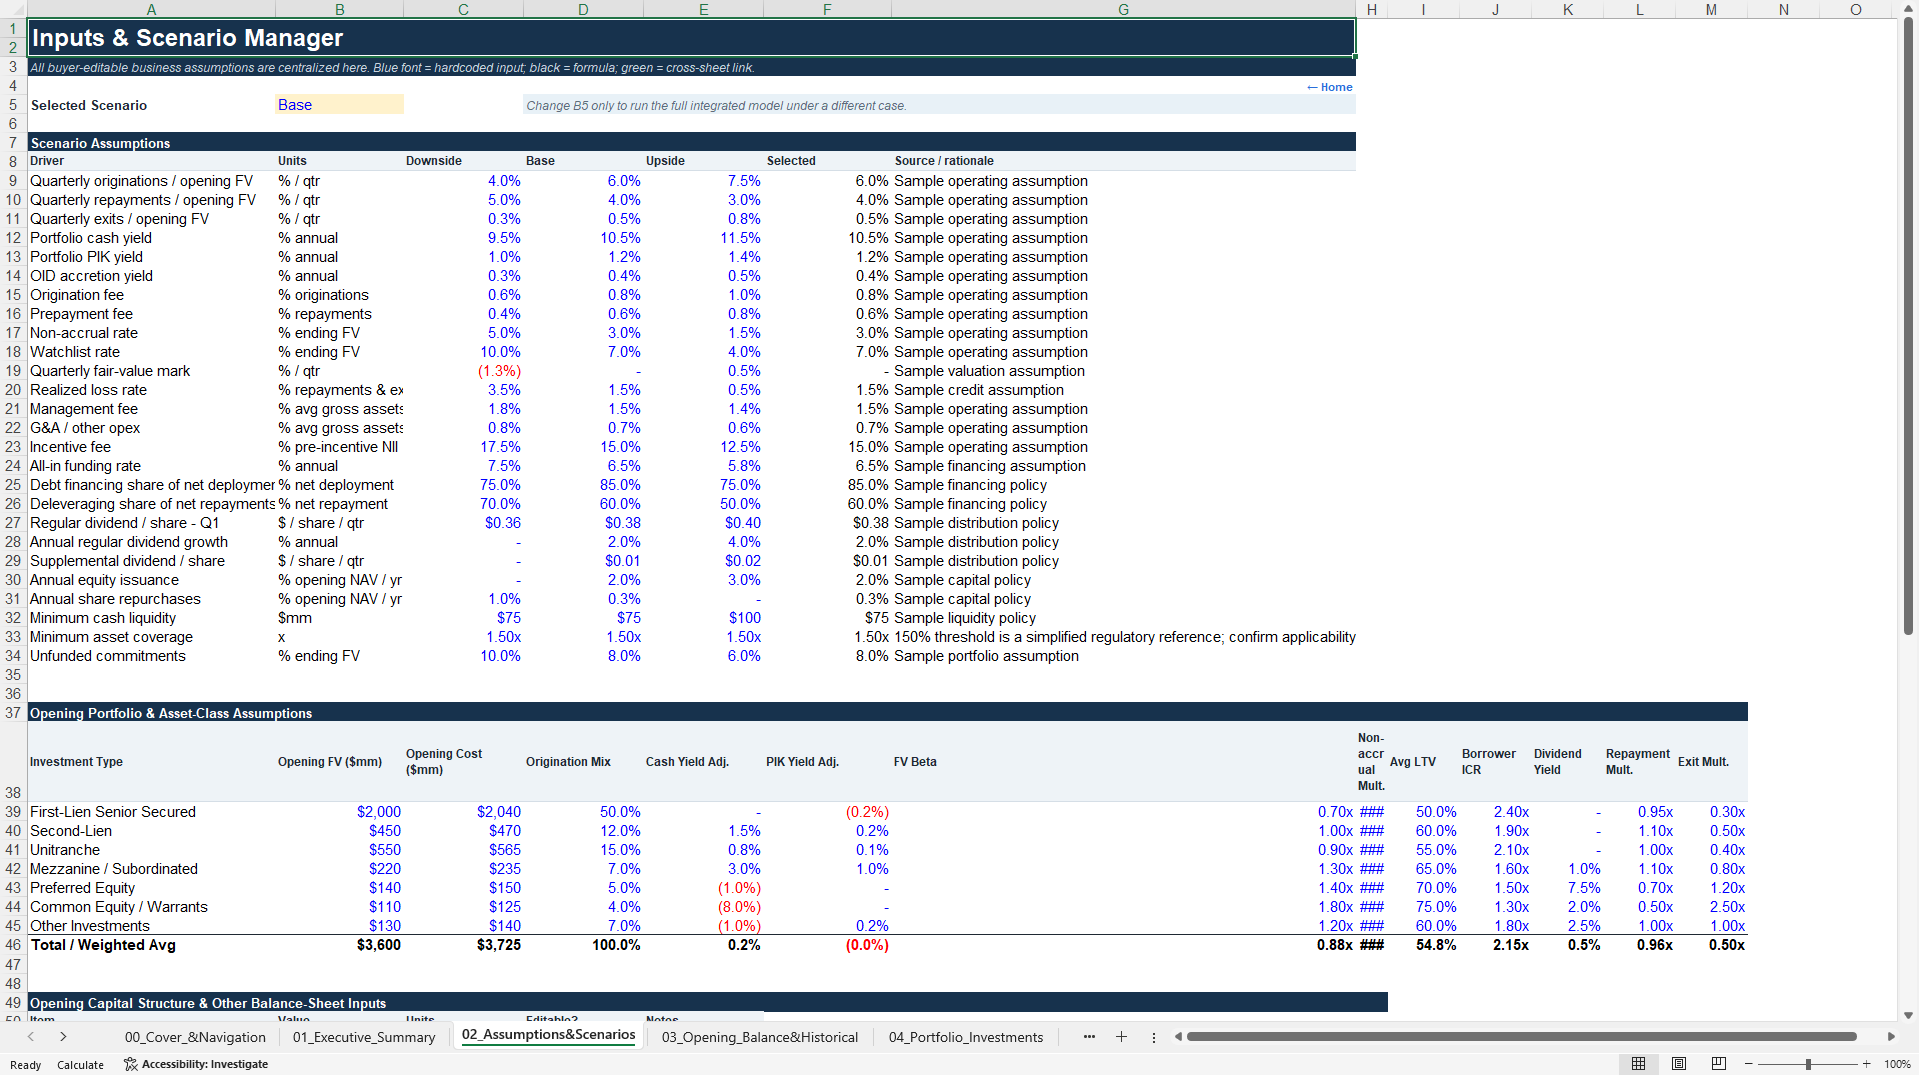
The workbook starts with a centralized scenario manager containing Downside, Base and Upside assumptions. Users can edit origination, repayment and exit rates; portfolio cash yield, PIK and OID; fee assumptions; non-accrual and watchlist rates; fair-value marks and realized loss rates; management, operating and incentive fees; funding costs; financing and deleveraging shares; dividends; equity issuance and repurchases; minimum cash; asset-coverage threshold; and unfunded commitments. Opening portfolio balances are organized across seven investment types, while the capital structure includes a revolving credit facility, unsecured notes and secured or other debt.
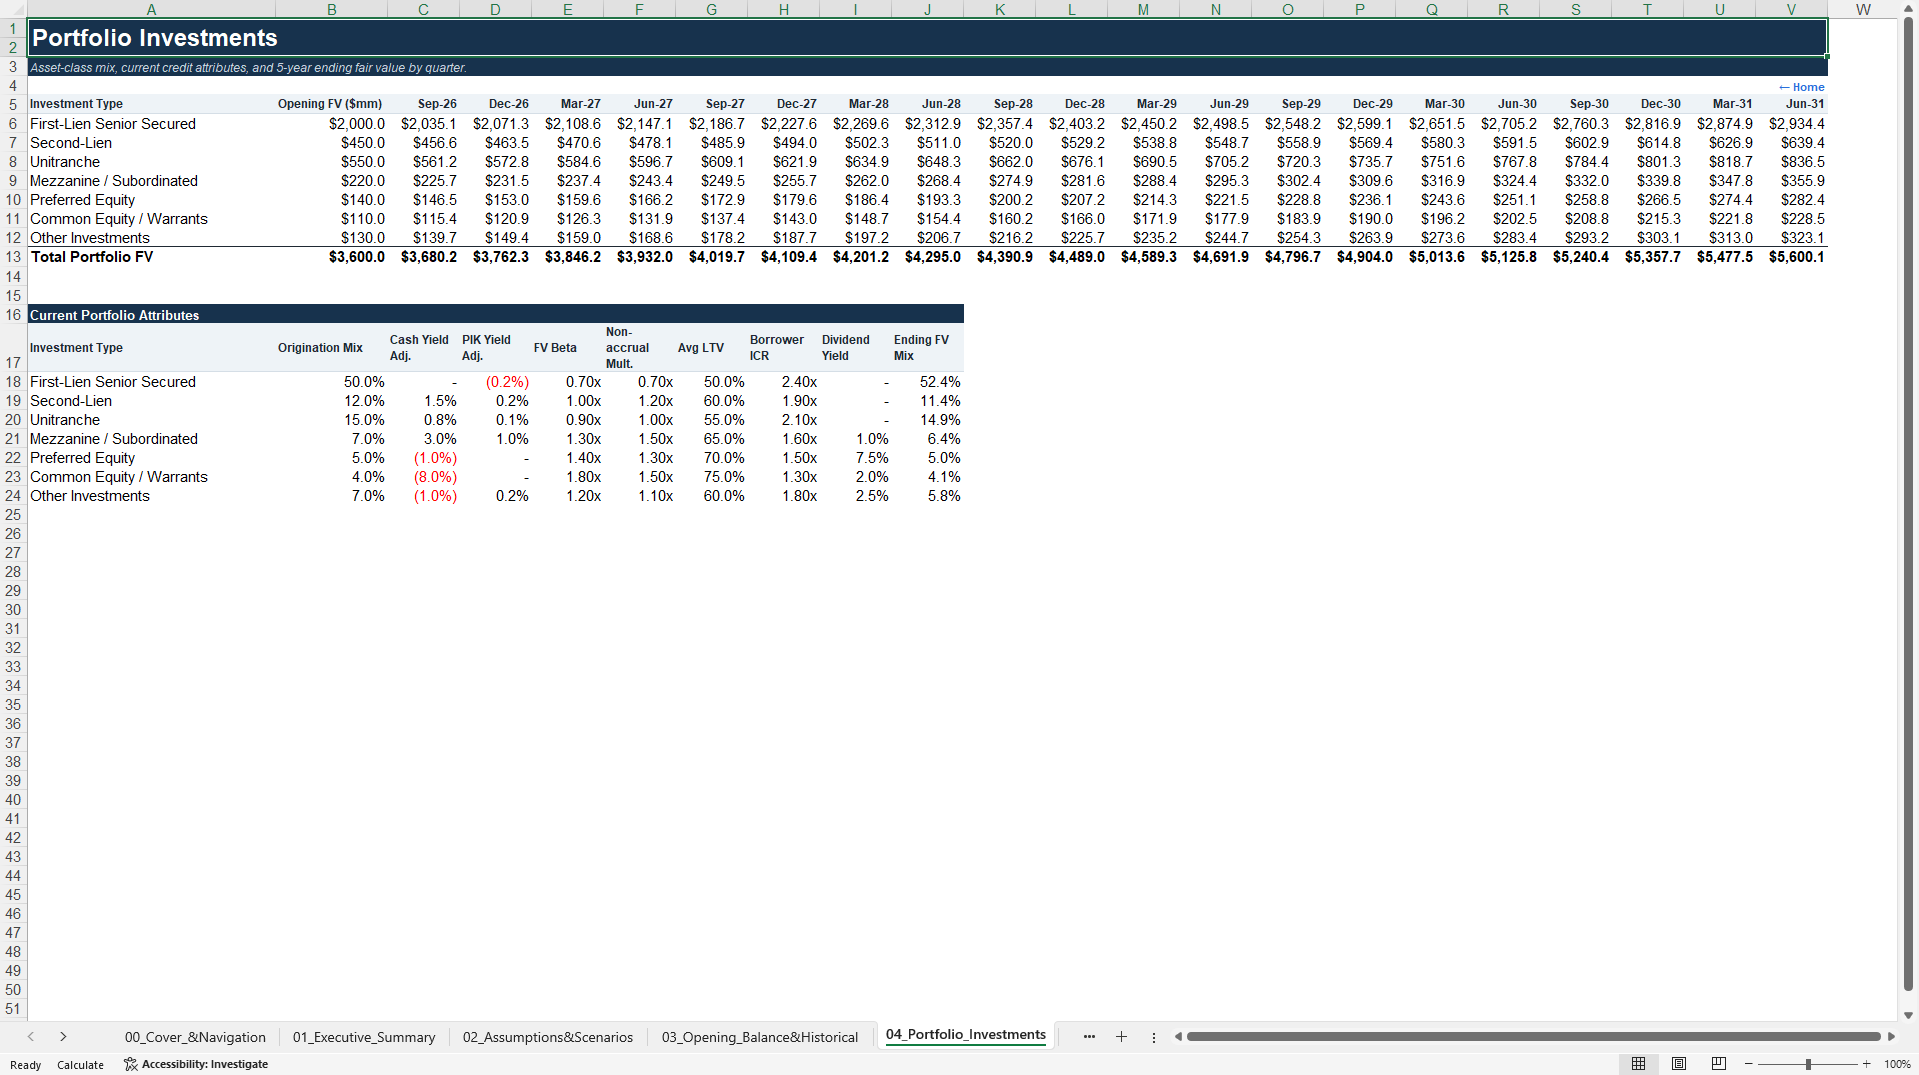
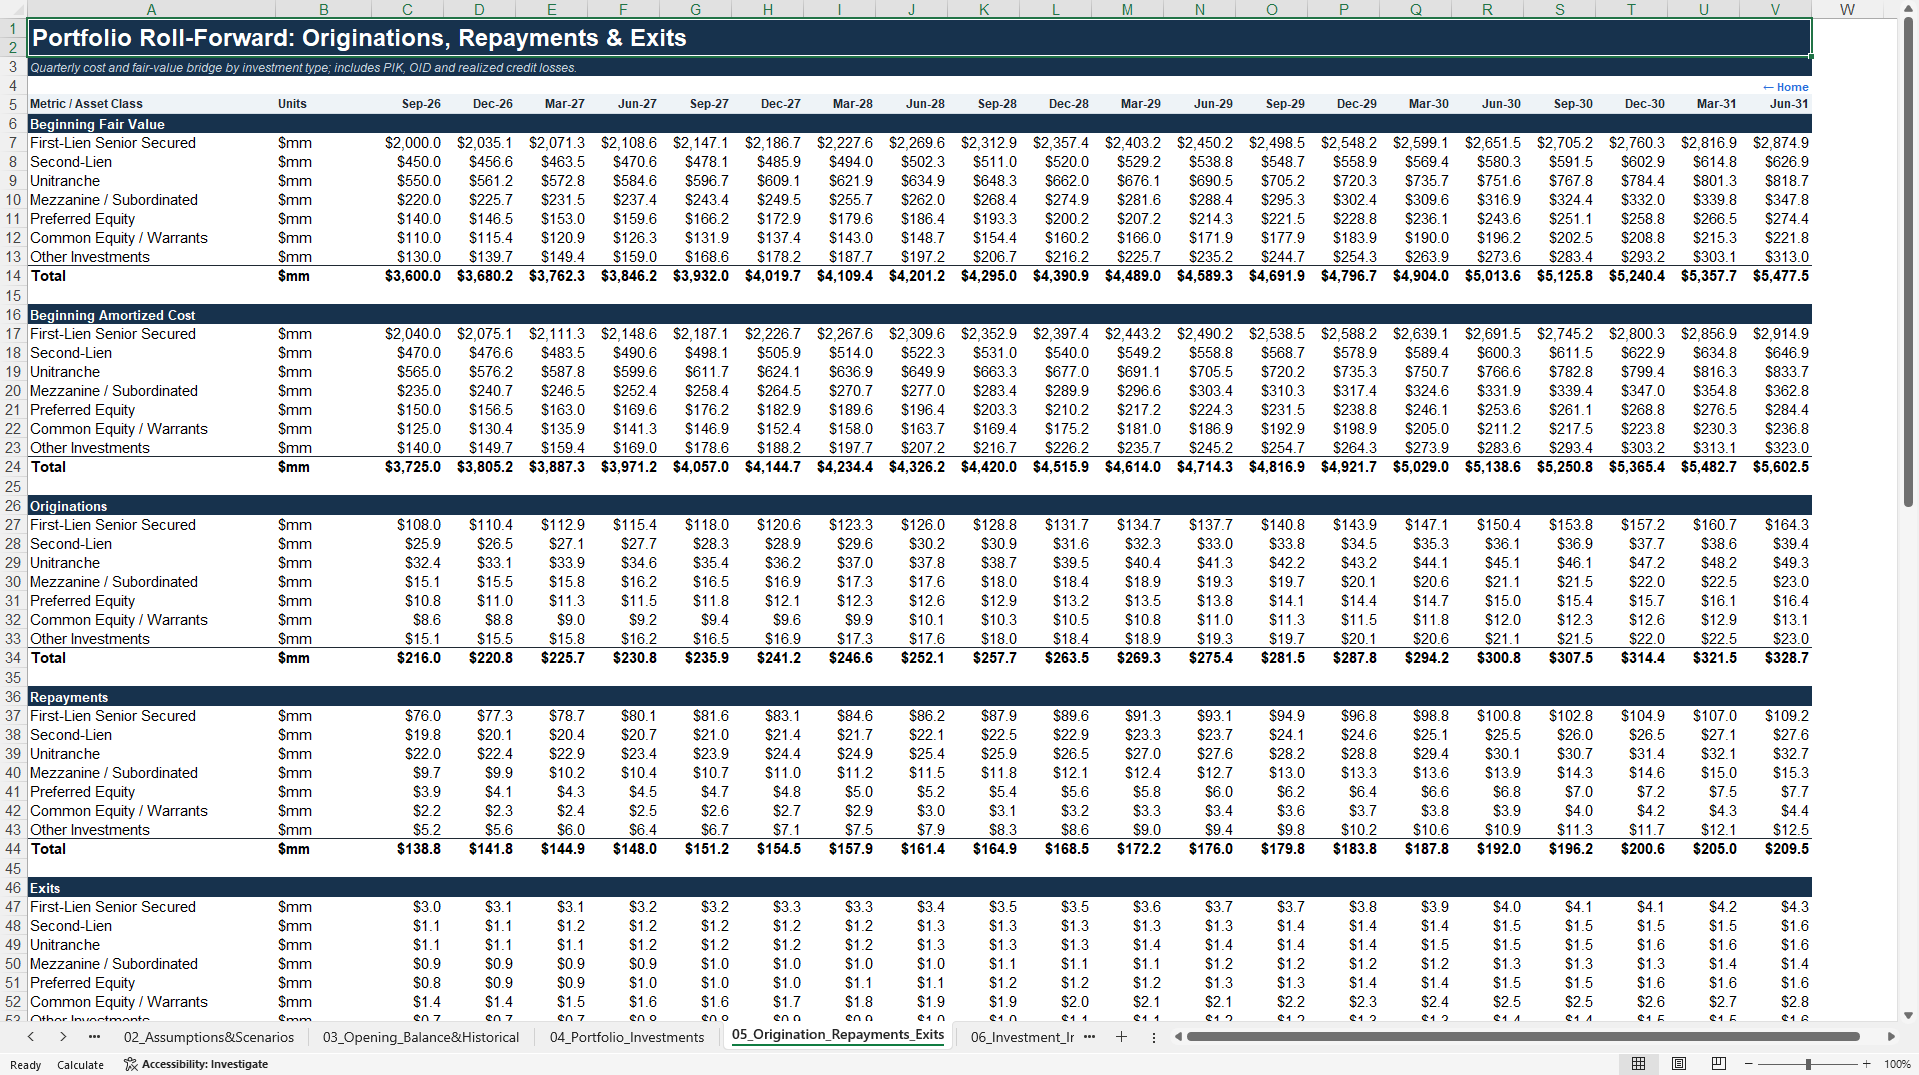
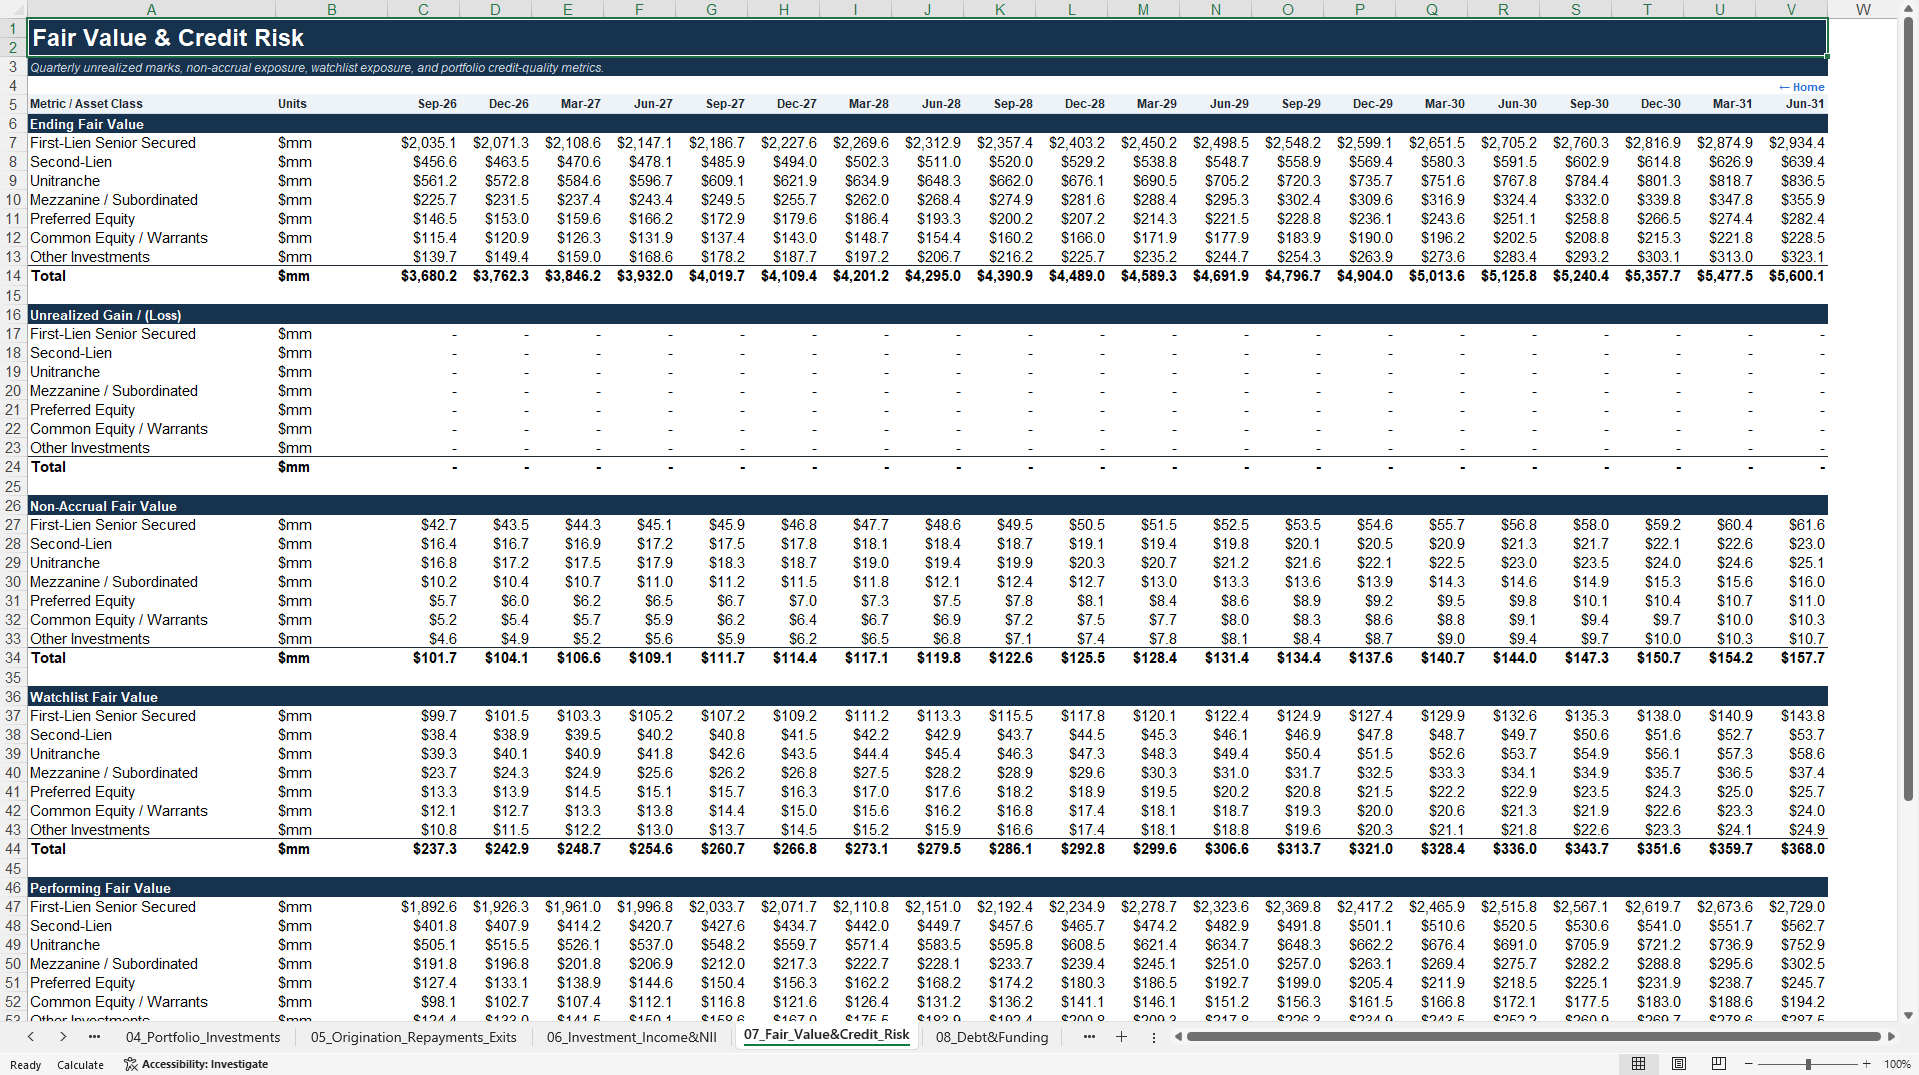
The model rolls portfolio fair value and amortized cost forward quarter by quarter. Separate schedules calculate cash interest, PIK, OID accretion, prepayment fees, dividend income and origination fees, then bridge those items through management fees, operating costs, interest expense and incentive fees to quarterly net investment income and NII per share. Credit and valuation schedules track unrealized gains or losses, non-accrual fair value, watchlist exposure, performing exposure, weighted LTV, borrower interest coverage, cash yield and fair-value beta.
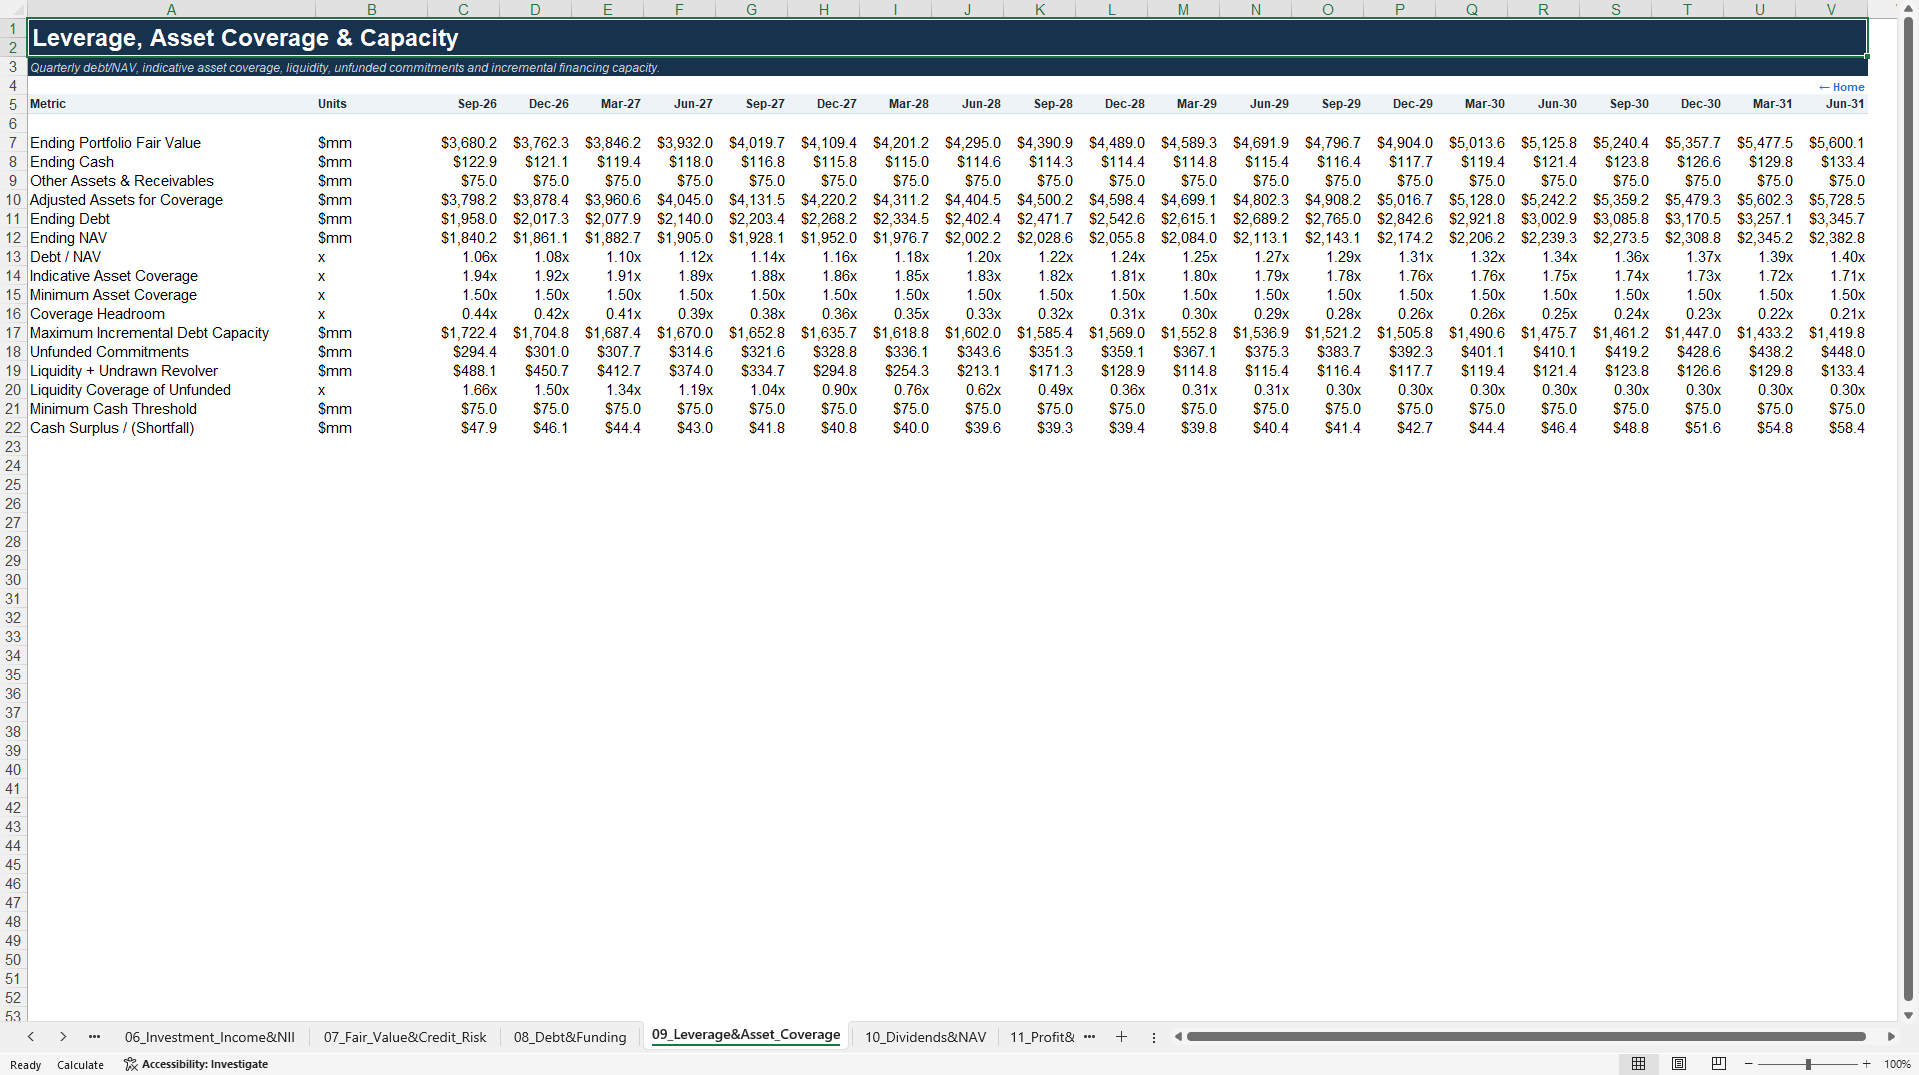
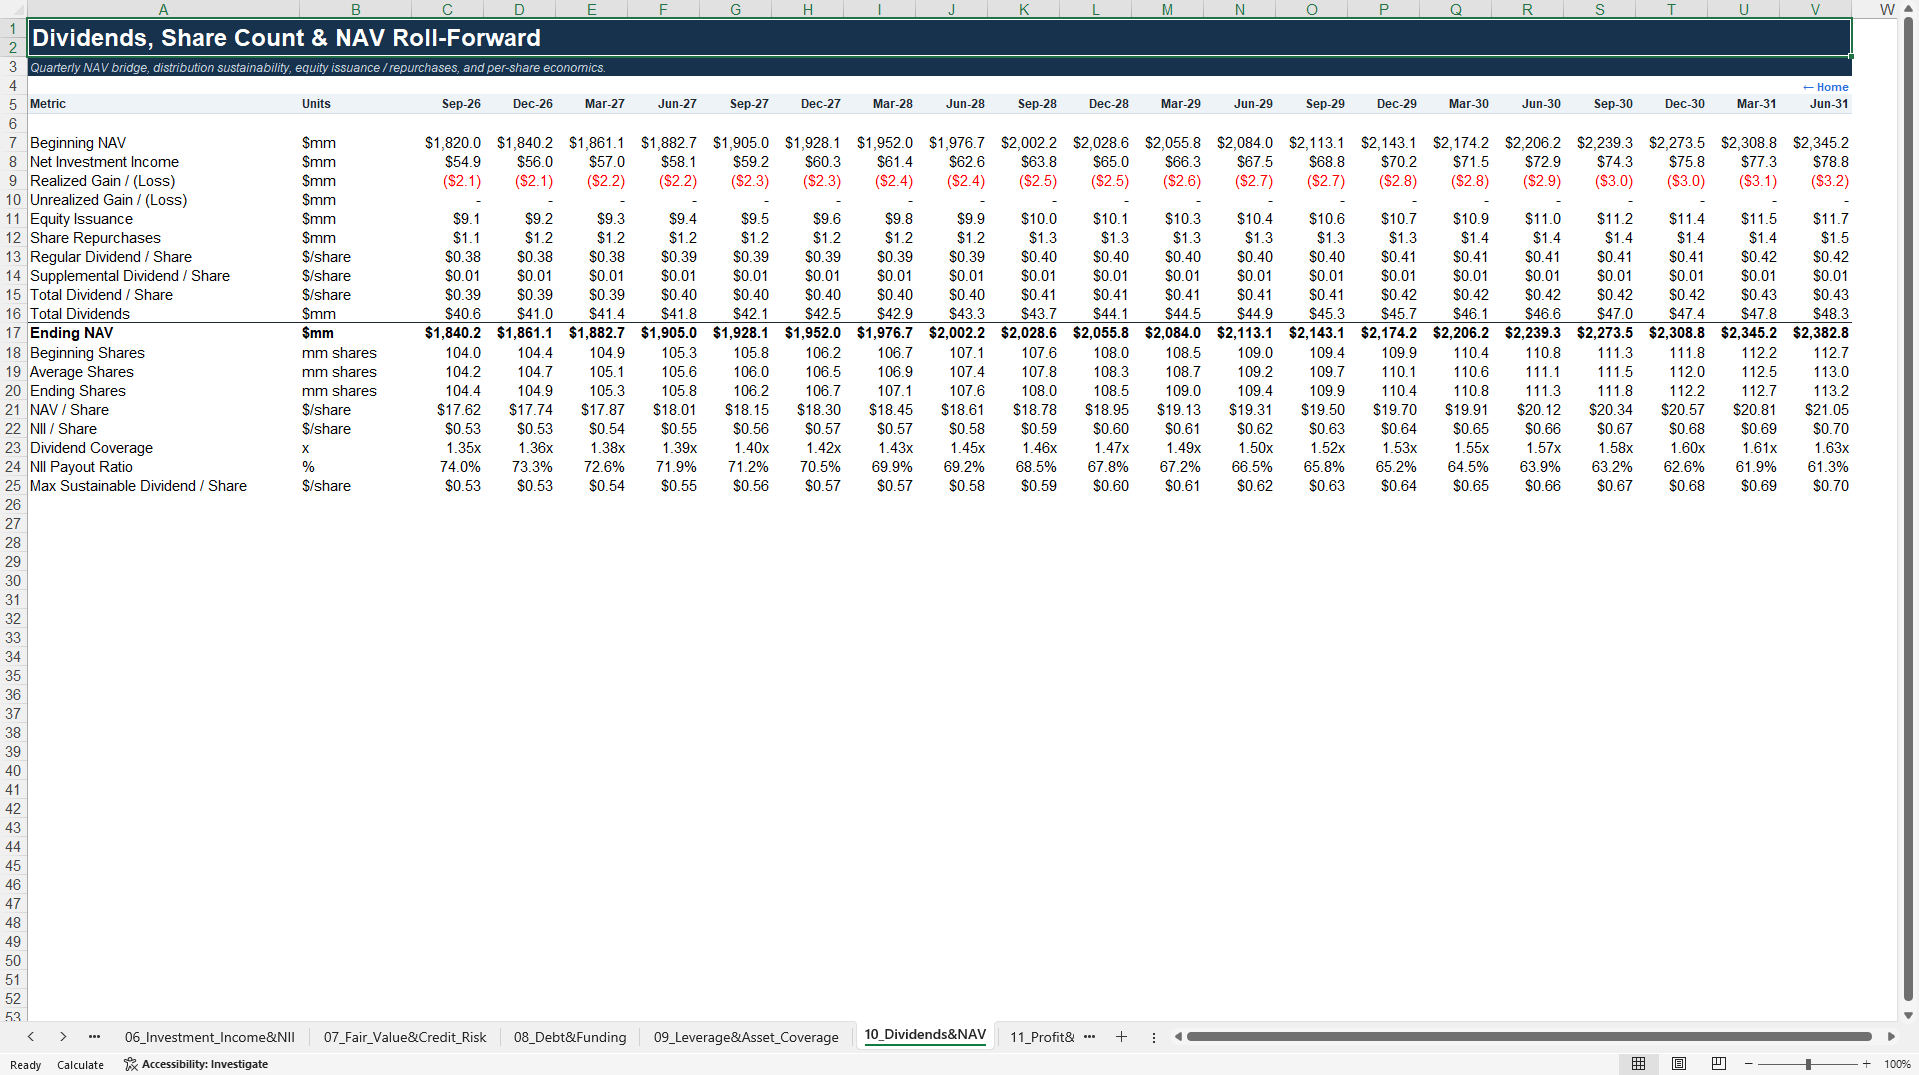
Funding schedules track debt draws, refinancing, repayments, ending balances, funding rates and interest expense. The leverage section calculates Debt to NAV, indicative asset coverage, coverage headroom, incremental debt capacity, unfunded commitments, liquidity coverage and minimum-cash headroom. The dividend and NAV schedule connects NII, realized and unrealized gains or losses, equity activity and distributions to NAV, NAV per share, dividend coverage, payout ratio and sustainable dividend per share.
The workbook also includes Profit and Loss, Balance Sheet and Cash Flow statements plus a consolidated five-year quarterly forecast. A scenario comparison summarizes Downside, Base and Upside results for portfolio value, Year-5 NII, NAV, dividend coverage and leverage. Four sensitivity matrices test NAV per share, NII per share, dividend coverage and asset coverage against key credit, yield, funding, dividend-growth and leverage variables.
Two decision dashboards provide management-level views. The Executive Dashboard highlights NAV per share, NII per share, dividend coverage, Debt to NAV, asset coverage and ending cash, supported by trend charts. The Portfolio and Risk Dashboard focuses on portfolio value, non-accrual exposure, weighted cash yield, unfunded commitments, liquidity coverage and debt capacity, with charts for portfolio composition, credit quality, income mix and debt maturity. An audit and integrity worksheet tests important reconciliations, while the methodology worksheet documents calculation conventions and model structure.
This model is well suited to BDC management teams, private-credit and direct-lending platforms, CFO and FP&A teams, portfolio managers, analysts, accountants, consultants, lenders and investors that need a structured way to connect operating assumptions to five-year earnings, NAV, distributions, leverage and liquidity outcomes.
Got a question about the product? Email us at support@flevy.com or ask the author directly by using the "Ask the Author a Question" form. If you cannot view the preview above this document description, go here to view the large preview instead.
Source: Best Practices in Private Equity, Integrated Financial Model Excel: BDC NAV, NII, Dividend & Leverage Financial Model Excel (XLSX) Spreadsheet, PDMM Financial Models
ABOUT THE AUTHOR

PDMM Financial Models develops professional, decision-ready Excel models for business owners, entrepreneurs, investors, consultants, analysts, and finance teams. Our objective is to transform complex business assumptions into clear, structured analysis that supports better planning and investment decisions.
Our models cover business planning, forecasting, budgeting, feasibility analysis,
... [read more]
Ask the Author a Question
You must be logged in to contact the author.




























