 Click main image to view in full screen.
Apex Global Industries Inc. Cap Table – Excel XLSX
Excel (XLSX)


BENEFITS OF THIS DOWNLOADABLE EXCEL DOCUMENT
- Fully integrated live formulas calculate ownership percentages, post-money valuation, price per share, and dilution automatically.
- Institutional-standard structure enables rapid scenario analysis by updating only yellow input cells for shares and round terms.
- Pre-populated illustrative data and integrity checks make this Cap Table template ready for immediate investor or board use.
FINANCING EXCEL DESCRIPTION
Apex Global Industries Inc. Cap Table | Professional Excel Template
Download a fully integrated capitalization table (Cap Table) Excel template built to institutional and Fortune 500 standards. This professional investor ownership model includes live formulas, illustrative share counts, automatic dilution calculations, pre-money and post-money valuation, and fully diluted ownership percentages for immediate fundraising and equity management use.
This institutional-quality Cap Table provides a clear, dynamic view of Apex Global Industries Inc.'s ownership structure before and after a new investment round. Designed for founders, CFOs, venture capital firms, private equity investors, corporate development teams, and legal counsel, the workbook seamlessly links current shareholdings, option pool, and new round terms into accurate basic and fully diluted ownership percentages.
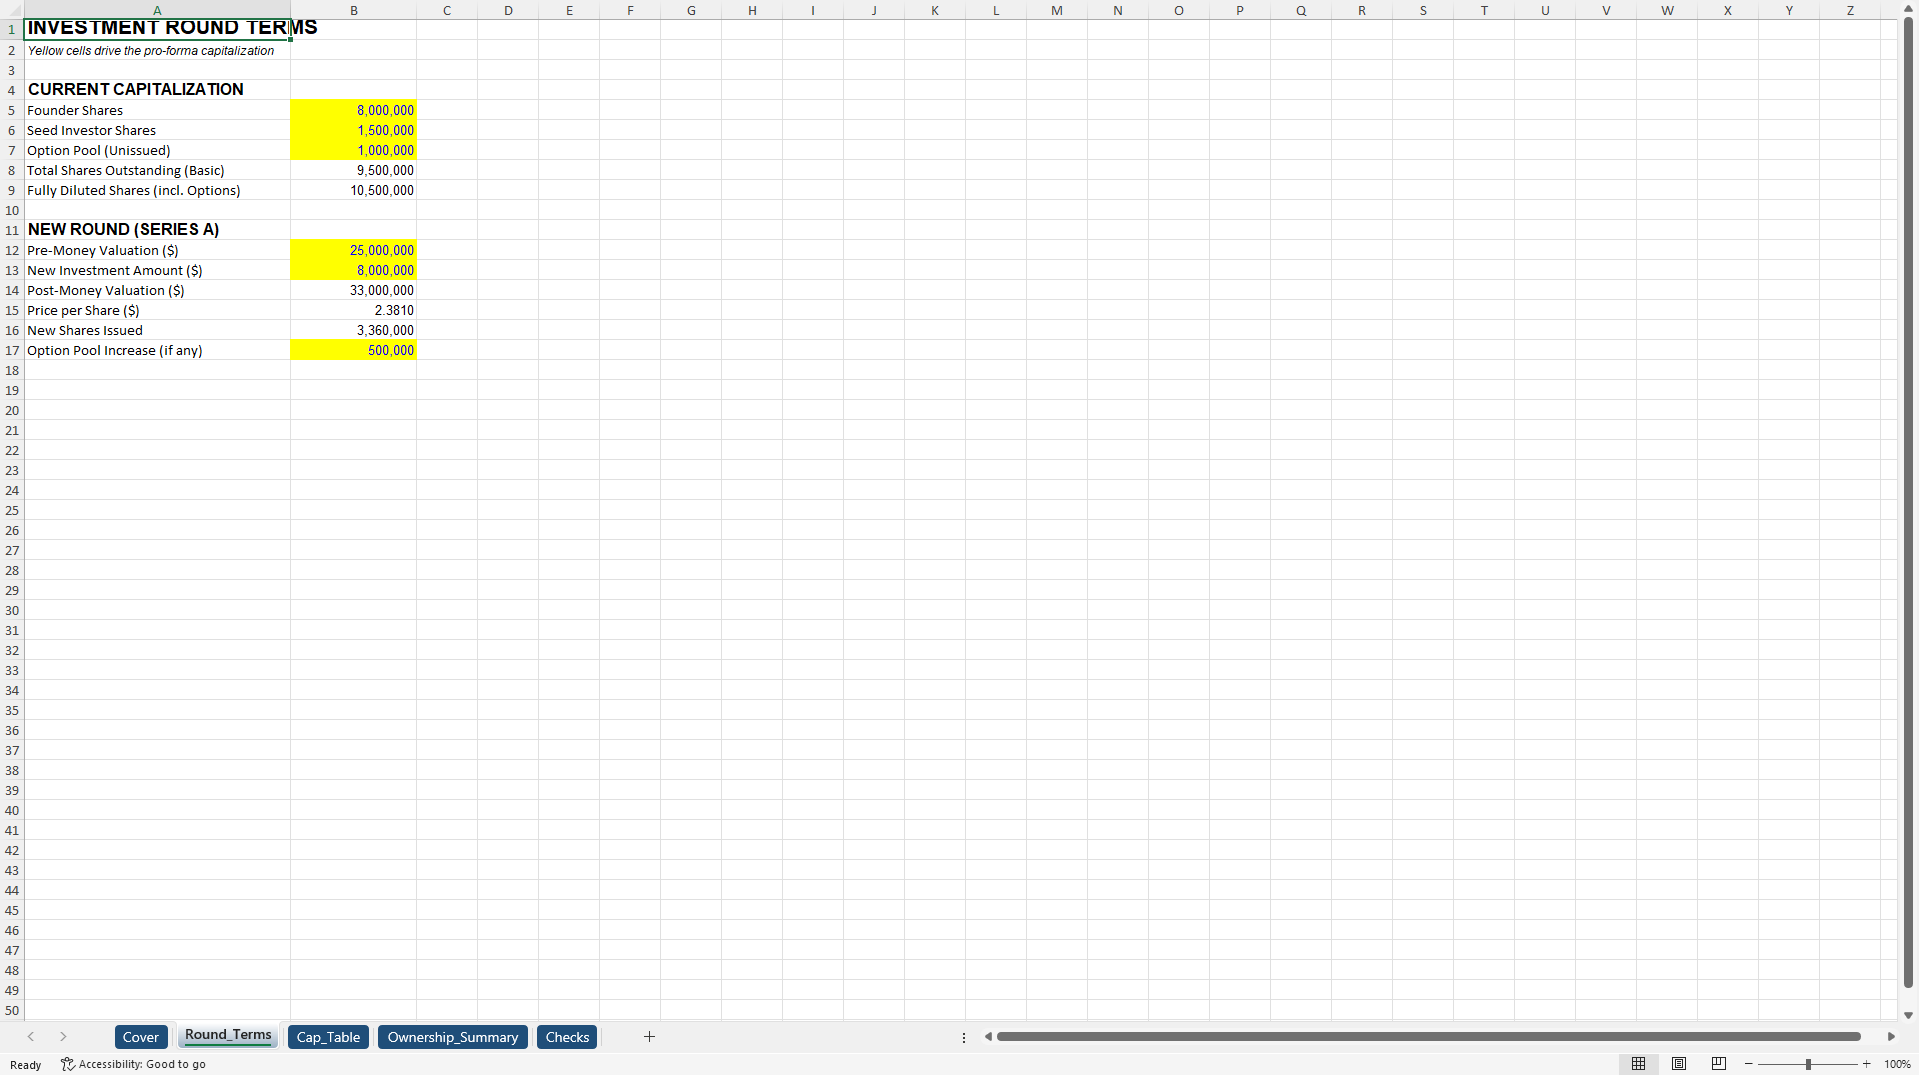
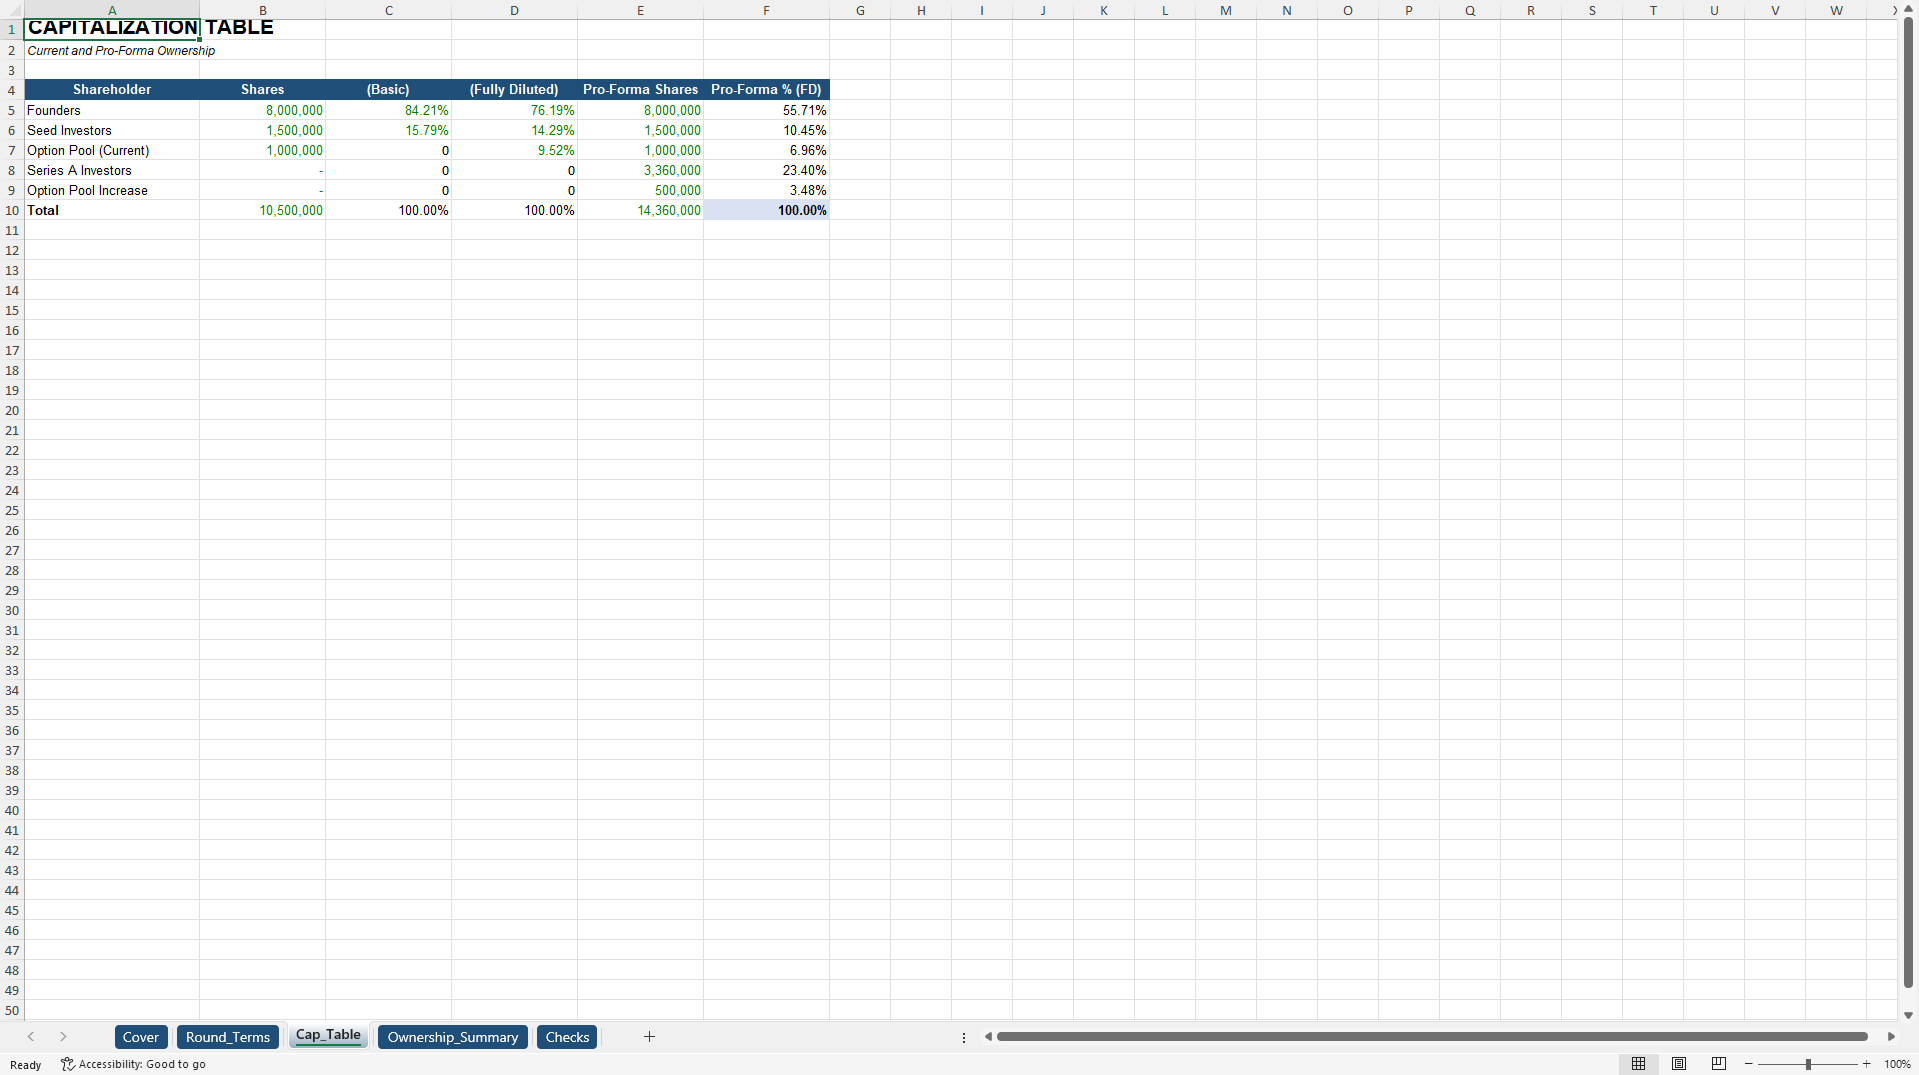
Current capitalization includes founder shares, seed investor shares, and an unissued option pool. The model calculates total shares outstanding on both a basic and fully diluted basis. For a new financing round, users input pre-money valuation and investment amount. The model automatically computes post-money valuation, price per share, and the number of new shares issued. Pro-forma ownership is then calculated for all shareholders, including any option pool increase, showing precise dilution impact.
Three Key Benefits
Fully integrated live formulas calculate ownership percentages, post-money valuation, price per share, and dilution automatically.
Institutional-standard structure enables rapid scenario analysis by updating only yellow input cells for shares and round terms.
Pre-populated illustrative data and integrity checks make this Cap Table template ready for immediate investor or board use.
How to Use This Cap Table Model
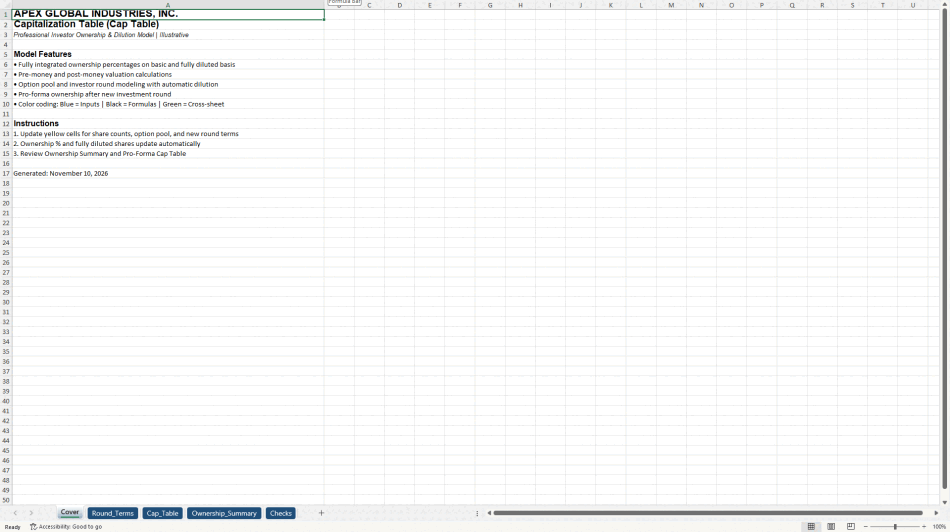
Open the Cover sheet for an overview, then navigate to the Round Terms tab. Update yellow input cells for founder shares, seed investor shares, current option pool, pre-money valuation, new investment amount, and any option pool increase.
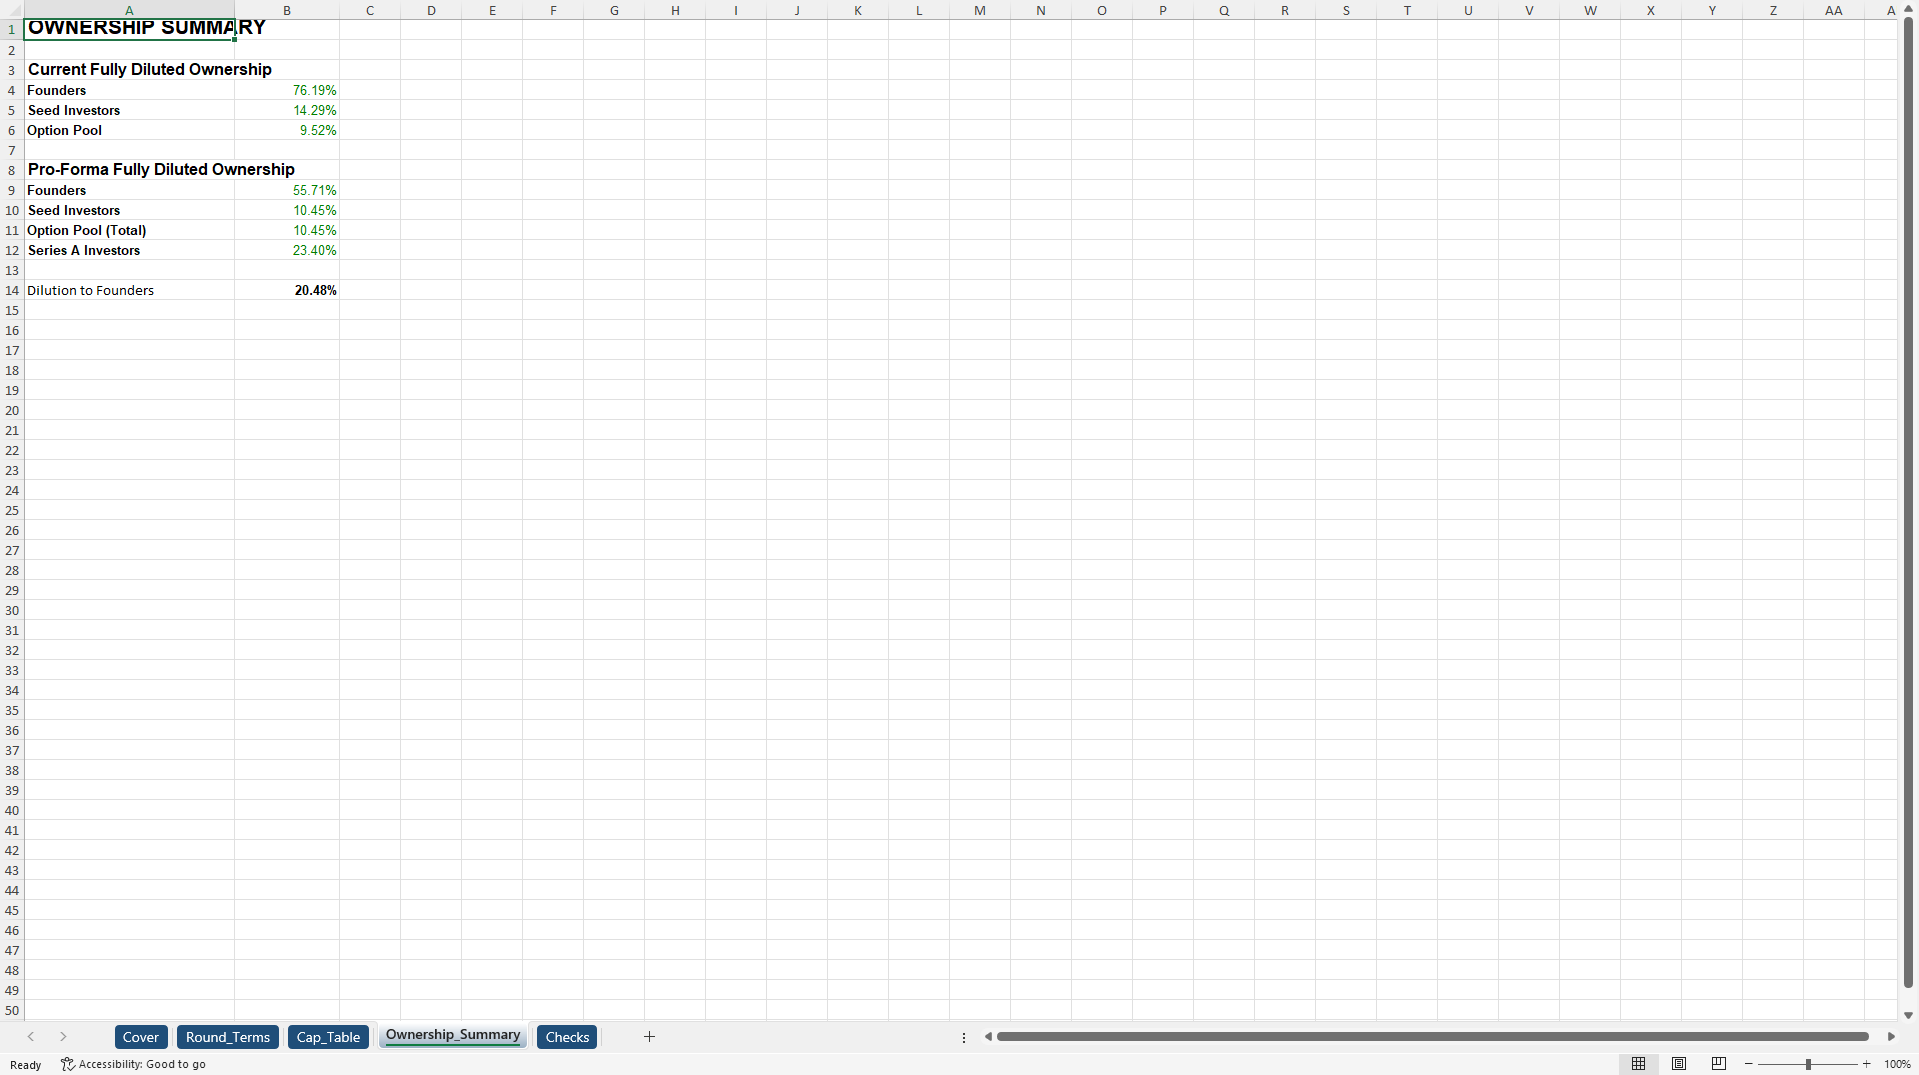
All calculations update automatically. The model computes total basic shares, fully diluted shares, post-money valuation, price per share, and new shares to be issued. Review the Cap Table sheet for current and pro-forma share counts along with ownership percentages on both basic and fully diluted bases. The Ownership Summary sheet highlights founder dilution and final pro-forma ownership for each shareholder group. Confirm model integrity on the Checks tab, which verifies that ownership percentages sum to 100%.
The model follows professional color coding: blue font for inputs, black for formulas, and green for cross-sheet links. Number formats use standard integer formatting for share counts and percentage formatting to two decimal places. All valuation figures are presented in dollars.
This Excel Cap Table is ideal for fundraising preparations, term sheet negotiations, board presentations, investor updates, and employee equity communications. It eliminates manual calculation errors while delivering the transparency and rigor expected by institutional investors and leading corporations.
Download the Apex Global Industries Inc.
Cap Table today – a robust, audit-friendly ownership tracking tool that supports accurate dilution analysis and clear communication of equity stakes before and after financing rounds
Regards,
UJ Consulting
Strategy – Insight – Impact
Got a question about the product? Email us at support@flevy.com or ask the author directly by using the "Ask the Author a Question" form. If you cannot view the preview above this document description, go here to view the large preview instead.
Source: Best Practices in Financing, Capital Structure Excel: Apex Global Industries Inc. Cap Table Excel (XLSX) Spreadsheet, UJ Consulting _ Strategy-Insight-Impact
ABOUT THE AUTHOR

UJ Consulting | Strategy • Insight • Impact
UJ Consulting is an executive management consulting and business transformation practice founded by Untung Juanto, ST., MM., a senior executive, consultant, and transformation practitioner with more than 25 years of professional experience across local and multinational companies and diverse industries.
His career progressed from frontline
... [read more]
Ask the Author a Question
You must be logged in to contact the author.