

 Click main image to view in full screen.
Agency Financial System: Client Profitability and Team Utili – Excel XLSX
Excel (XLSX) + Excel (XLSX)


BENEFITS OF THIS DOWNLOADABLE EXCEL DOCUMENT
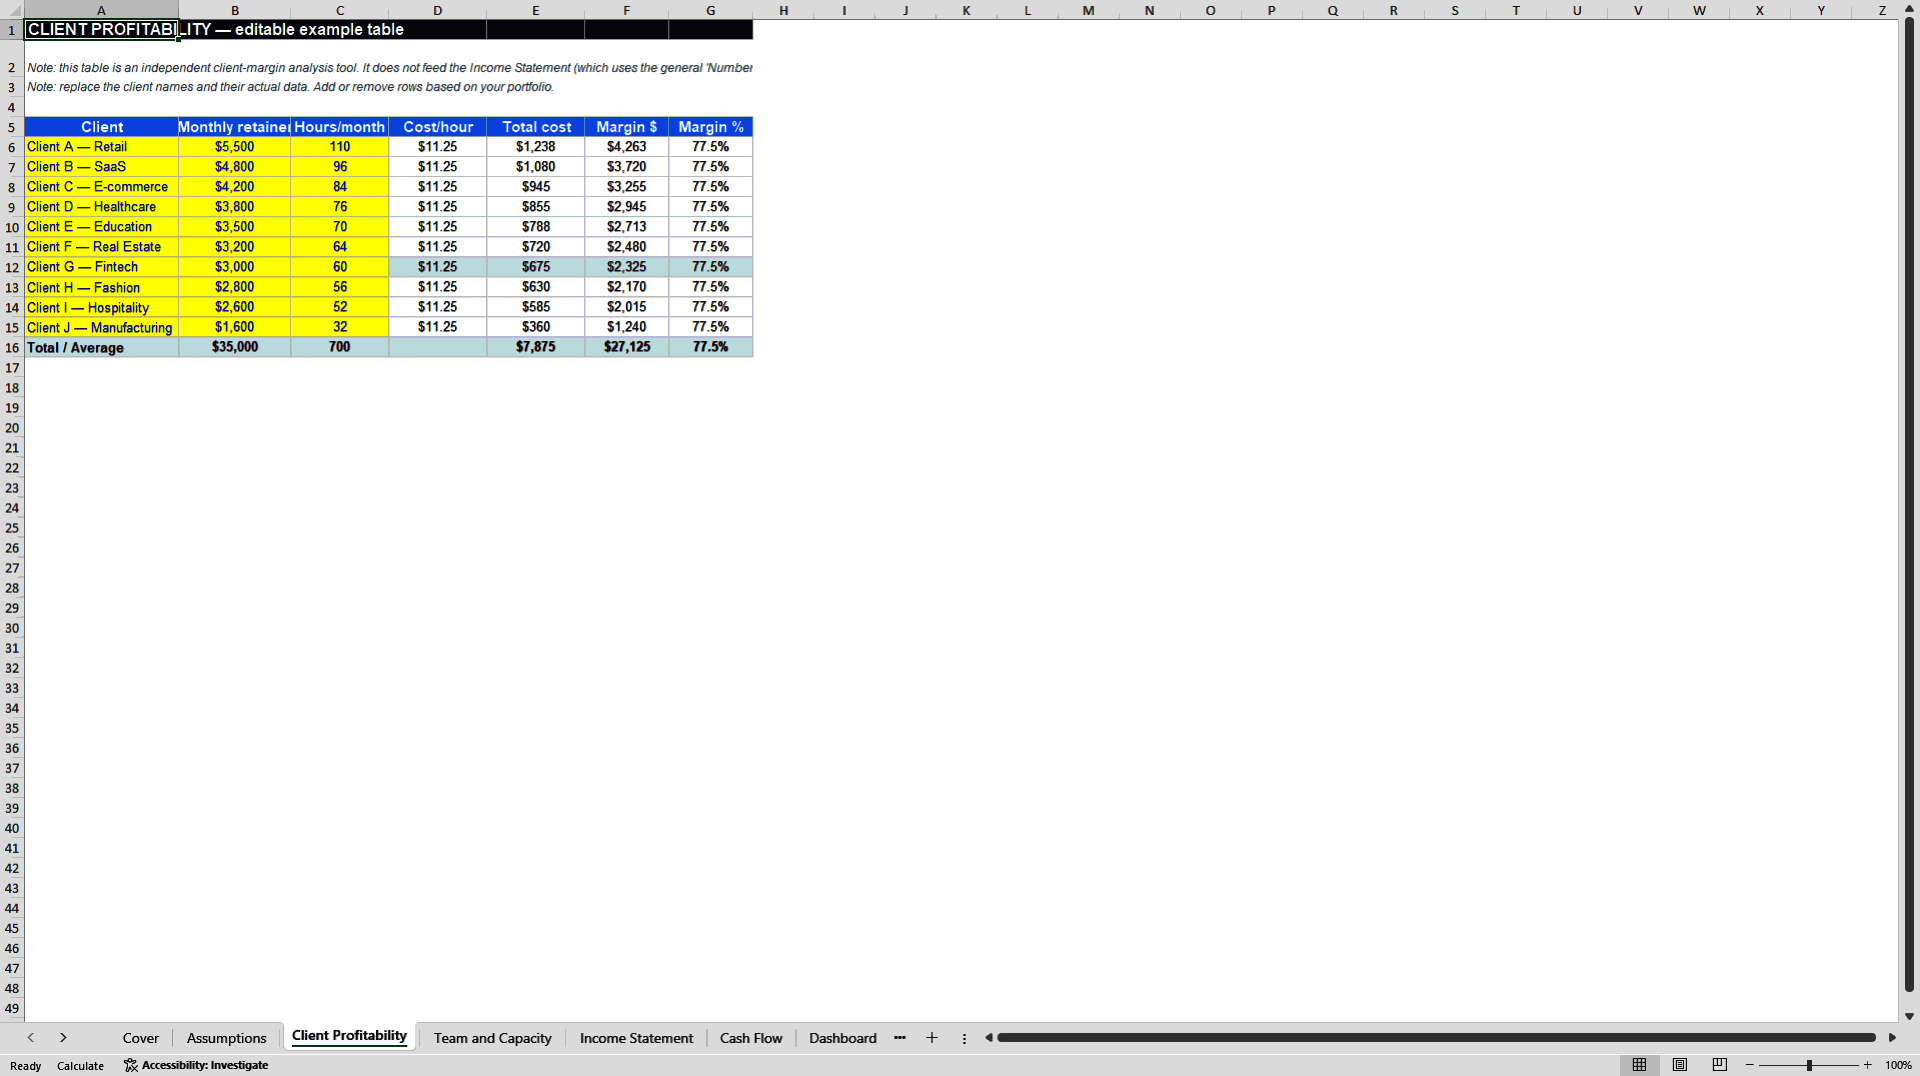
- Calculates client-by-client margin and identifies which accounts are actually worth the team hours they consume.
- Tracks team utilization against capacity with an automatic overcapacity alert.
- Compares actual client portfolio revenue against the top-down five-year target, showing the gap at a glance.
FINANCIAL MODELING EXCEL DESCRIPTION
Agency and consulting firm owners can usually state their total monthly revenue without hesitation, but far fewer can say with confidence which specific clients are actually profitable once the real hours their team burns are accounted for – or whether the team itself is headed toward overcapacity or sitting underutilized. This template answers both questions from a single connected workbook.
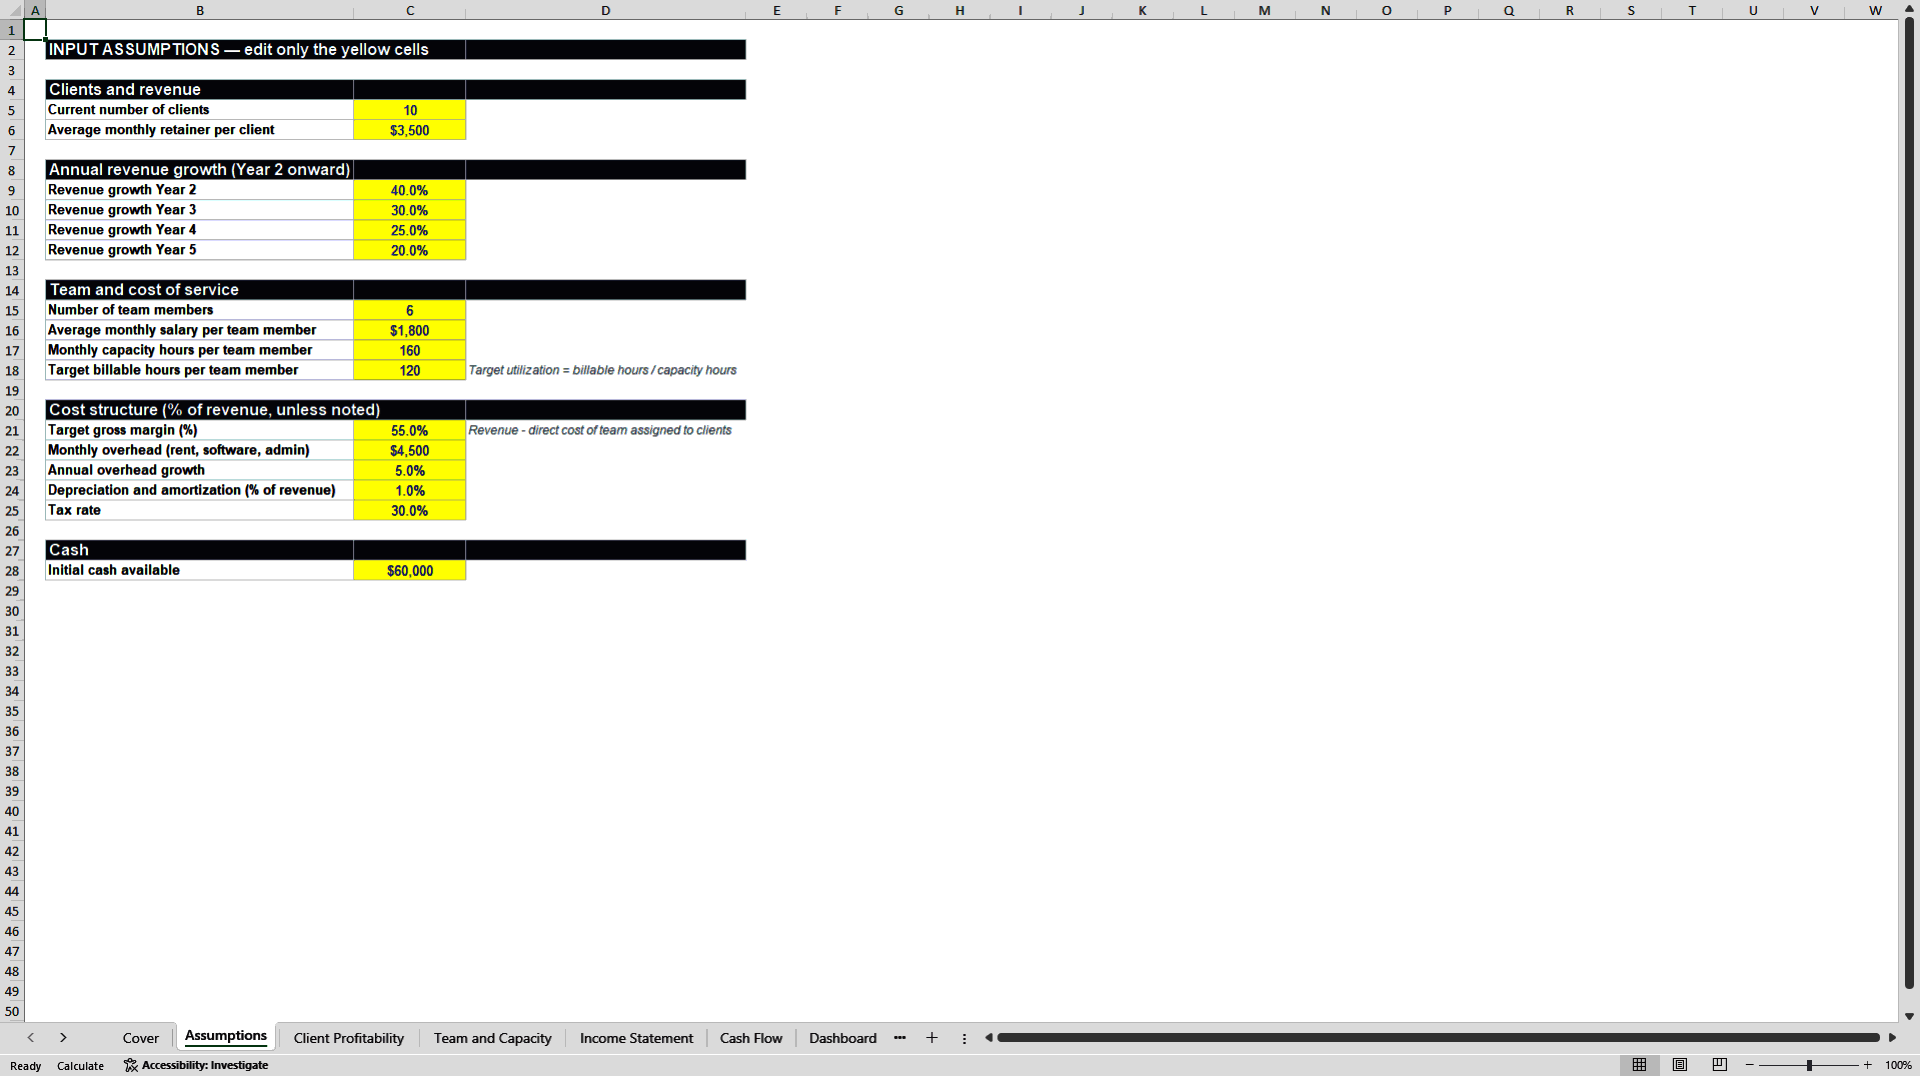
The model opens with an Assumptions worksheet consolidating team size, average salary, capacity hours, target billable hours, target gross margin, and overhead. A dedicated Client Profitability worksheet then builds a bottom-up, client-by-client view: monthly retainer, hours consumed, blended cost per hour, and resulting margin in both dollar and percentage terms for each client in the roster. This is deliberately kept independent from the top-down five-year projection, so an owner can compare macro revenue targets against day-to-day operating reality without the two numbers masking each other.
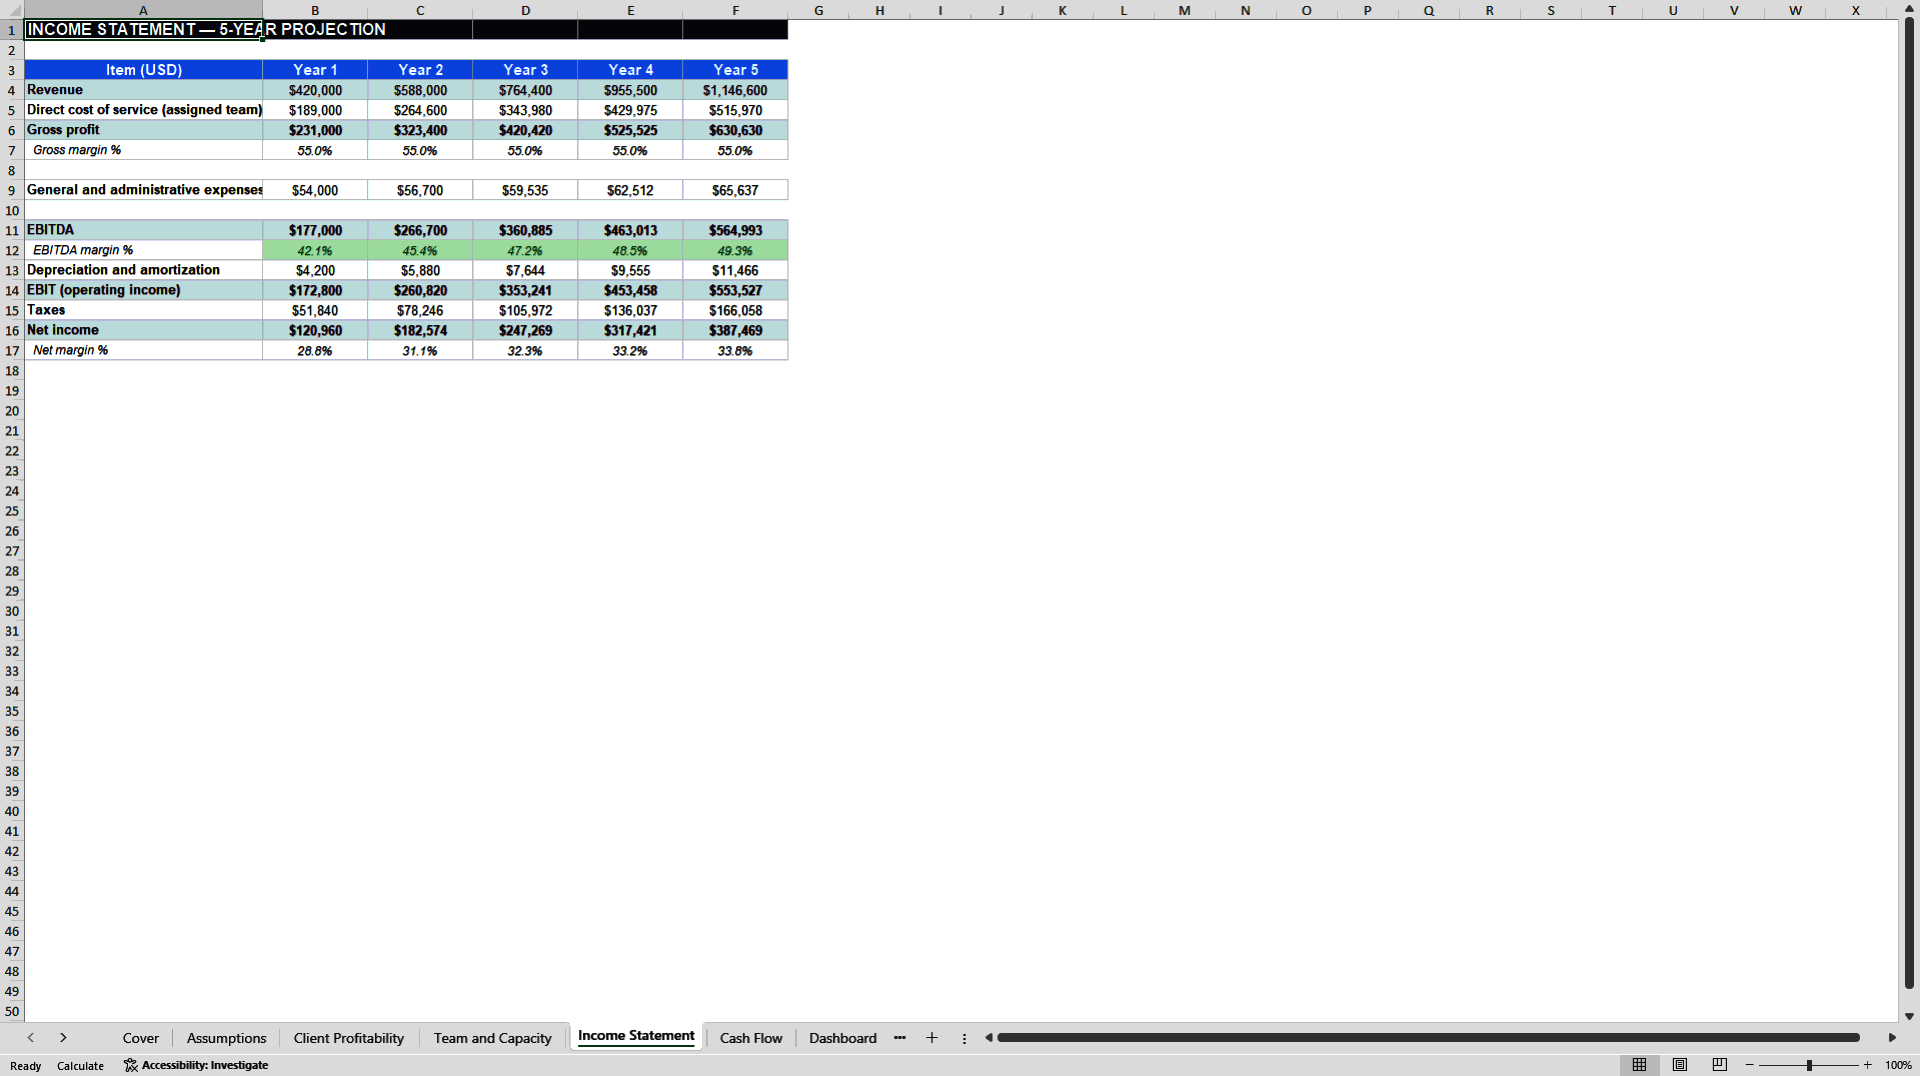
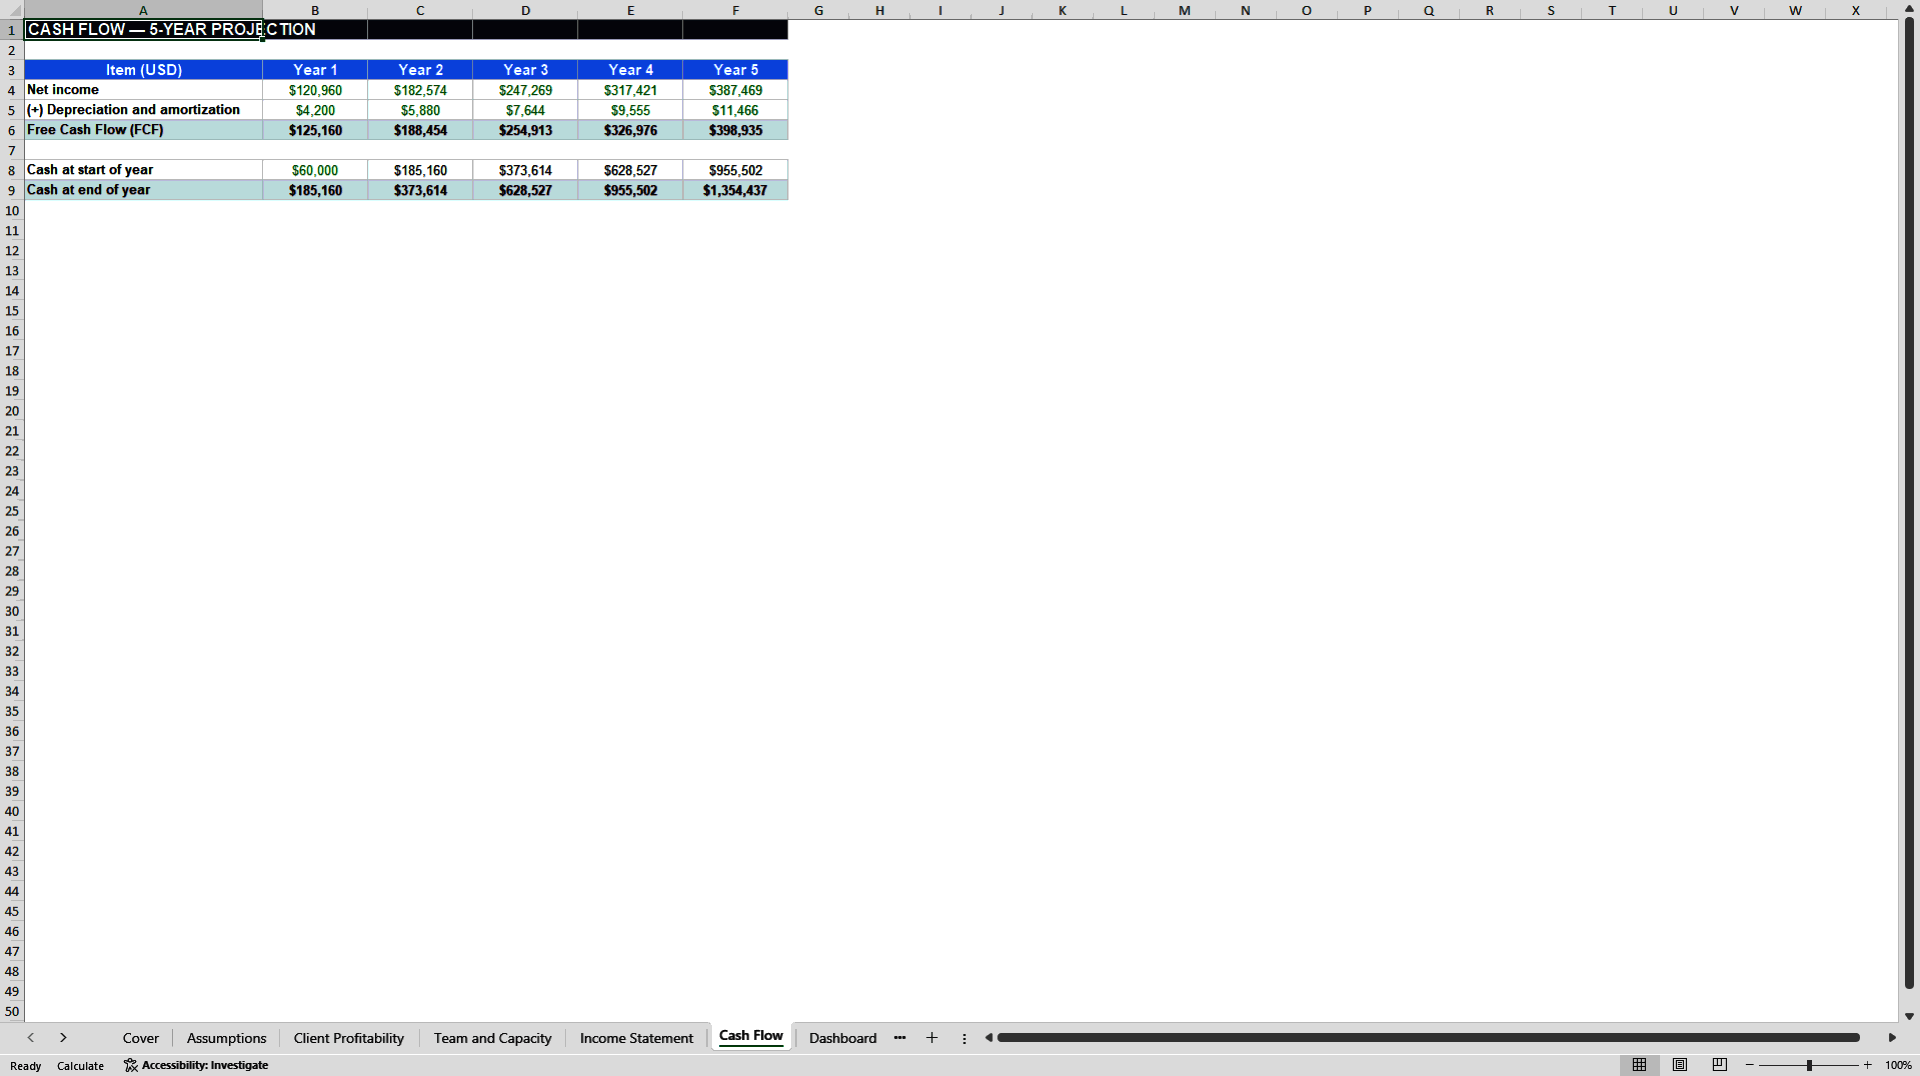
The Team and Capacity worksheet compares total monthly capacity against actual billed hours, calculating utilization against both a target rate and current bookings, with a built-in alert if the team crosses full capacity. The Income Statement and Cash Flow worksheets then project five years forward from the general growth assumptions, producing revenue, EBITDA, margin trend, and ending cash balance.
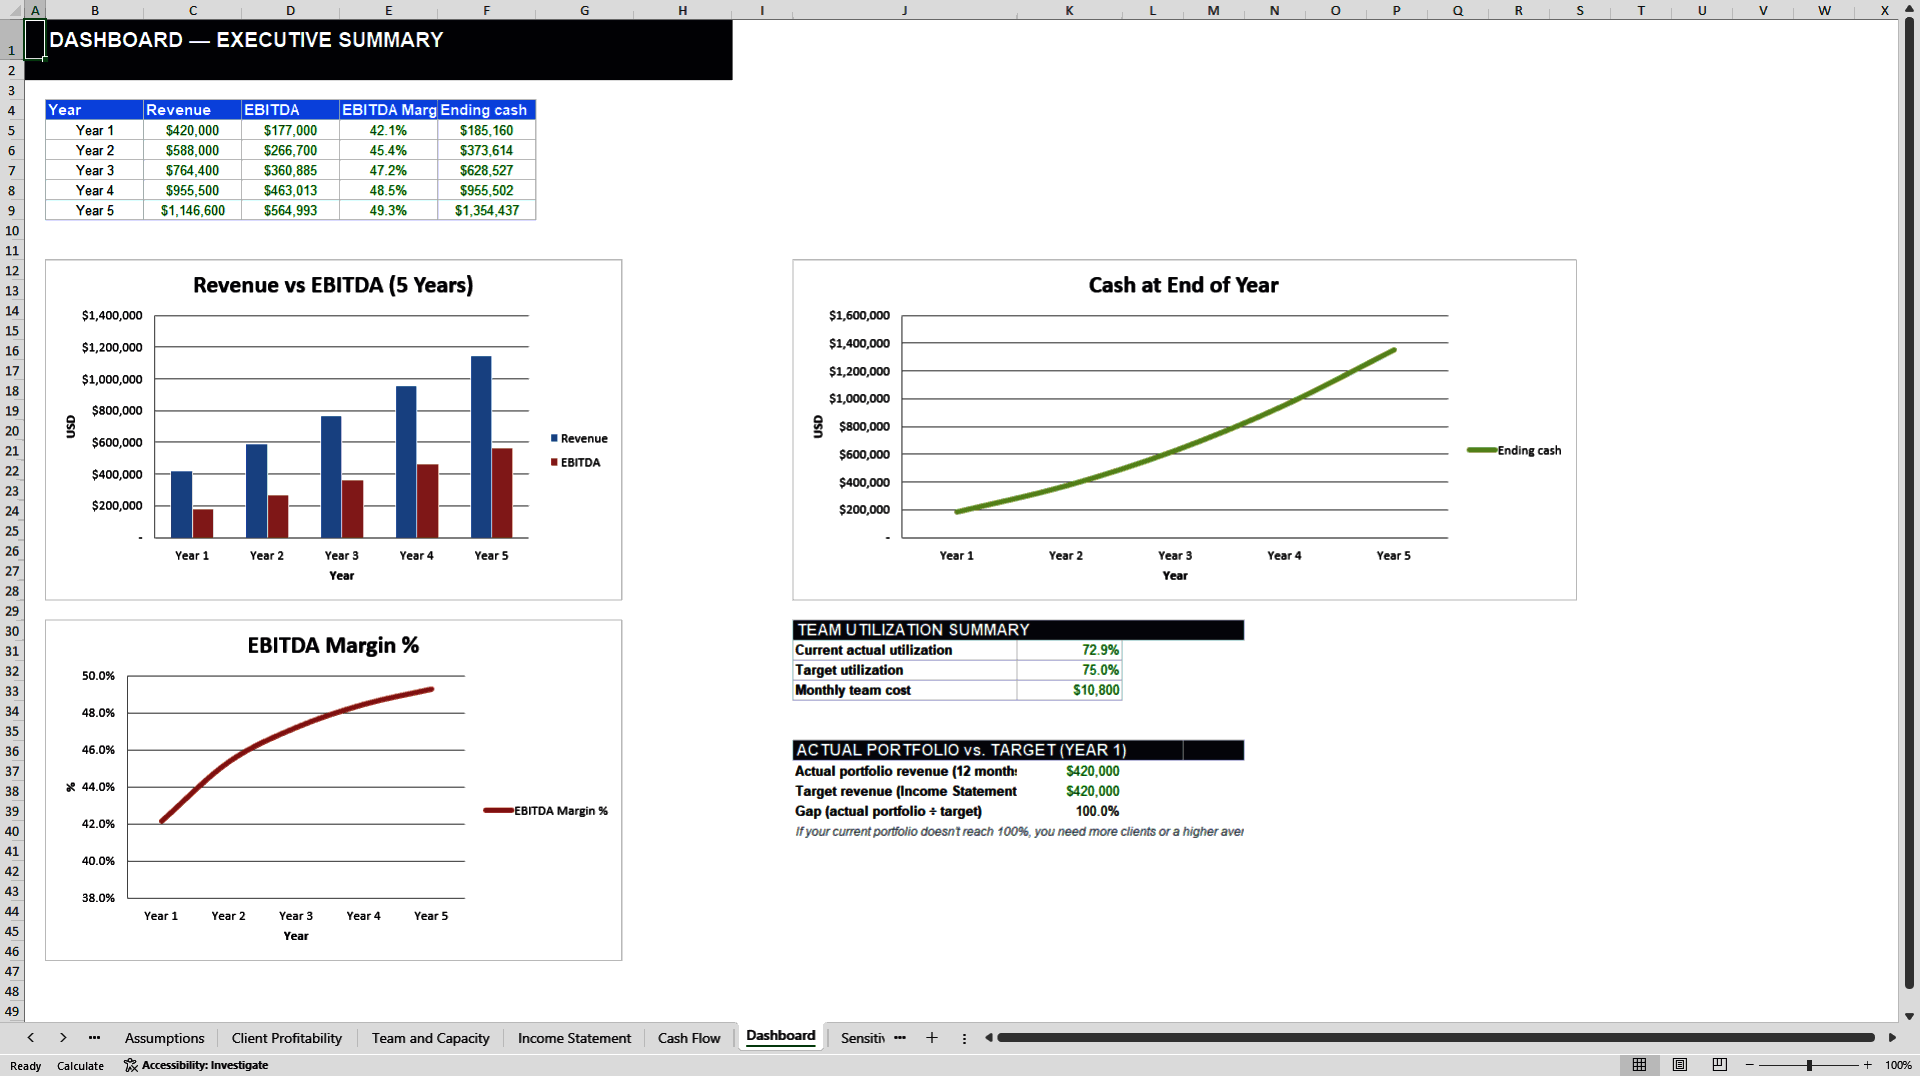
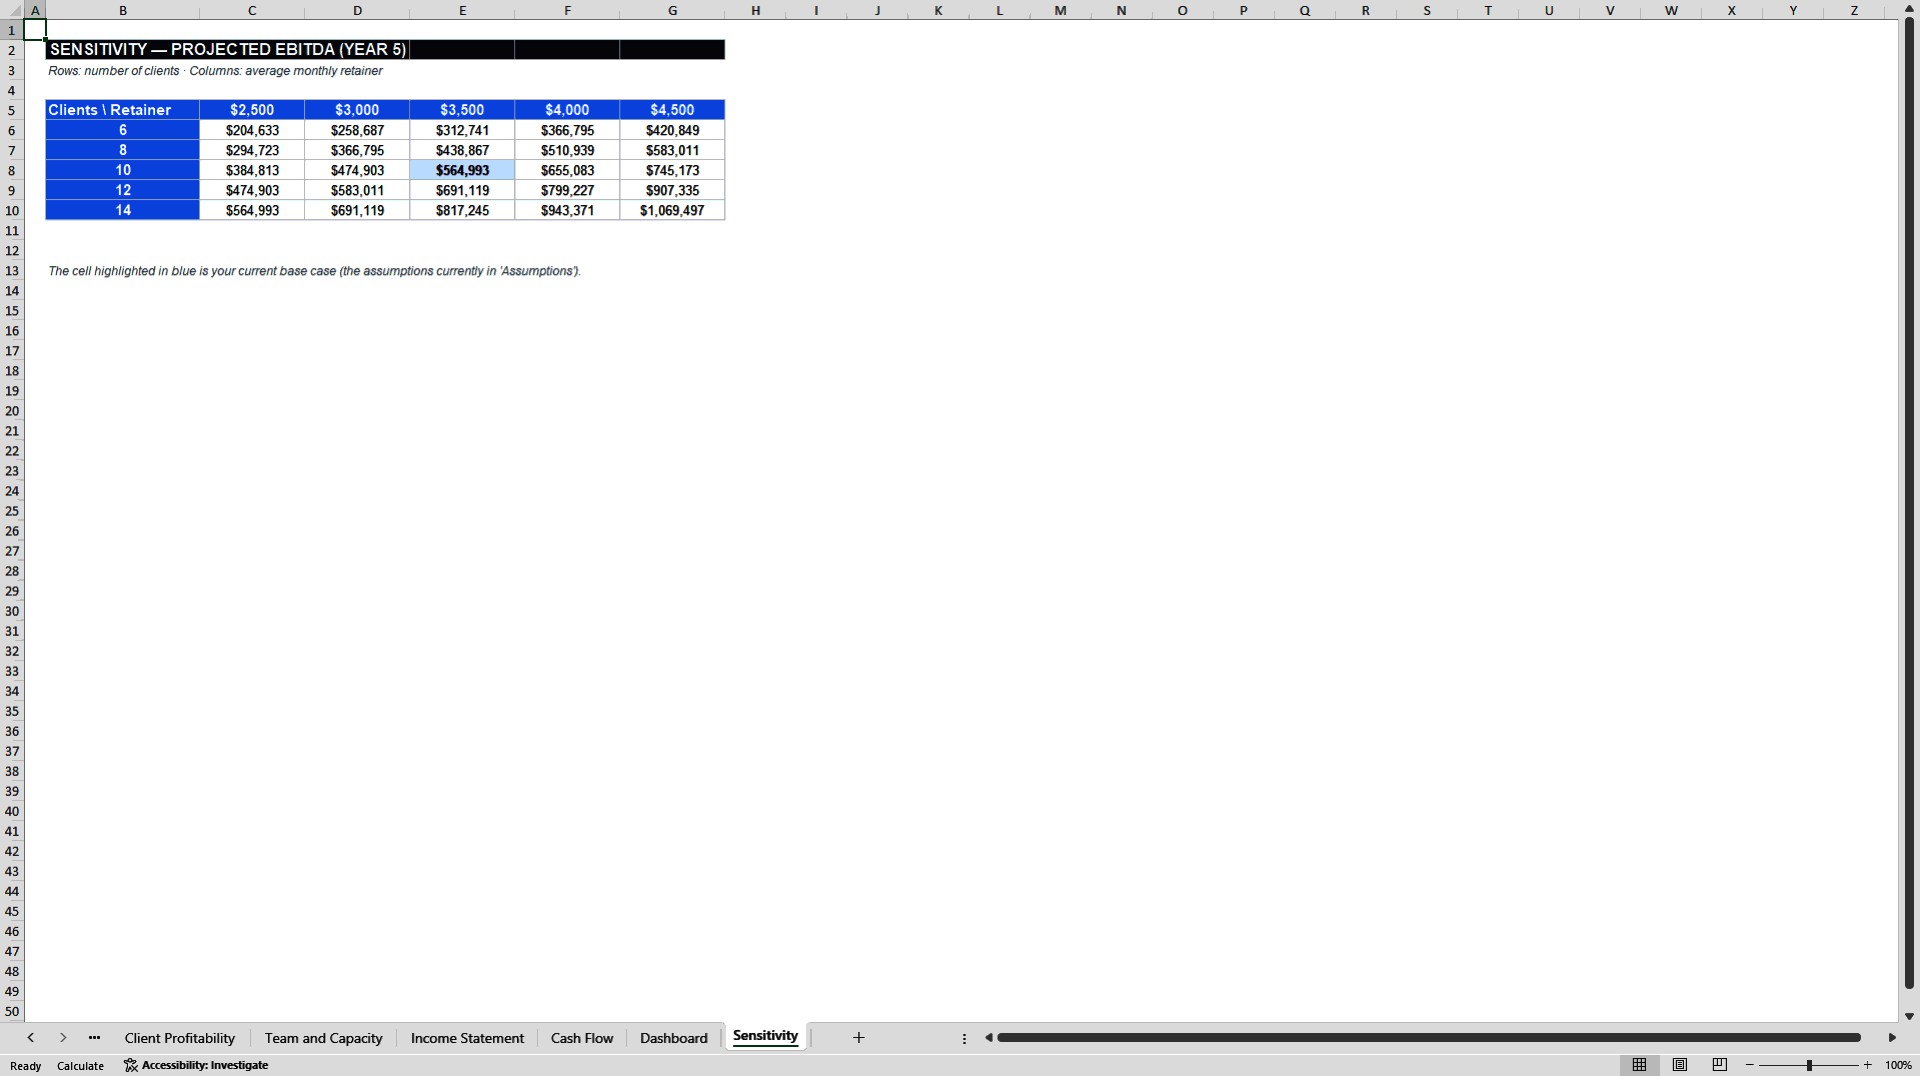
An Executive Dashboard consolidates the five-year projection alongside a direct comparison of the client roster's actual revenue against the top-down target for Year 1, making the gap between plan and current book of business immediately visible. A dedicated Sensitivity worksheet stress-tests projected Year 5 EBITDA across a five-by-five grid of client count and average retainer assumptions.
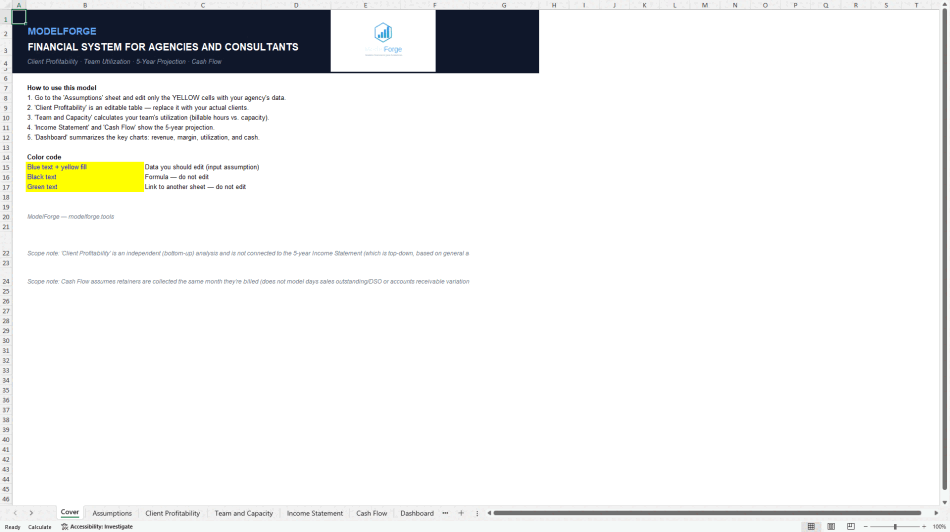
All formula cells are protected against accidental edits, while input cells remain fully editable and color-coded. The workbook is provided in both English and Spanish, is compatible with Excel 2016 and later as well as Google Sheets, and contains no macros, external links, or embedded data of any kind.
Got a question about the product? Email us at support@flevy.com or ask the author directly by using the "Ask the Author a Question" form. If you cannot view the preview above this document description, go here to view the large preview instead.
Source: Best Practices in Financial Modeling, Shared Services Excel: Agency Financial System: Client Profitability and Team Utili Excel (XLSX) Spreadsheet, g62881025e97




























