
 Click main image to view in full screen.
Daycare Center Model: State Ratio Staffing and SBA DSCR – Excel XLSX
Excel (XLSX) + supplemental PDF


BENEFITS OF THIS DOWNLOADABLE EXCEL DOCUMENT
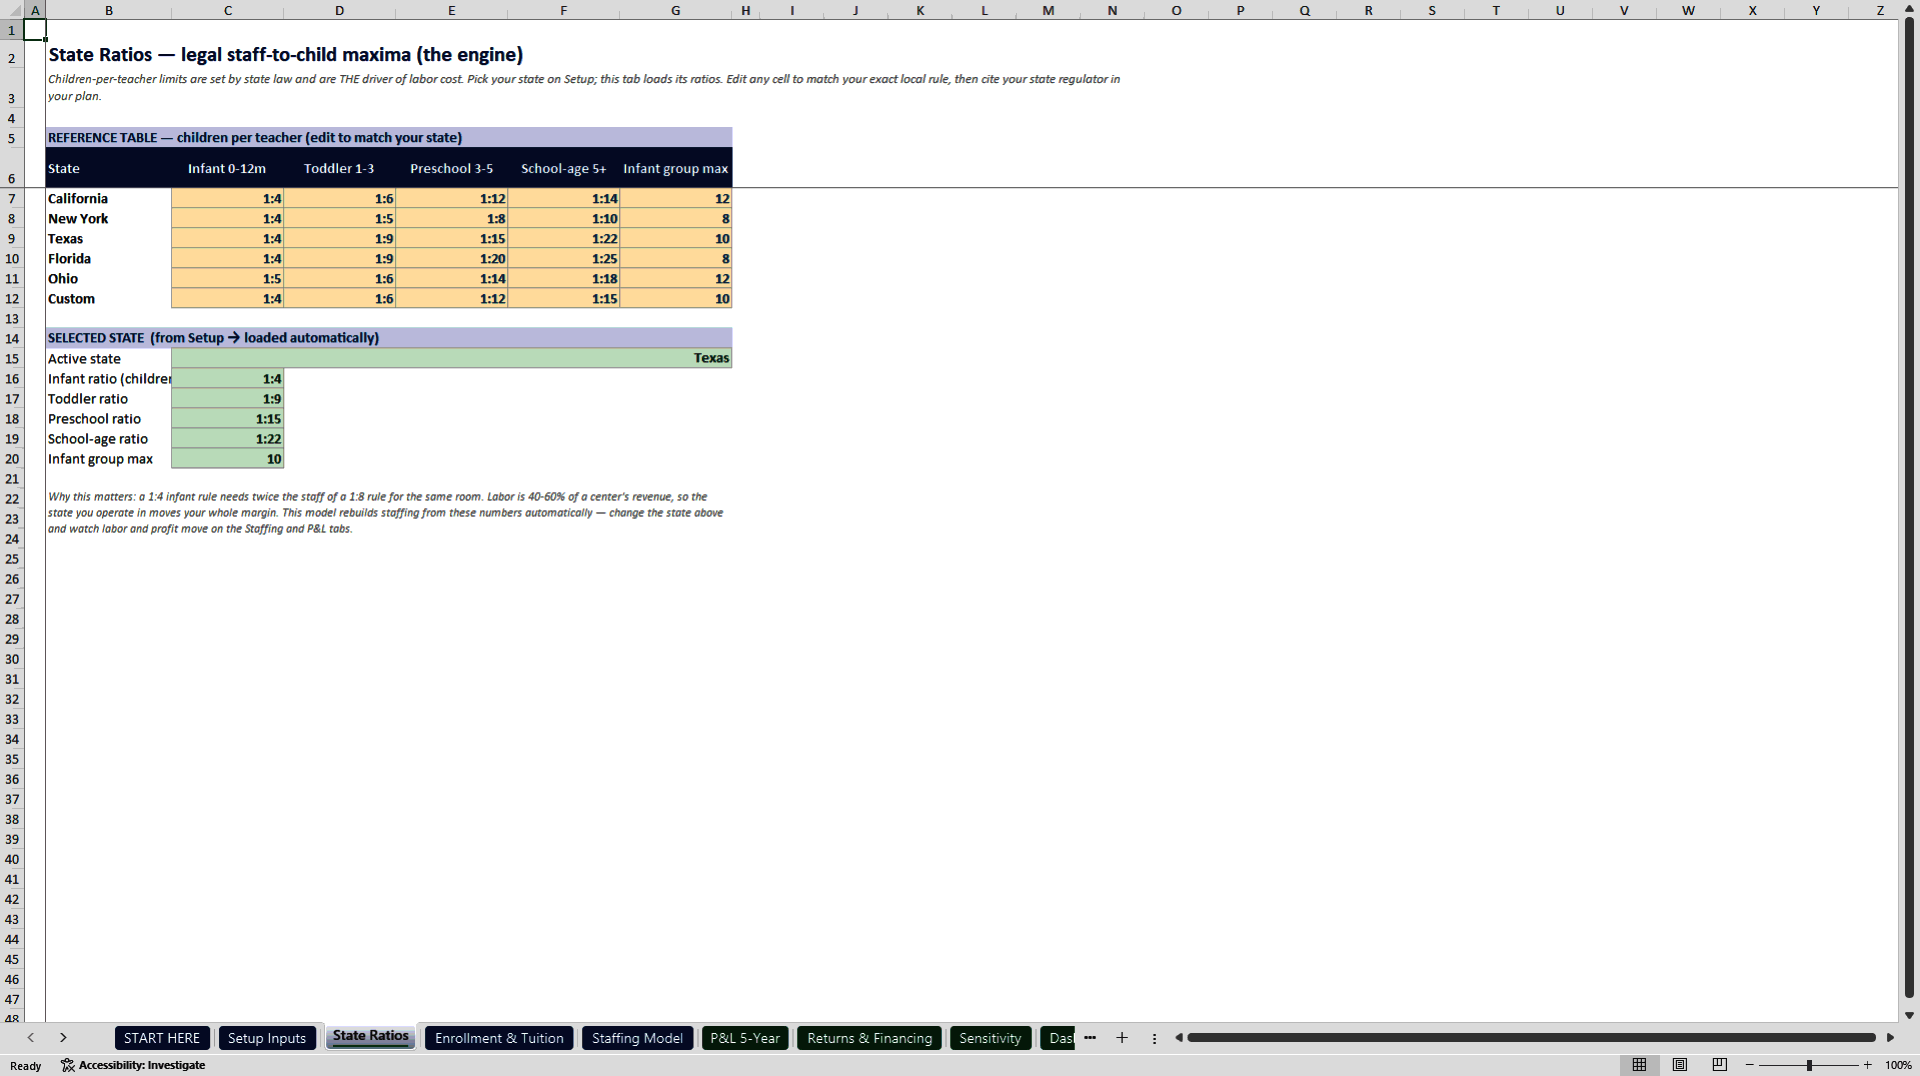
- Required teachers are computed from the law: enrolled children divided by your state's legal ratio, rounded up per room, for infants, toddlers, preschool and school-age, so switching states moves the margin.
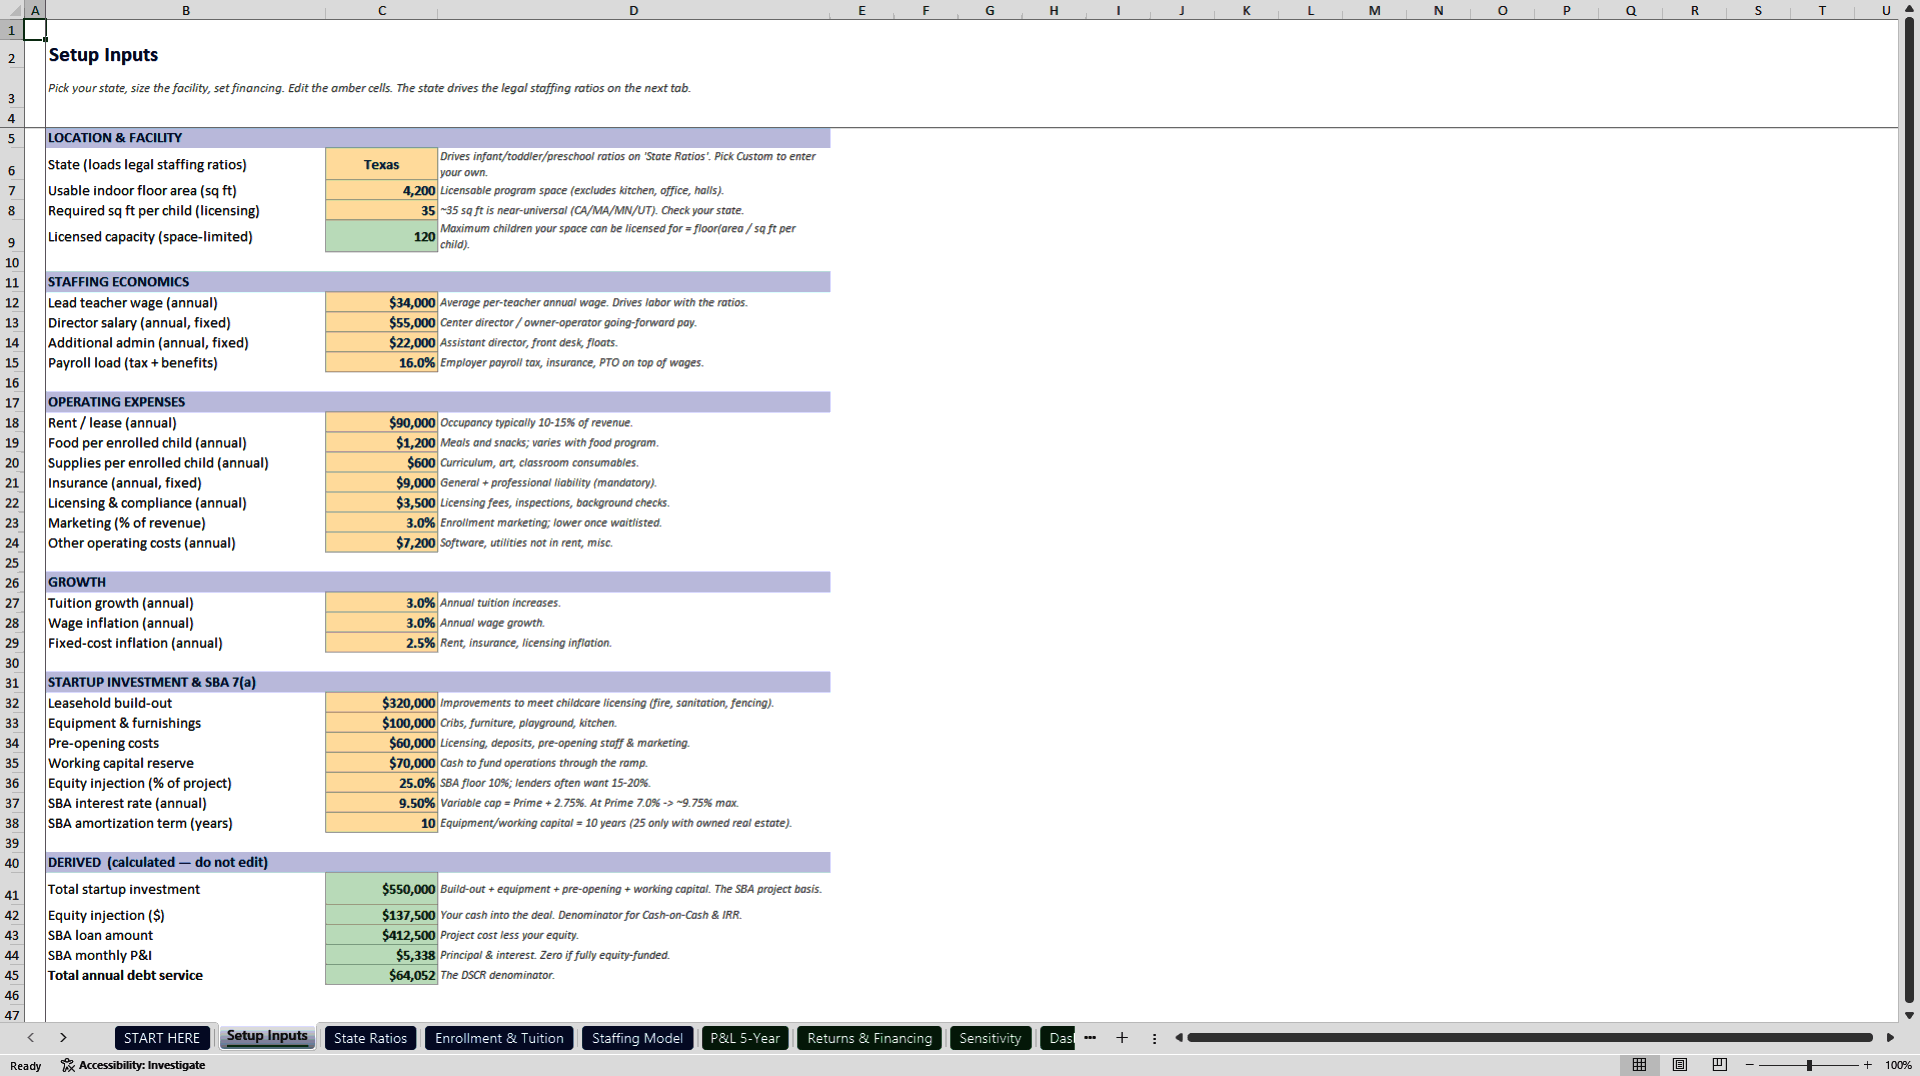
- Licensed capacity comes from your space, usable square footage divided by the per-child minimum, so the centre is sized to what it can actually be licensed for rather than to hoped-for rooms.
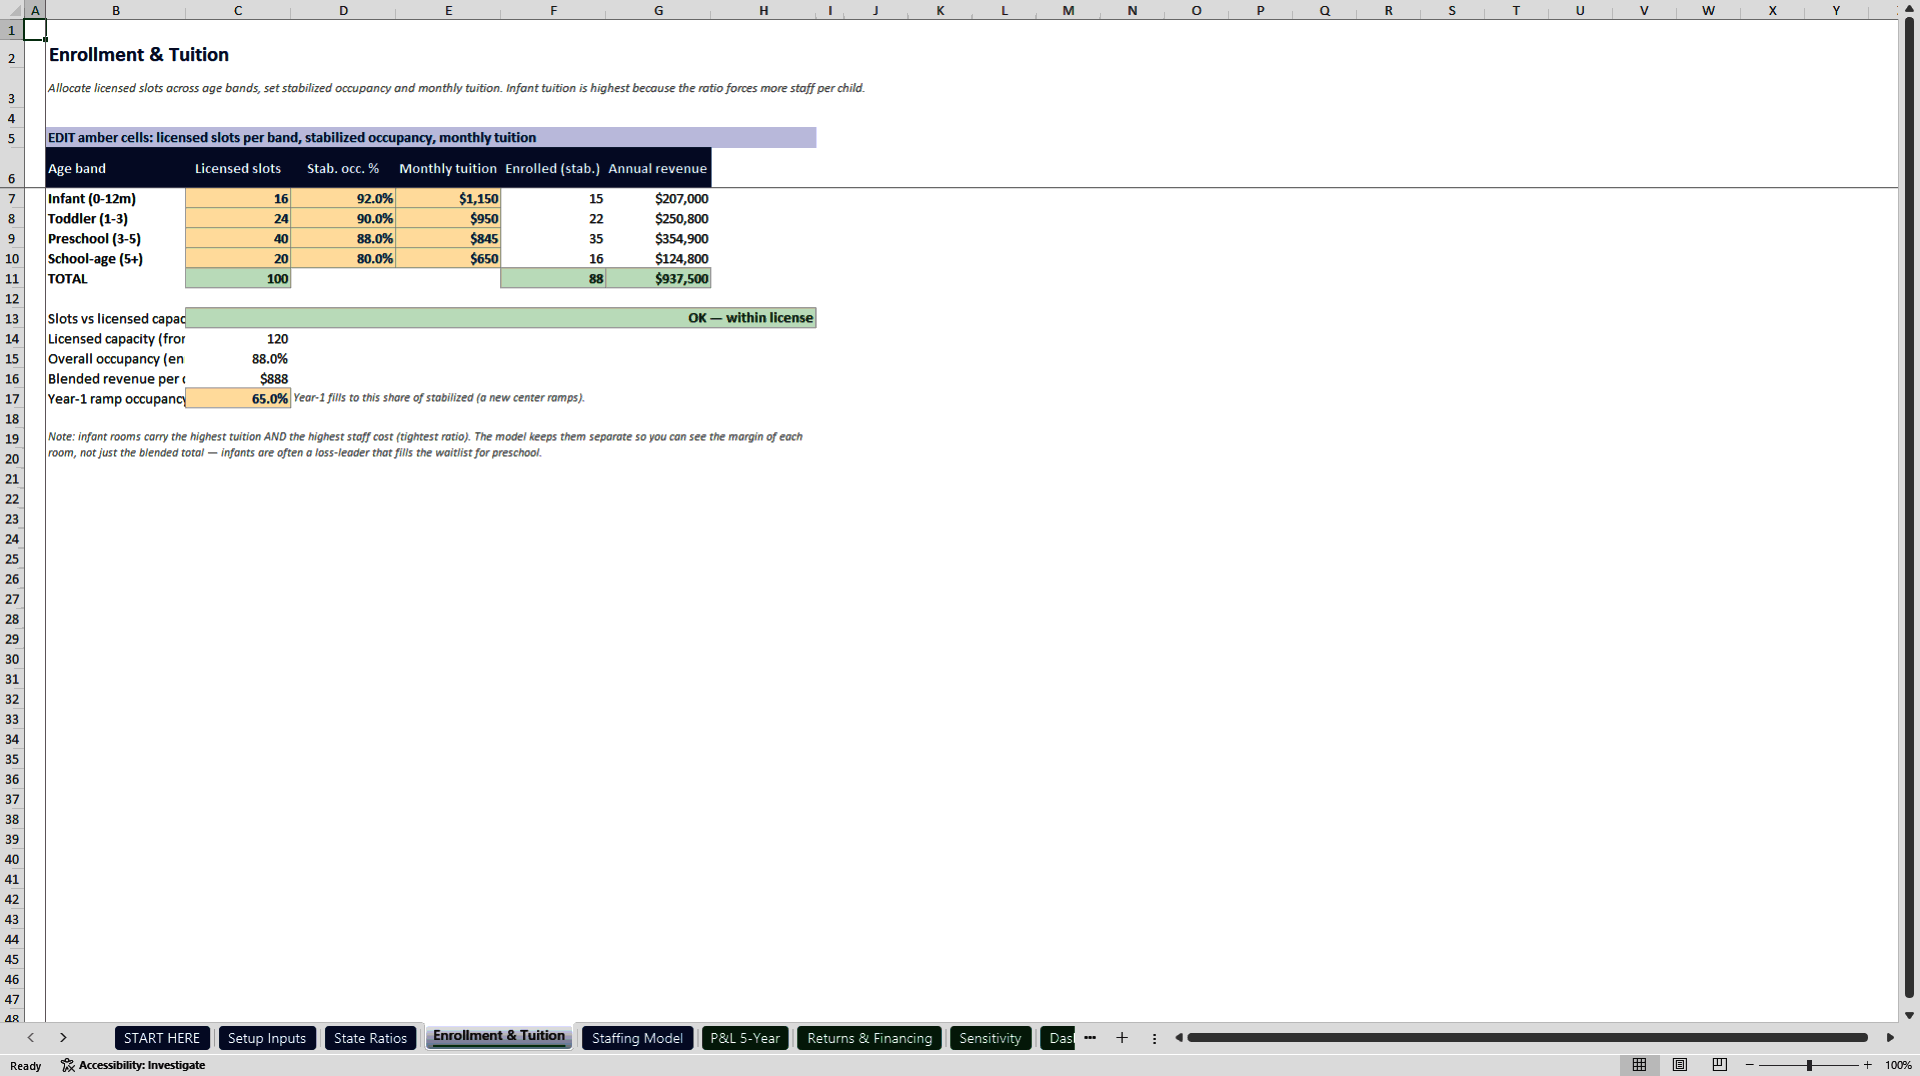
- Revenue is split by age band with its own slots, occupancy and tuition, and a Year-1 enrolment ramp feeds DSCR, breakeven occupancy and an occupancy-by-tuition sensitivity grid.
CHILDCARE EXCEL DESCRIPTION
Labor is 40-60% of a childcare centre's revenue, and your state's law sets it. This model builds staffing from those legal ratios instead of asking you to guess a single teacher-to-child number, which is the input every other daycare template leaves to the user and which quietly decides whether the centre works.
Pick a state and the model loads its legal infant, toddler and preschool ratios, then computes the minimum staff the law requires for your enrolment: required teachers equal enrolled children divided by the state ratio, rounded up per room, for infants, toddlers, preschool and school-age. Switch states and the whole margin moves. Licensed capacity is derived from your space as well, as usable square footage divided by the per-child minimum, so you size the centre to what you can actually be licensed for rather than to the rooms you hope to fill.
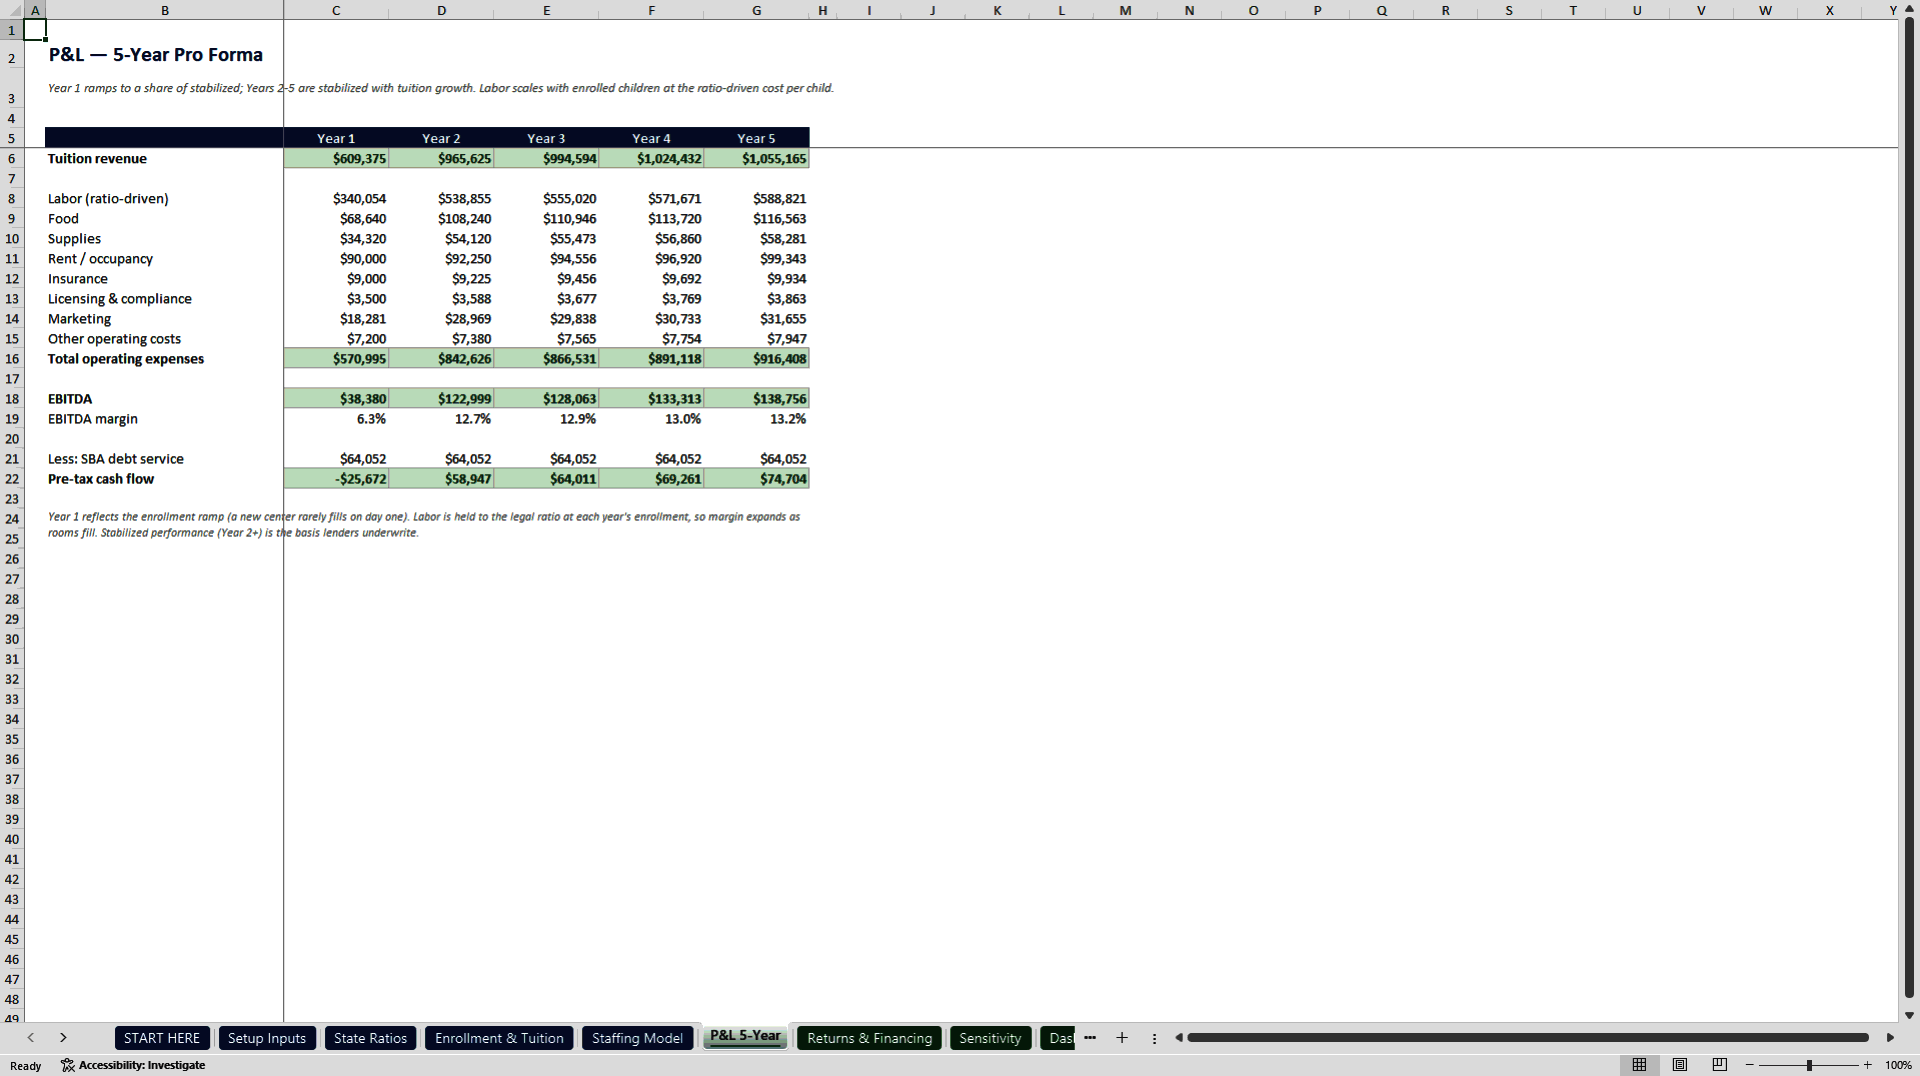
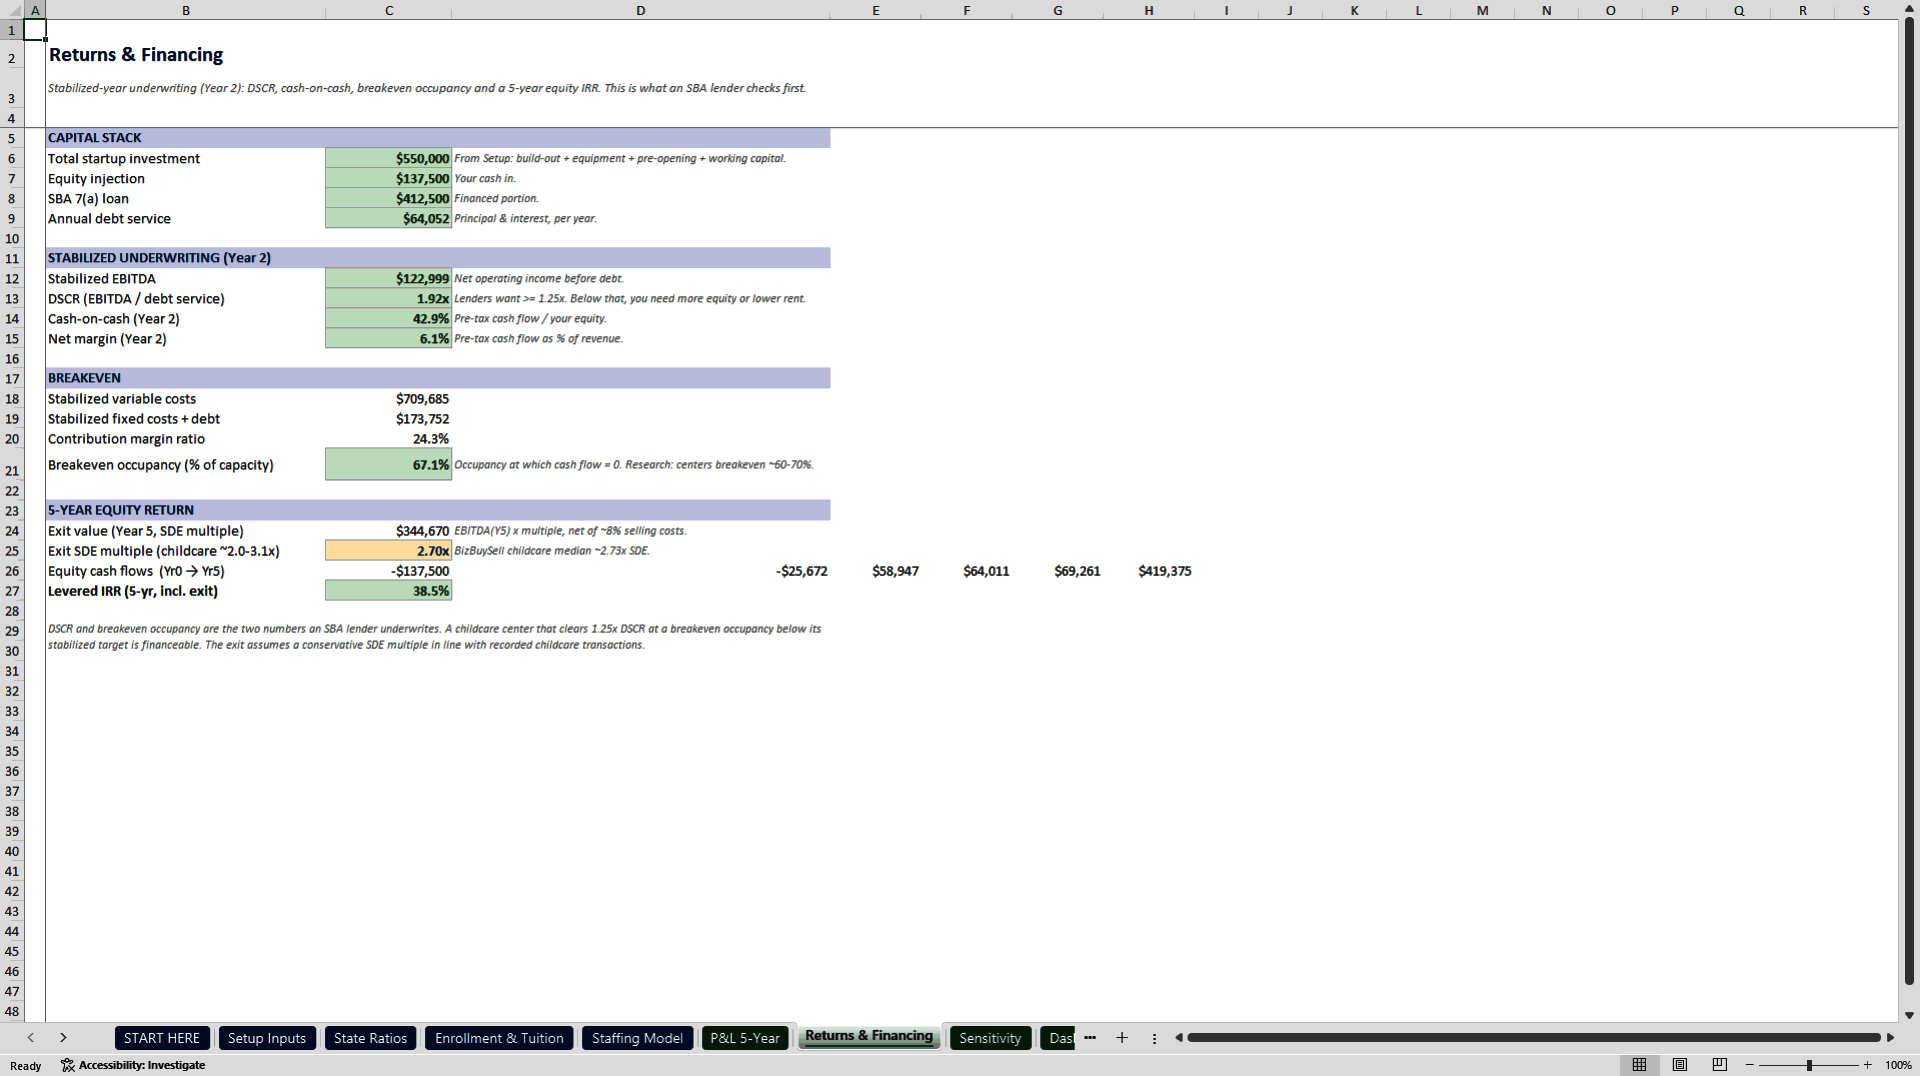
Revenue is built by age band, with separate slots, occupancy and tuition per room, because infants cost the most to staff and also charge the most. A Year-1 enrolment ramp carries the centre from opening toward stabilised occupancy. On top sits a five-year P&L covering labor, food, supplies, rent, insurance, licensing and marketing, with EBITDA and margin, and then the numbers an SBA 7(a) lender checks first: DSCR, cash-on-cash, breakeven occupancy and a five-year IRR. An occupancy-by-tuition sensitivity grid shows how much softness the centre can absorb before it stops penciling.
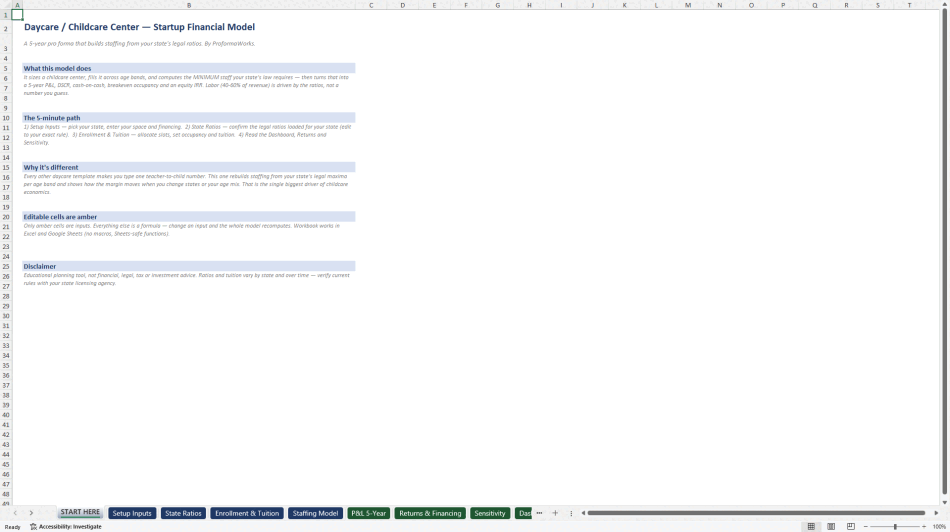
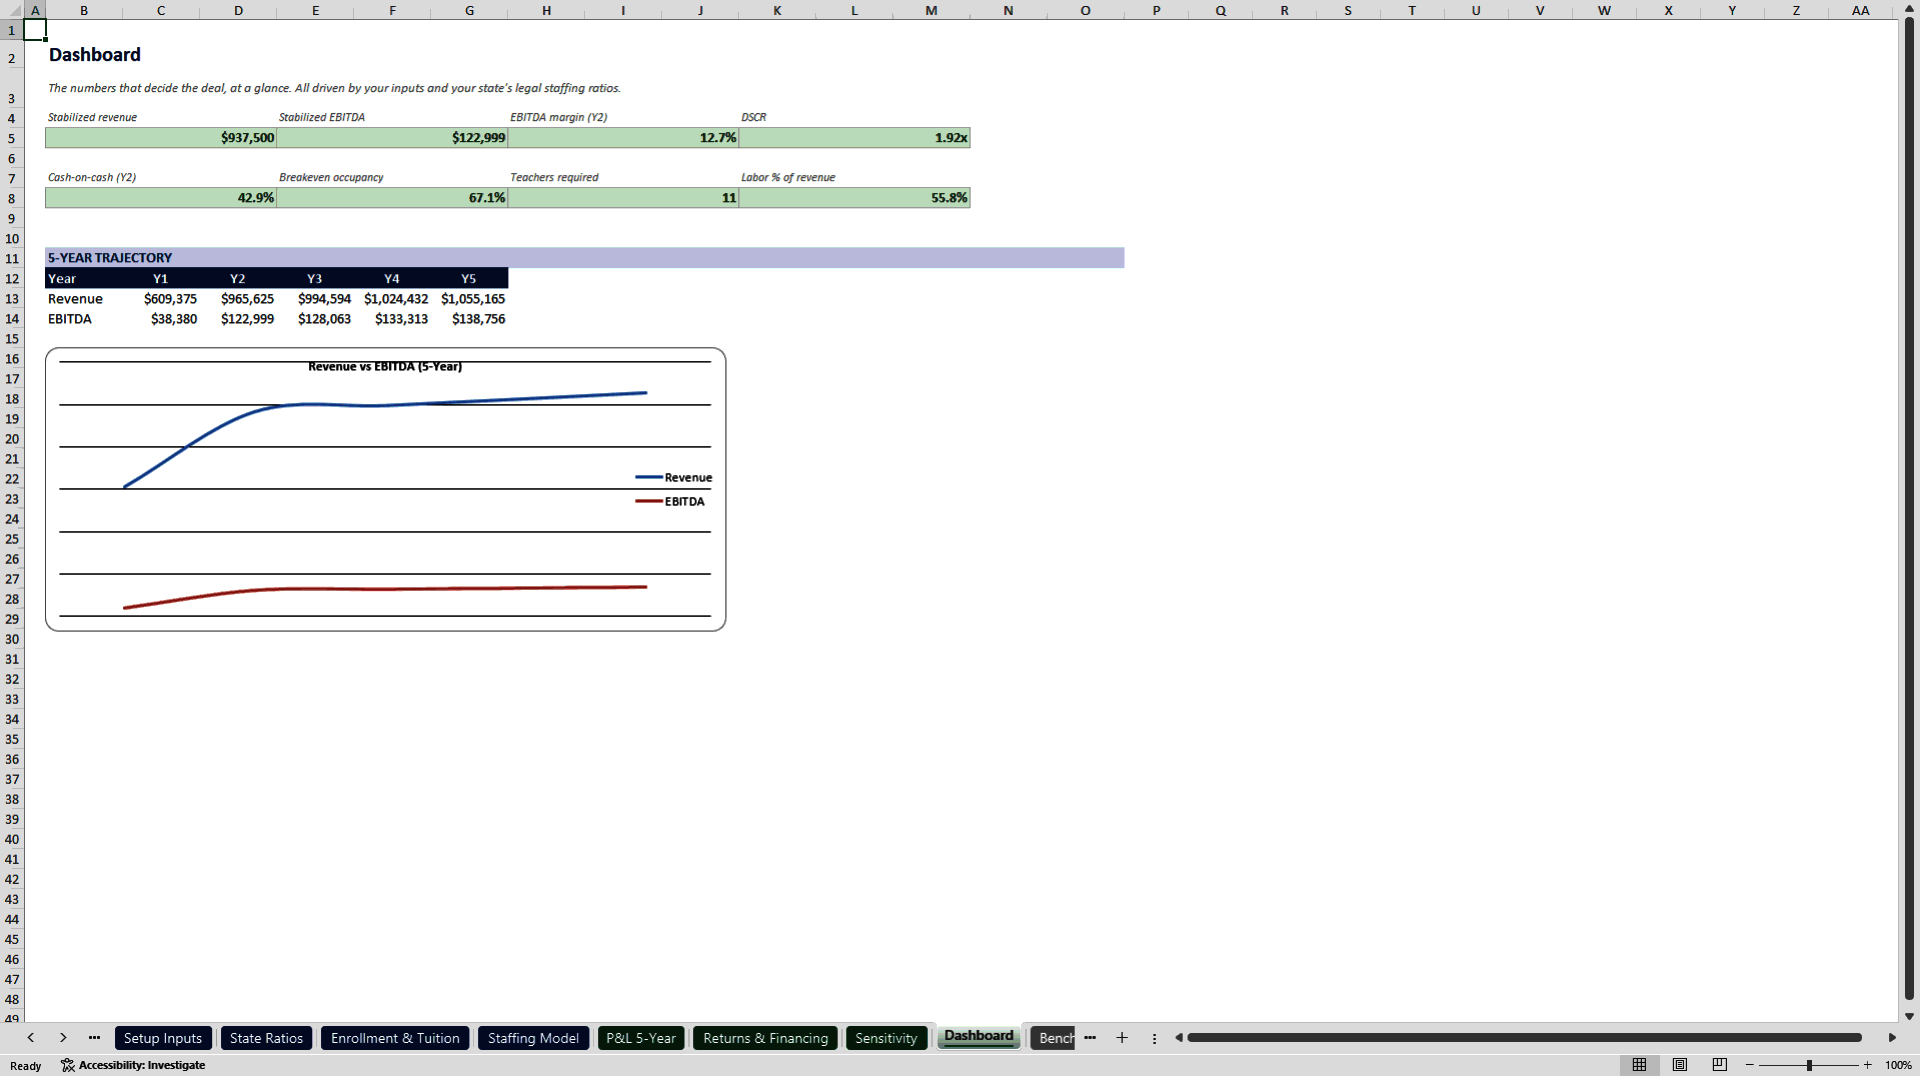
The file is a 10-sheet Excel workbook that also works in Google Sheets, with no macros, add-ins or external links. It ships with a 17-page PDF user guide covering quick start, a sheet-by-sheet walkthrough, how the state-ratio staffing engine works, how a lender reads your DSCR and breakeven occupancy, and a full FAQ. A START HERE sheet produces a first projection in minutes with only amber cells to fill. A State Ratios sheet carries editable presets for California, New York, Texas, Florida and Ohio, plus a Custom row so you can match your exact local rule. A Dashboard presents KPI cards and a five-year revenue-versus-EBITDA chart formatted to share with a lender or a partner, and a Benchmarks sheet collects sourced 2024-26 ratios, tuition, cost structure and SBA terms, with the state regulators cited in the guide.
Every formula is machine-verified: the full calculation graph is recomputed by three independent engines including Excel itself before release, and the staffing engine is tested against each state's rules.
What the model does not do is decide the rules for you. Staffing ratios, square-footage requirements and tuition vary by state and change over time, and the presets are a starting point to be confirmed with your state licensing agency. It is an educational planning tool, not financial, legal, tax or investment advice, and every assumption should be validated against your own market and your own licensing rules before you rely on any number.
Got a question about the product? Email us at support@flevy.com or ask the author directly by using the "Ask the Author a Question" form. If you cannot view the preview above this document description, go here to view the large preview instead.
Source: Best Practices in Childcare, Integrated Financial Model Excel: Daycare Center Model: State Ratio Staffing and SBA DSCR Excel (XLSX) Spreadsheet, ProformaWorks
ABOUT THE AUTHOR
ProformaWorks builds acquisition-grade financial models for Main Street and lower-middle-market businesses - the kind of deal financed with an SBA 7(a) loan or a small commercial facility.
Every model answers one question: does this deal pencil at the bank? That means SDE or NOI rebuilt from the seller's own numbers, the add-backs a lender will and will not accept, a debt-service
... [read more]
Ask the Author a Question
You must be logged in to contact the author.




























