

 Click main image to view in full screen. Unlock all 9 preview images:
Data Center Project Finance Model: PUE, Power & DSCR Debt – Excel XLSX
Excel (XLSX) + supplemental PDF


BENEFITS OF THIS DOWNLOADABLE EXCEL DOCUMENT
- Grid connection divided by design PUE gives the IT load you can actually sell - a hard ceiling the contract book and the facility load are tested against on every one of the twenty operating years.
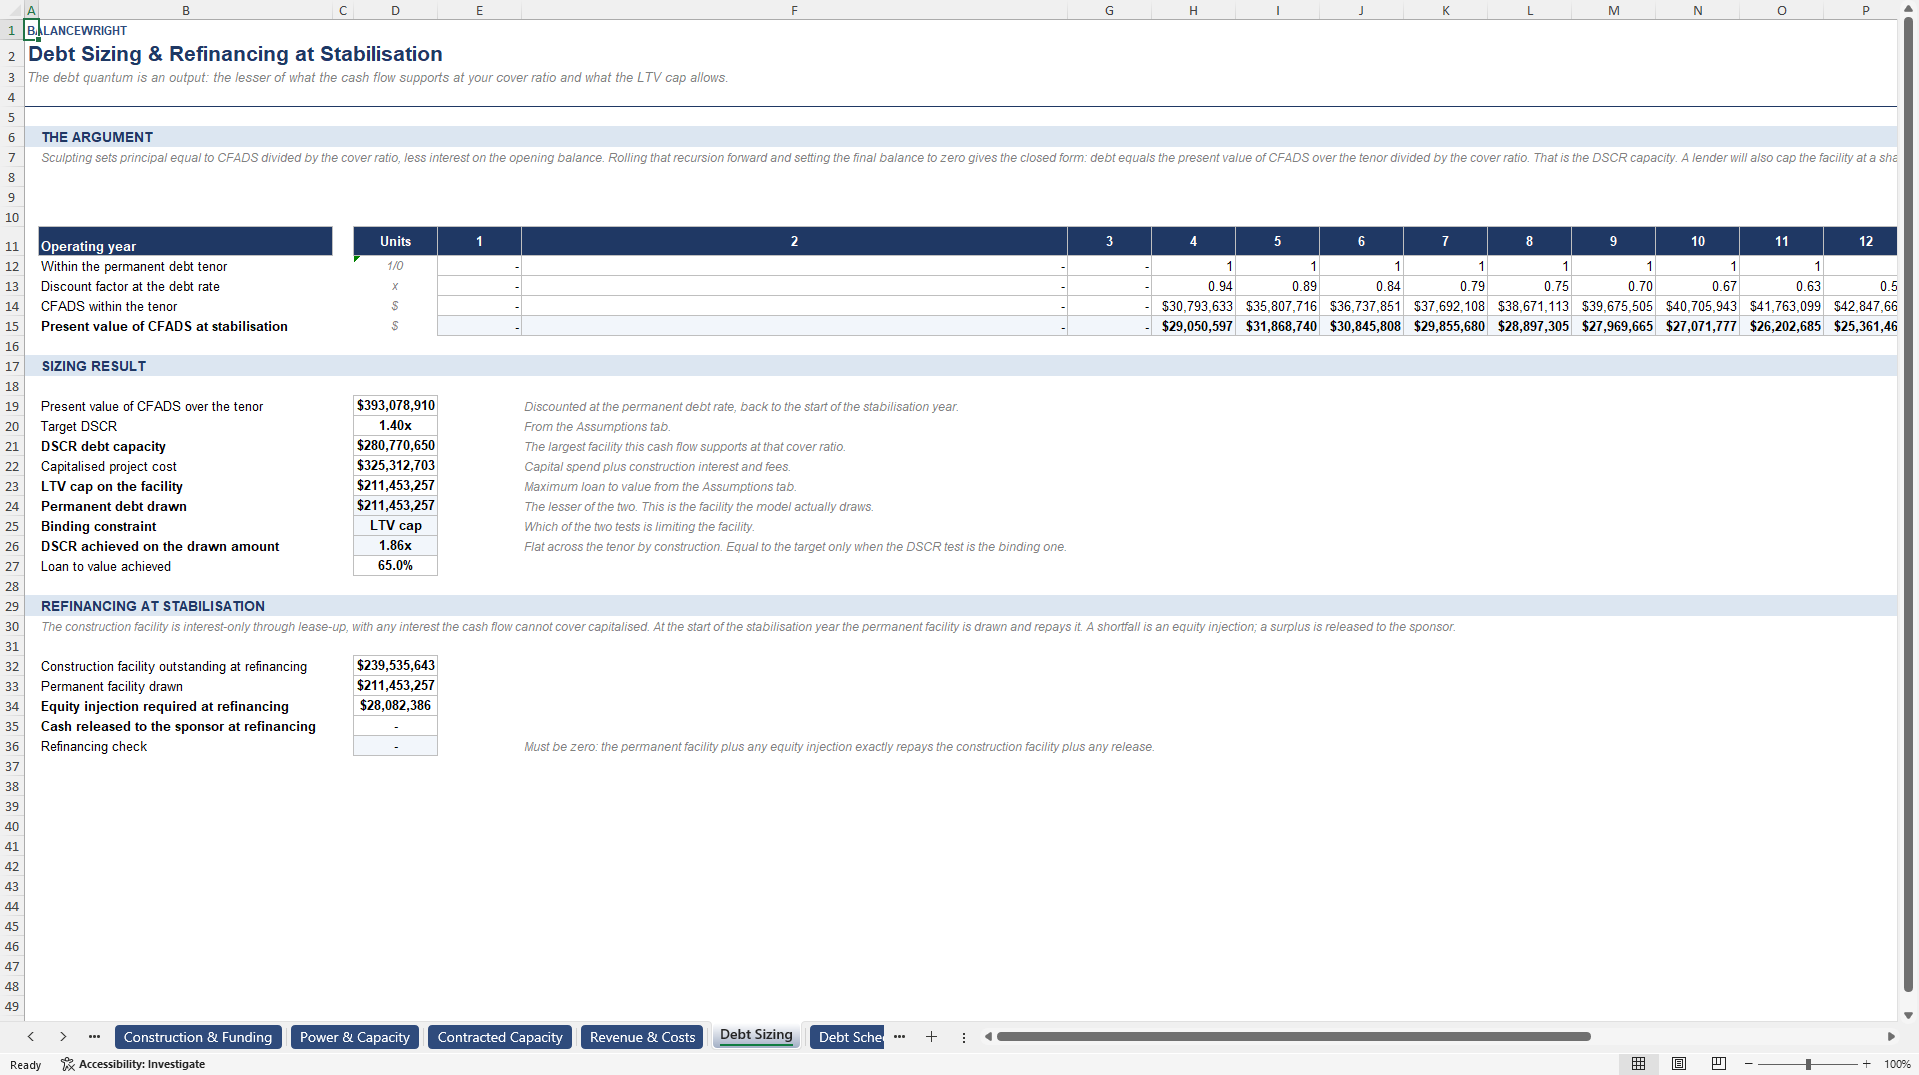
- Debt is an output, not an input: DSCR capacity computed in closed form next to the loan-to-value cap, the lesser of the two drawn, and the binding constraint named in words.
- Fourteen integrity checks, four of which no floor-area model can run: the power balance, headroom against the grid connection, the capacity ceiling and the contract book bridge.
FINANCIAL MODELING EXCEL DESCRIPTION
Almost every data centre model in circulation is a real estate model with the words "data centre" on the cover. It takes square feet, applies a rent, escalates it, subtracts an operating cost ratio and capitalises the result. That works for an office block. It does not work here, because this asset is not constrained by floor area. It is constrained by the megawatts the utility has agreed to deliver.
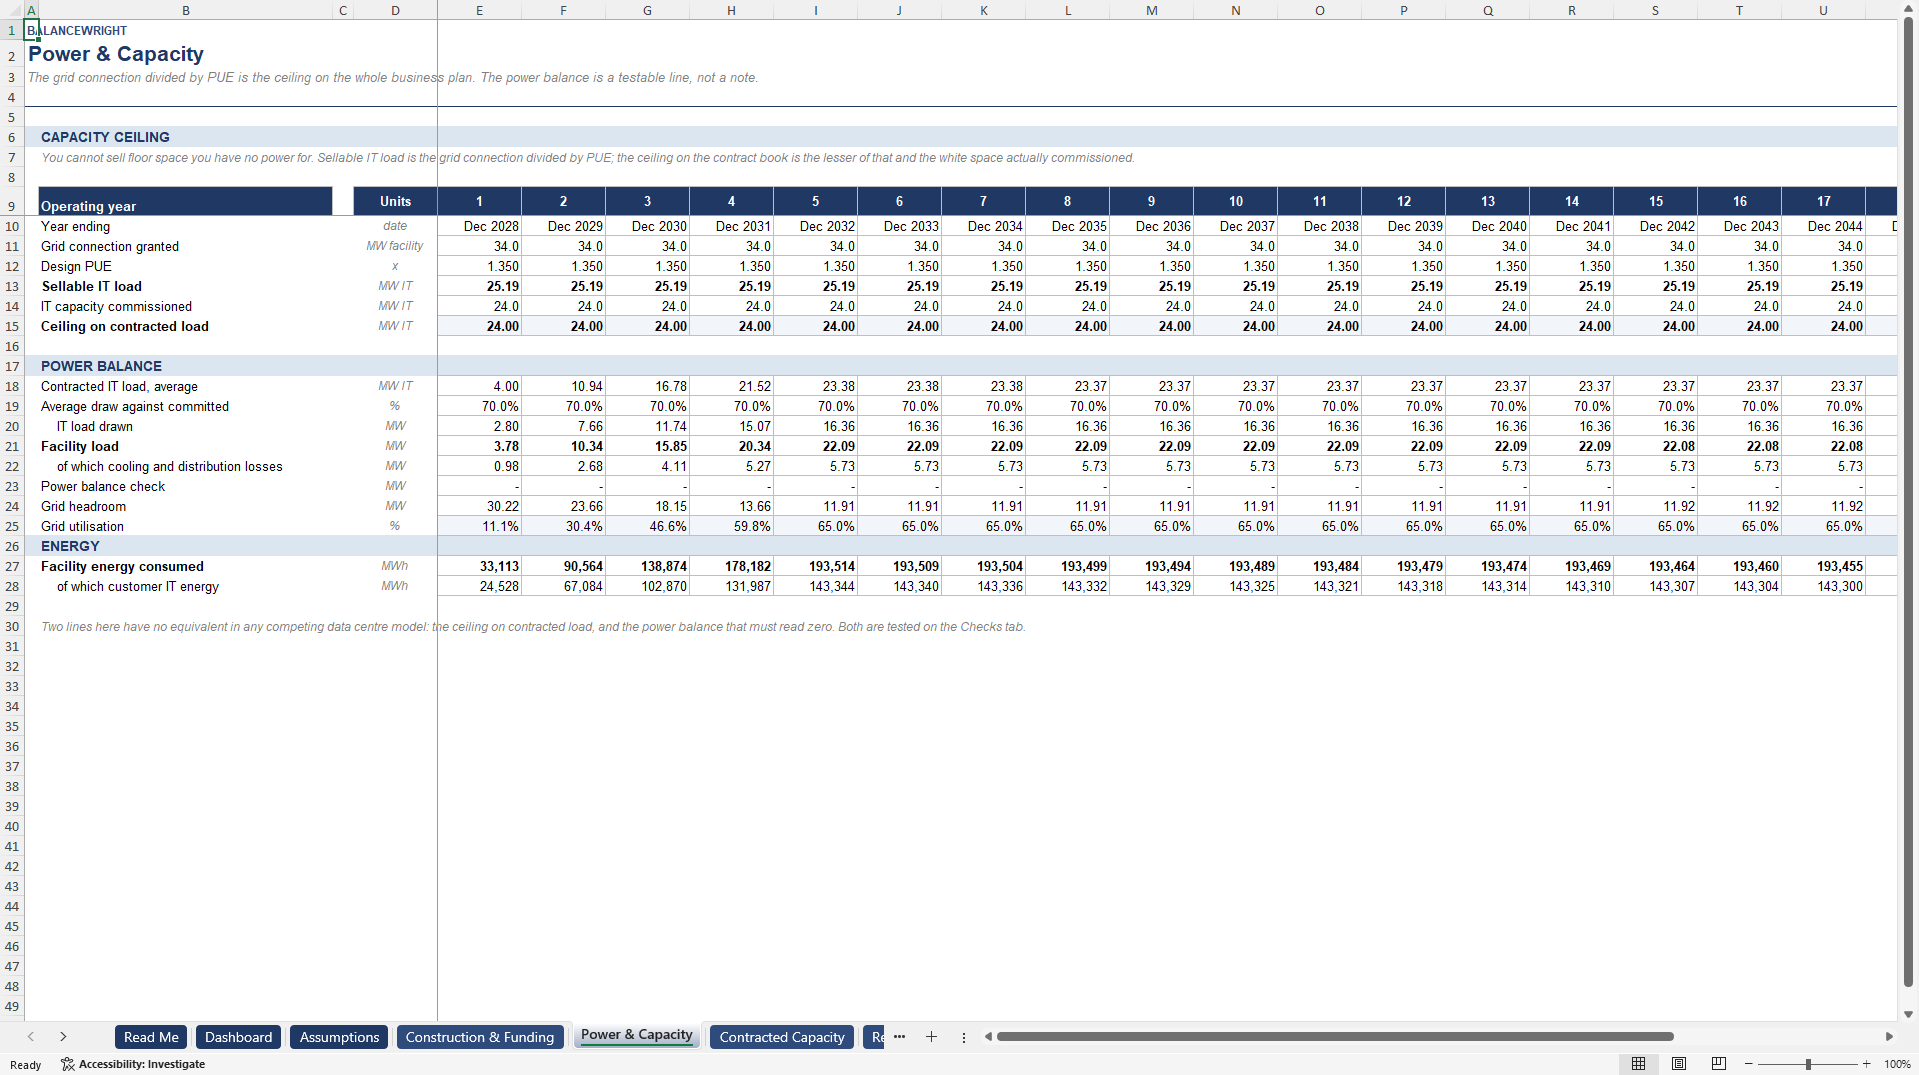
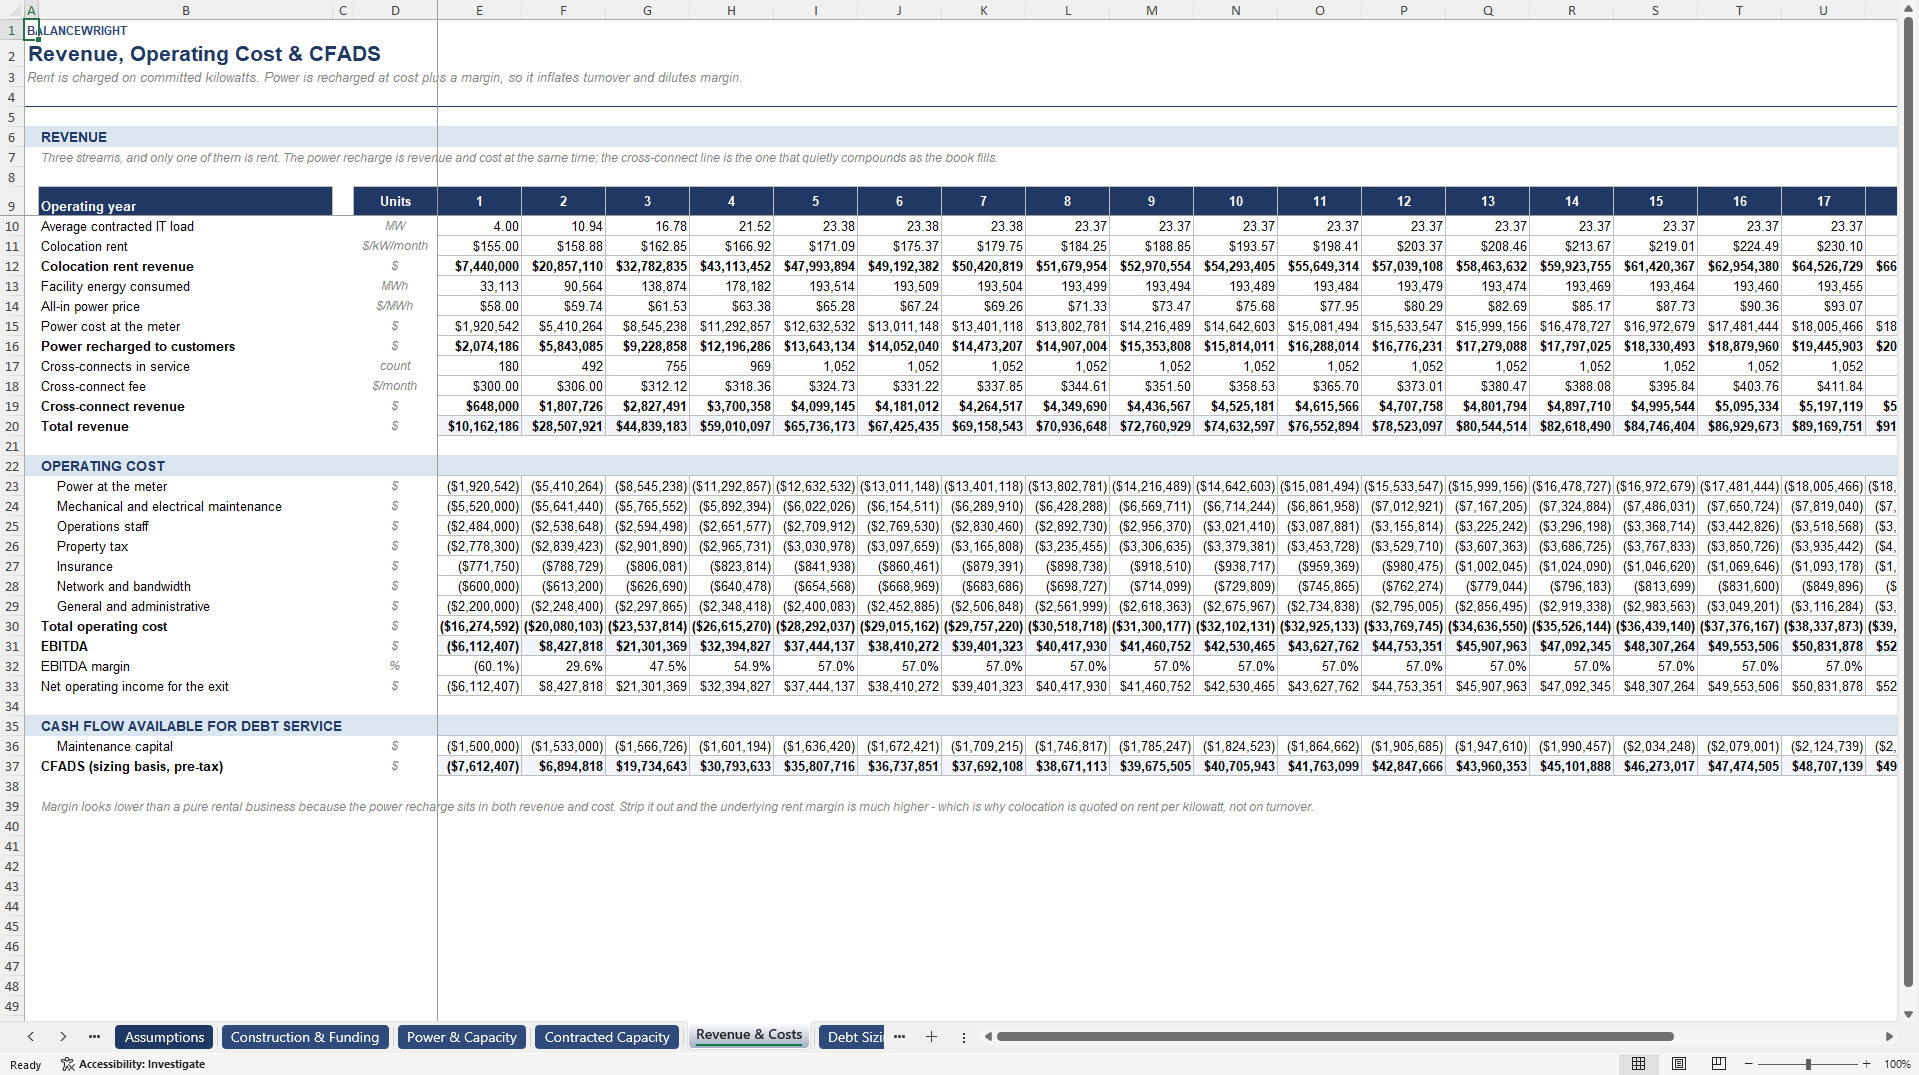
This workbook runs the chain in the direction the physics runs it. The grid connection divided by design PUE gives the IT load you can actually sell – cooling, distribution and losses take the difference – and that figure is a hard ceiling no lease-up plan can breach. Contracted IT load times the average customer draw gives the load drawn; that times PUE gives facility load; facility load against the connection gives headroom. The Checks tab tests, on every one of the twenty operating years, that the headroom is not negative and that the power balance reconciles exactly. Revenue then follows from the same quantities rather than from an unrelated rent roll: rent on committed IT load, metered energy recharged at cost plus a margin, and cross-connects per megawatt contracted.
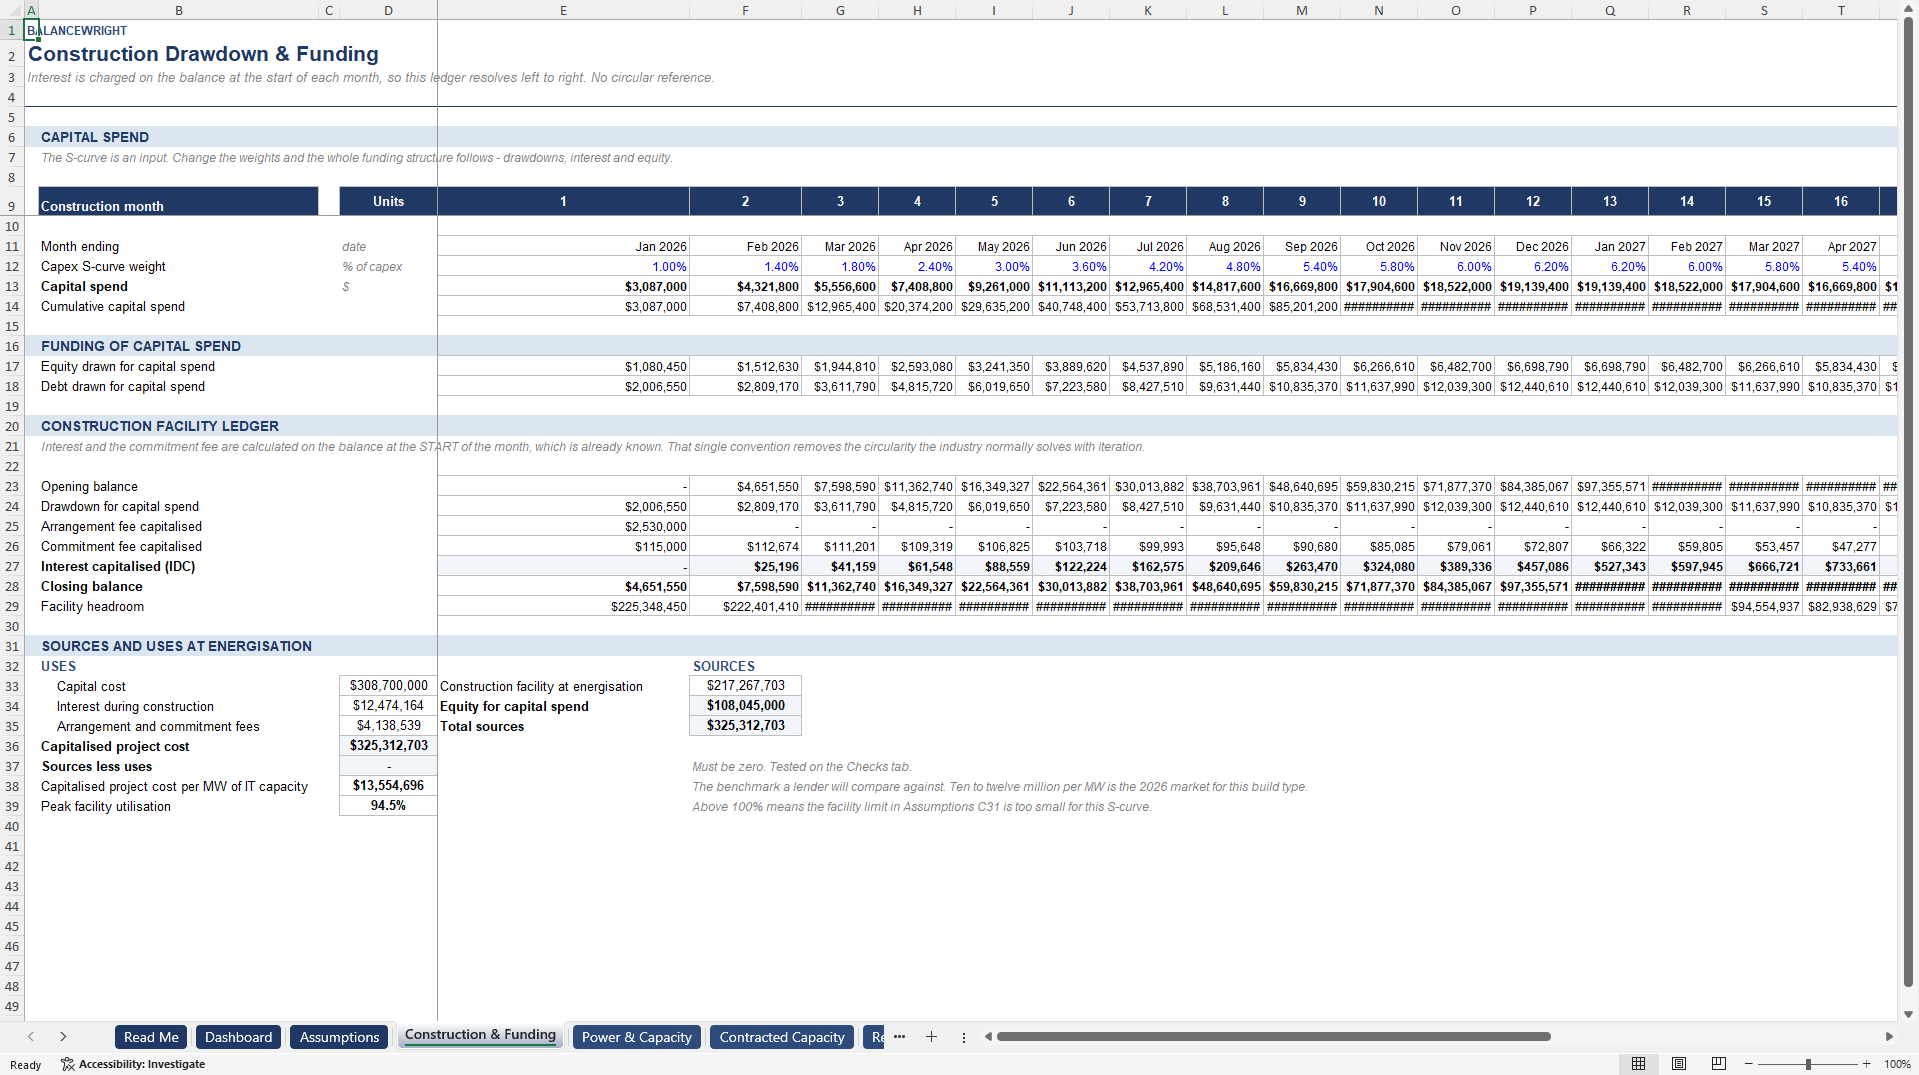
Twenty-four monthly construction columns take the capital spend through an S-curve you control, fund it at your target gearing, and capitalise the arrangement fee, the commitment fee and the interest during construction month by month. Because interest is charged on the balance at the start of each month, the ledger resolves left to right – no cell depends on itself, and iterative calculation stays switched off.
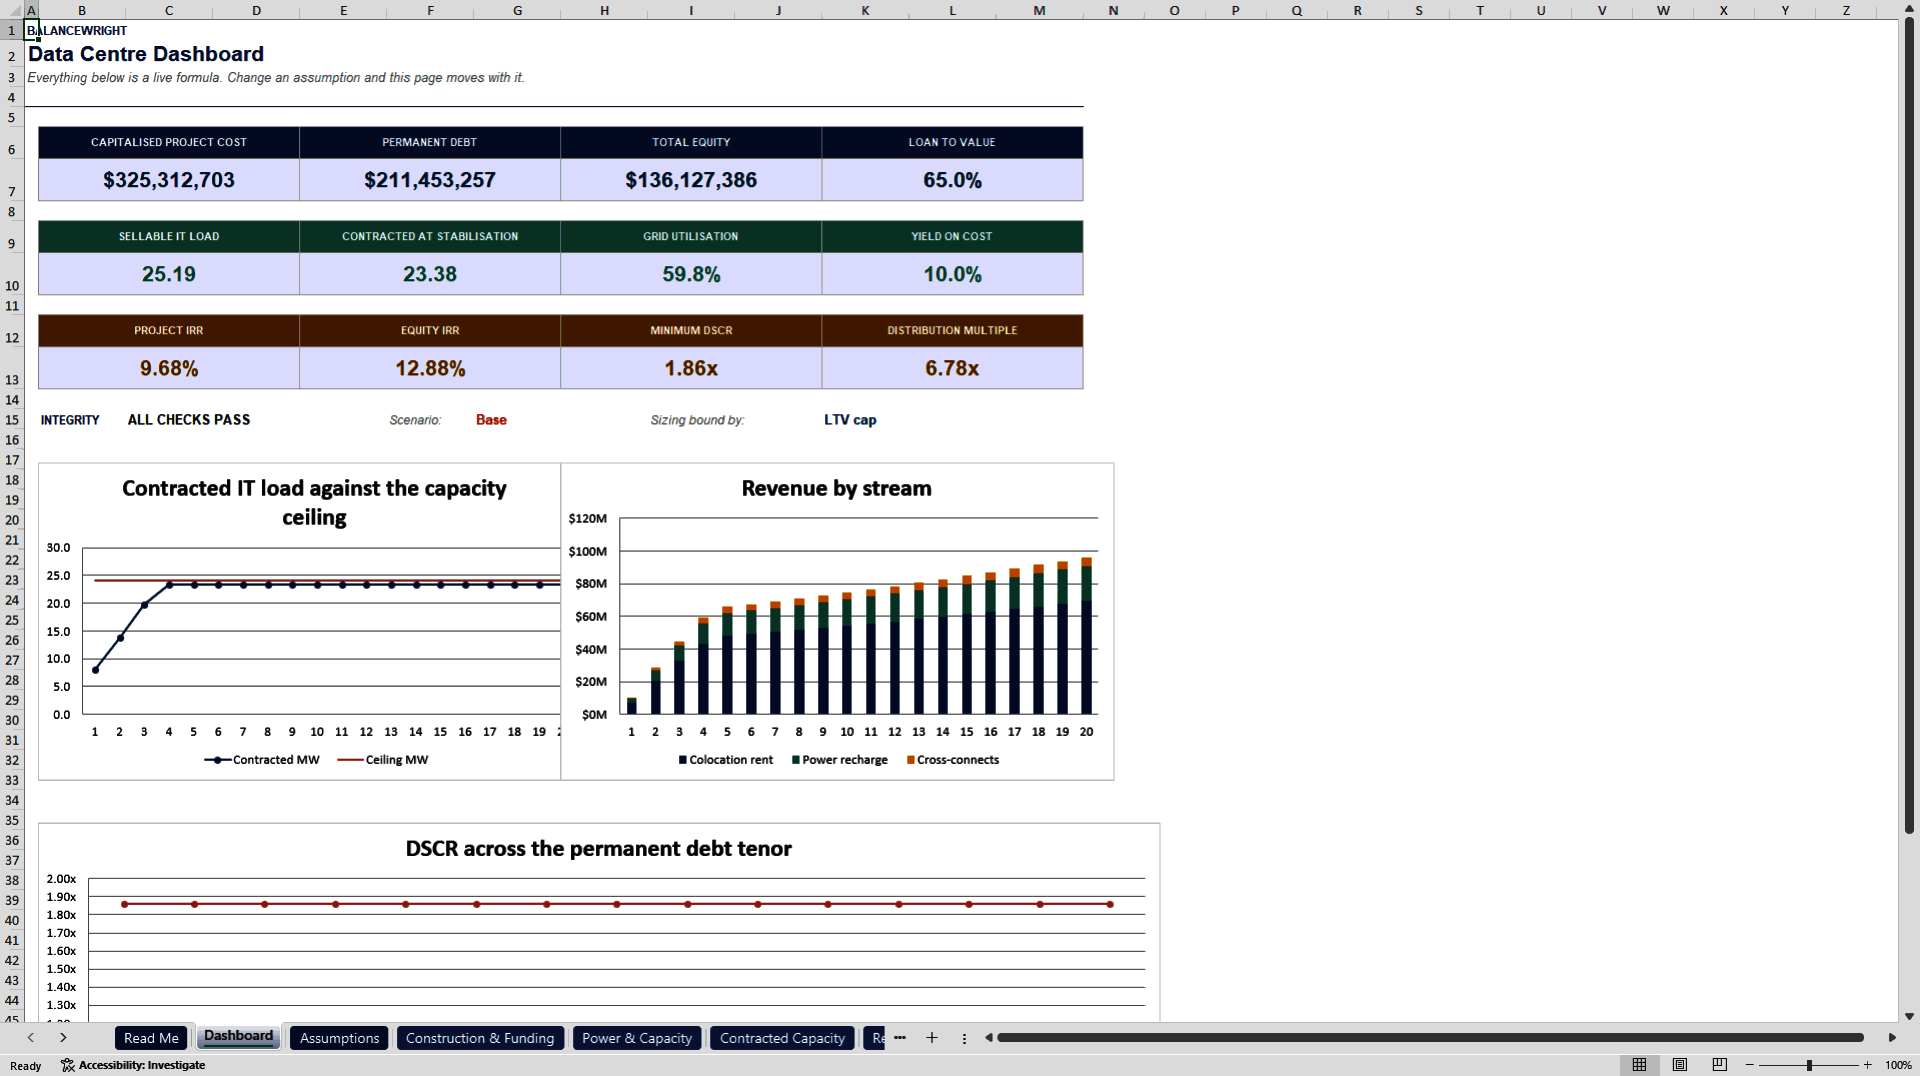
Debt is an output here, not an input. A lender runs two tests and lends the lesser of them: what the cash flow services at a target cover ratio, and what the asset supports as a share of cost. The model computes the DSCR capacity in closed form – the present value of CFADS over the tenor divided by the target ratio, one division, no goal seek and no solver – computes the loan-to-value cap on capitalised project cost, draws the lesser of the two, and names the binding constraint in words on the Dashboard.
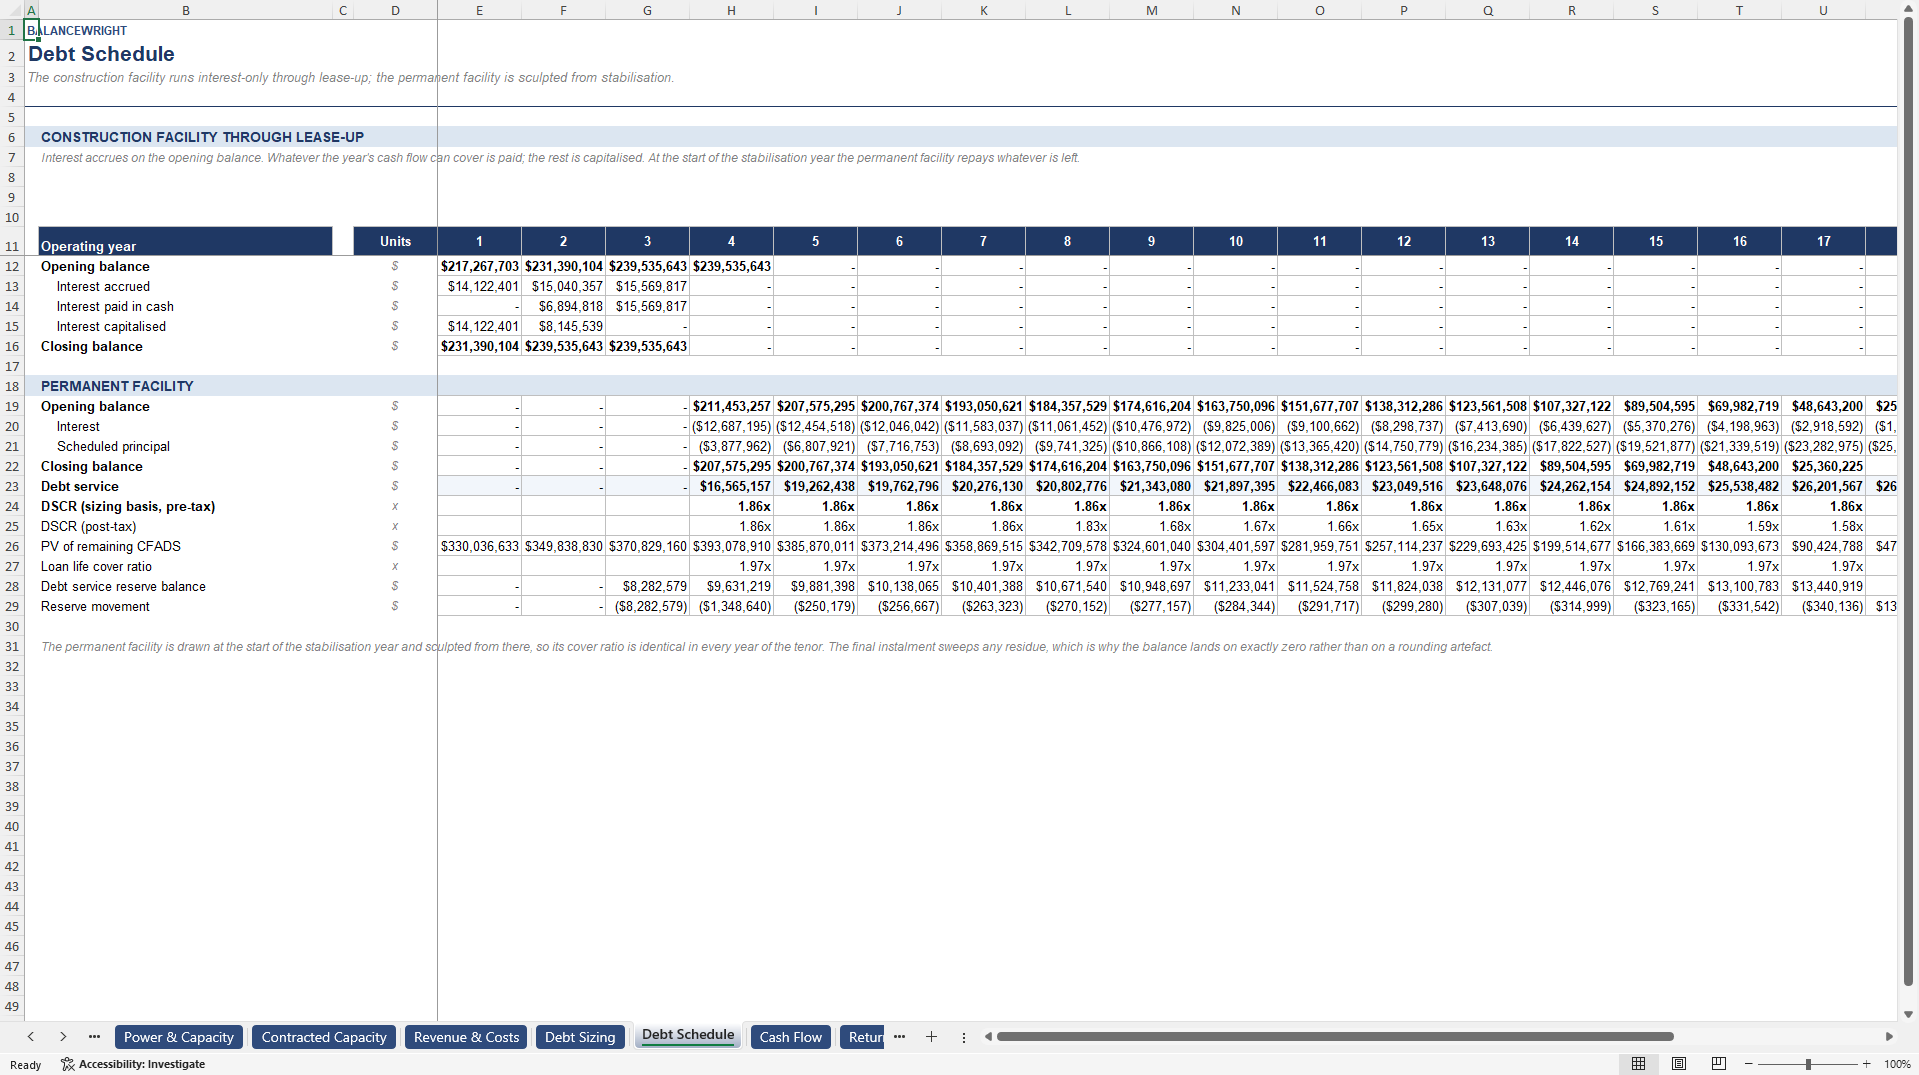
Between construction and a stabilised cash flow sits lease-up, and the financing has to survive it. The construction facility remains outstanding on an interest-only basis while the hall fills, with any interest the ramping cash flow cannot pay capitalised rather than assumed away. At the start of the stabilisation year the permanent facility is sized on the stabilised cash flow and drawn to repay it: a shortfall is an equity injection the model shows you, a surplus is released to the sponsor, and the Checks tab reconciles the refinancing to the cent.
The contract book is a bridge, not a typed-in row. Opening contracted load plus new contracts less churn equals the closing book, capped by the power ceiling, with the average book carrying revenue and the whole ramp shifted by an energisation delay you can set. That delay is the sensitivity that matters on a data centre in this market, and it is one of two exact one-way tables on the Returns tab: every case rebuilds the contract book, recomputes revenue, cost and tax, revalues the exit and re-solves the rate of return, with the workings on the same tab so you can audit them.
Fourteen integrity checks have to read PASS before any of it is worth quoting. Four of them exist only because this model treats the asset as a power business: the power balance reconciles every year, facility load never exceeds the grid connection, the contract book never exceeds the capacity ceiling, and the book bridge ties year by year. A model built on floor area cannot run them, because it never computes the quantities they test.
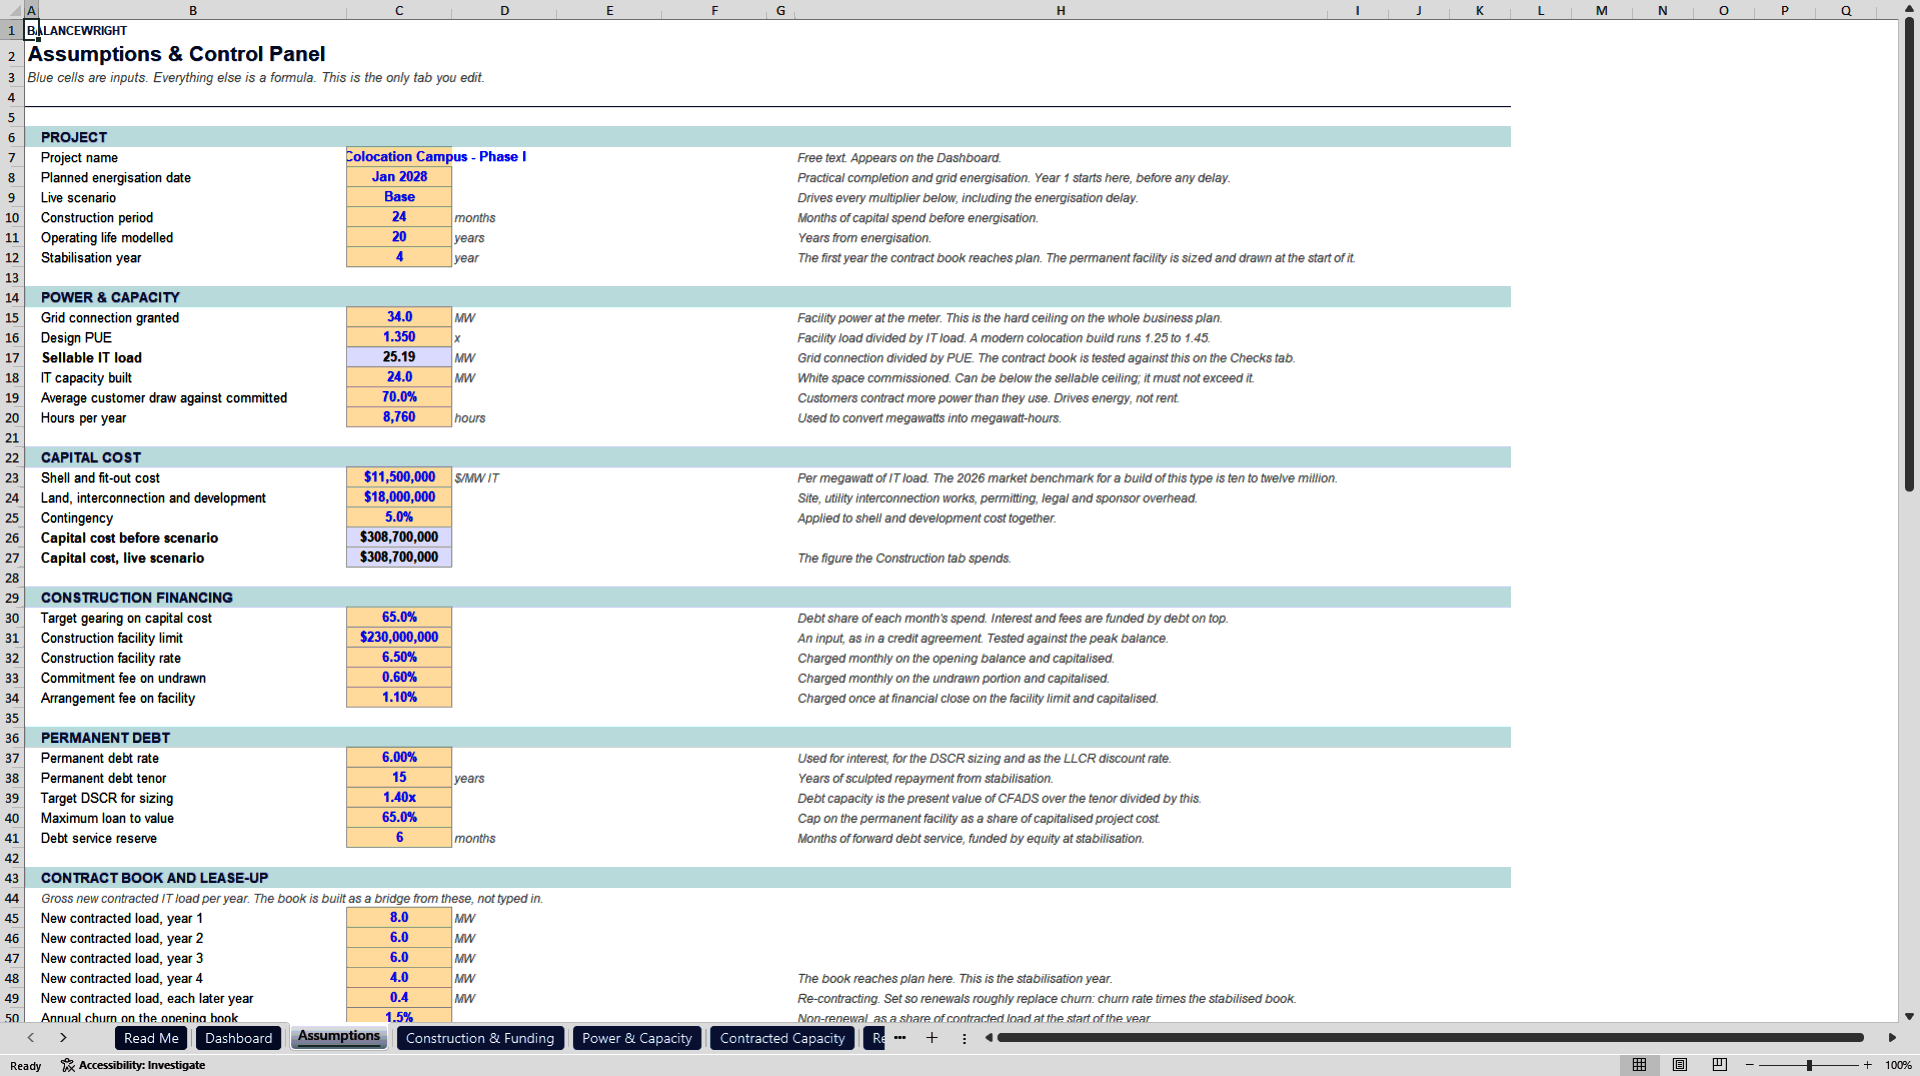
Twelve tabs: Read Me, Dashboard, Assumptions, Construction & Funding, Power & Capacity, Contracted Capacity, Revenue & Costs, Debt Sizing, Debt Schedule, Cash Flow, Returns, Checks. Live formulas throughout. No macros, no add-ins, no external links, no locked cells and no passwords. A worked example is pre-loaded – a 34 MW connection at 1.35 PUE, 24 MW of IT capacity built, leased up over four years at $155 per kW per month – so every tab works the moment you open it. A nine-page PDF guide covers the method, the three inputs people get wrong, and the limitations stated plainly.
Building this from scratch takes a competent financial modeller two to four days.
Got a question about the product? Email us at support@flevy.com or ask the author directly by using the "Ask the Author a Question" form. If you cannot view the preview above this document description, go here to view the large preview instead.
Source: Best Practices in Financial Modeling, Data Center Excel: Data Center Project Finance Model: PUE, Power & DSCR Debt Excel (XLSX) Spreadsheet, Paweł Dudek, Balancewright
ABOUT THE AUTHOR

Balancewright is Paweł Dudek. The catalogue covers project finance, fund and waterfall structures, corporate three-statement forecasting, working capital, valuation and FP&A -- built as working models rather than formatted templates.
Every model is formula-driven end to end. No locked cells, no passwords, no macros and no external links, so any calculation can be inspected, adapted and
... [read more]
Ask the Author a Question
You must be logged in to contact the author.




























