
Accounting Firm 10-Year 3 Statement Financial Model – Excel XLSX
Excel (XLSX)
BENEFITS OF THIS DOWNLOADABLE EXCEL DOCUMENT
- Delivers a fully integrated 3-statement financial modeling system purpose-built for accounting firms raising capital, scaling operations, or executing acquisitions.
- Equips founders, managing partners, and investors with an institutional-grade framework to forecast revenue, profitability, cash flow, and partner economics with precision.
- Provides a structured foundation for underwriting accounting firm growth, financing, and valuation decisions with lender- and PE-ready financial rigor.
INTEGRATED FINANCIAL MODEL EXCEL DESCRIPTION
Curated by McKinsey-trained Executives
🏦 Accounting Firm Financial Model – 10-Year Forecast
The Ultimate Excel Financial Model for Accounting Firm Founders, Managing Partners & Investors
Stop underpricing your services. Stop losing deals because your financials don't hold up. Stop paying $25,000 for a consultant to build what you can own forever.
If you're launching, scaling, or financing an accounting firm, your financial model is NOT a spreadsheet.
It's your #1 partner buy-in weapon. Your bank financing armor. Your practice valuation proof of concept.
And this model gives you – fully built and formula-verified – exactly what PE acquirers, SBA lenders, and growth equity firms demand to see.
💼 What You Get
✅ 8 Fully Linked Excel Worksheets
✅ 1,600+ Active, Verified Excel Formulas
✅ 10-Year Annual Forecast (Year 1 – Year 10)
✅ Complete 3-Statement Model: Income Statement, Balance Sheet & Cash Flow
✅ 5 Separate Revenue Streams Built from Operational Drivers – Not Growth Percentages
✅ Full Billable Hours, Utilization Rate & Billing Rate Architecture
✅ CAC, Partner Draw Mechanics & Staff Leverage Ratios Built into Every Year
✅ Sensitivity Analysis & 4-Scenario Comparison Table
✅ Executive Dashboard with KPI Cards & Full 10-Year Trend Table
✅ 85+ Blue-Coded Assumption Inputs – Change One Cell, Everything Updates
This is not a generic professional services template.
This is a complete, accounting firm–specific financial modeling system.
🎯 Who This Is For
• CPA firm founders raising capital for acquisitions, office expansions, or partner buyouts
• Private equity and search fund investors underwriting accounting firm acquisitions
• Managing partners building institutional-grade 3-year and 10-year operating plans
• Accounting firm operators planning partner succession, equity transitions, or lateral hires
• Regional CPA firms preparing for PE roll-up due diligence
• Solo practitioners modeling the leap to multi-partner practice
• FP&A analysts and fractional CFOs advising accounting firm clients
• M&A advisors representing accounting firm sell-side mandates
• SBA and bank lenders stress-testing accounting practice loan applications
• MBA and CFA candidates learning professional services financial modeling
If you analyze, develop, finance, or operate an accounting firm – this was built for you.
🔥 Why Most Accounting Firm Financial Models Fail
Generic templates focus on:
• Simple revenue = last year × growth percentage
• No concept of billable headcount, utilization rates, or billing rate by seniority
• No partner draw vs. salary distinction or partner capital mechanics
• No client churn modeling or recurring revenue roll-forward
• No staff leverage ratios or realization rate analysis
• No fulfillment cost modeling: engagement labor, direct billing, and unbillable time
• No service line separation: tax prep, audit, bookkeeping, advisory, and payroll modeled as one lump sum
• No working capital mechanics: DSO-driven AR, deferred retainer revenue, or accrued payroll
This model fixes all of that – from the ground up.
📚 What's Inside – Every Tab, Every Formula
Tab 1: Dashboard
• 12 auto-updating KPI cards: Total Revenue, EBITDA, Net Income, Cash Balance, Gross Margin %, EBITDA Margin %, Net Margin %, Revenue per Employee, Utilization Rate, Partner Distributions, AR Days, and Recurring Revenue %
• Full 10-year trend table spanning all critical P&L, cash flow, and staffing metrics
• 4 embedded charts: Revenue by Service Line (stacked), EBITDA & Net Income trend, Cash Balance trajectory, and Headcount growth
• Conditional formatting automatically flags cash below minimum threshold and margin compression in real time
• Fully formula-driven – no manual data entry required on the Dashboard
• Designed for investor presentations, bank financing packages, and partner meetings
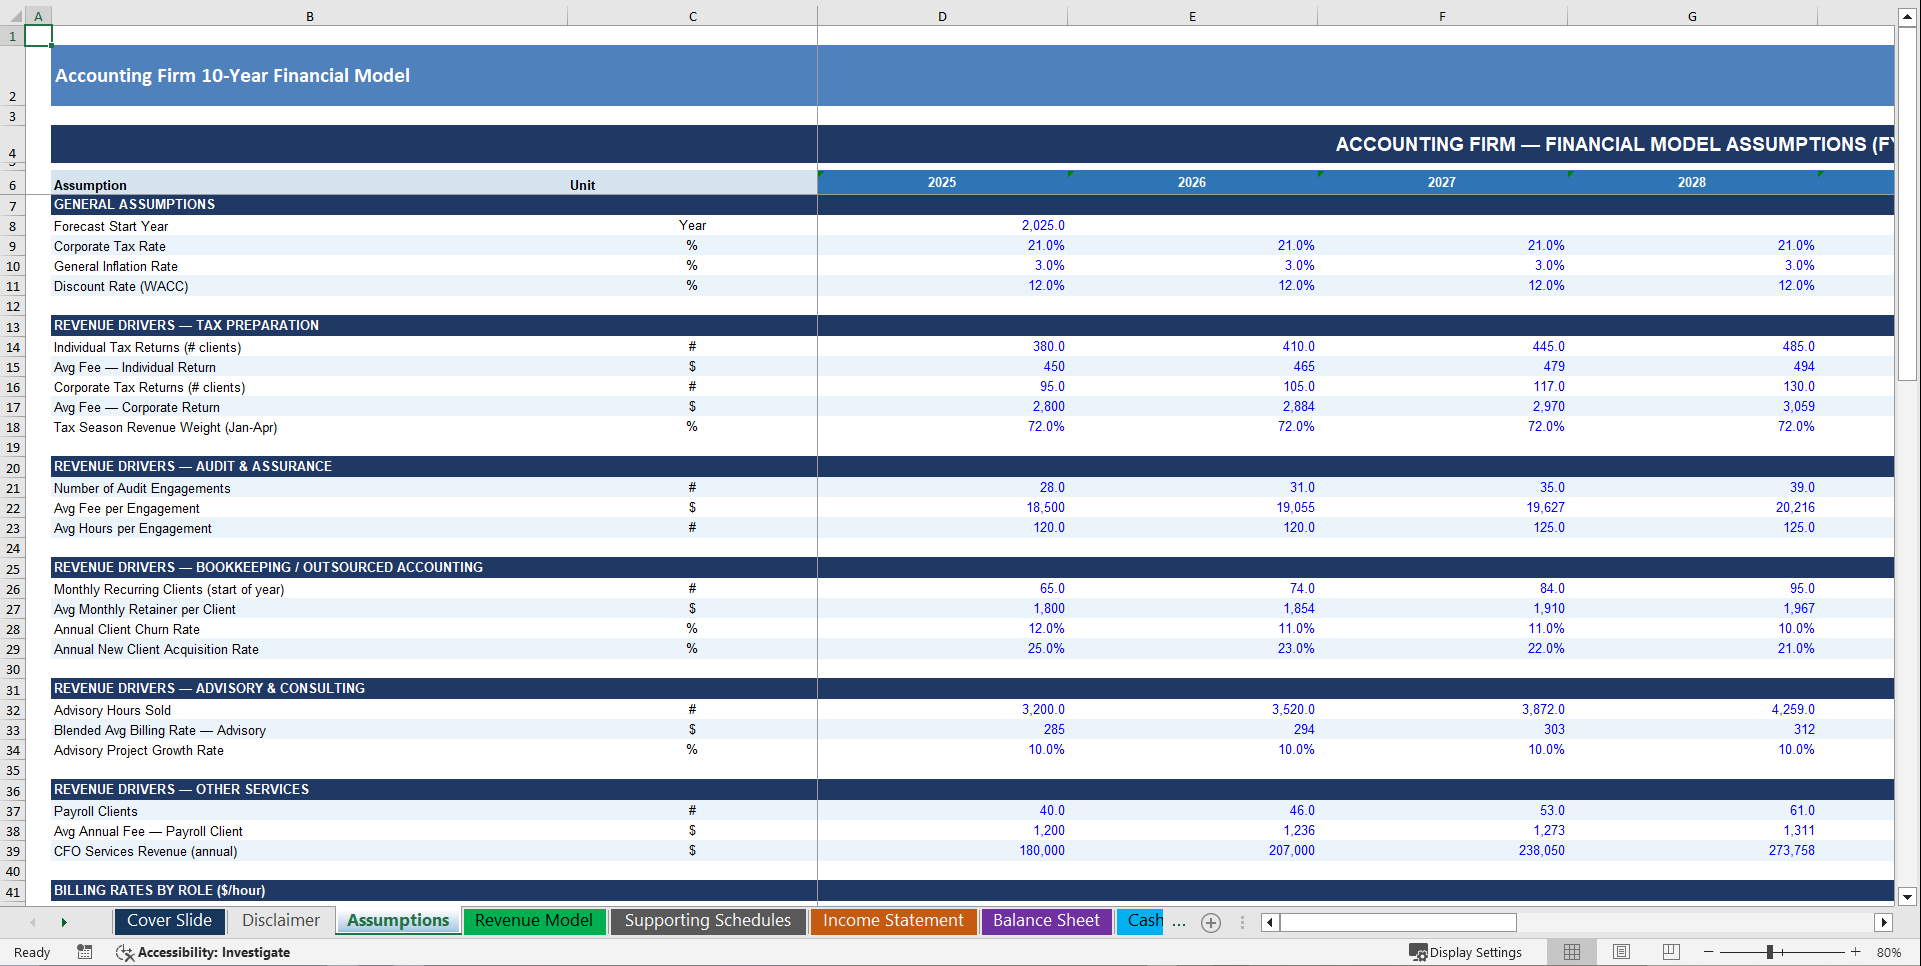
Tab 2: Assumptions
• 85+ blue-coded input cells – the single source of truth for the entire model
• Section A – Traffic & Client Metrics: individual and corporate tax client counts, fee per return, audit engagement count and fee per engagement, bookkeeping client base with churn and acquisition rates, advisory hours sold and blended billing rate
• Section B – Billing Rate Architecture: partner, senior CPA, staff CPA, and bookkeeper billing rates with annual escalation built in
• Section C – Utilization Rates: configurable utilization by seniority level driving billable revenue capacity
• Section D – Headcount: 5 staff tiers with annual growth assumptions – partners, senior CPAs, staff CPAs, bookkeepers, and admin
• Section E – Compensation: base salary by role, annual raise rate, bonus structure, payroll taxes, and benefits as a % of salary
• Section F – Operating Expenses: office rent, software subscriptions, CPE and licensing, E&O insurance, marketing, travel, IT, and G&A all individually modeled
• Section G – Balance Sheet Drivers: DSO, DPO, deferred revenue months, CapEx, depreciation life, debt balance, interest rate, partner capital contributions, distribution rate, and minimum cash threshold
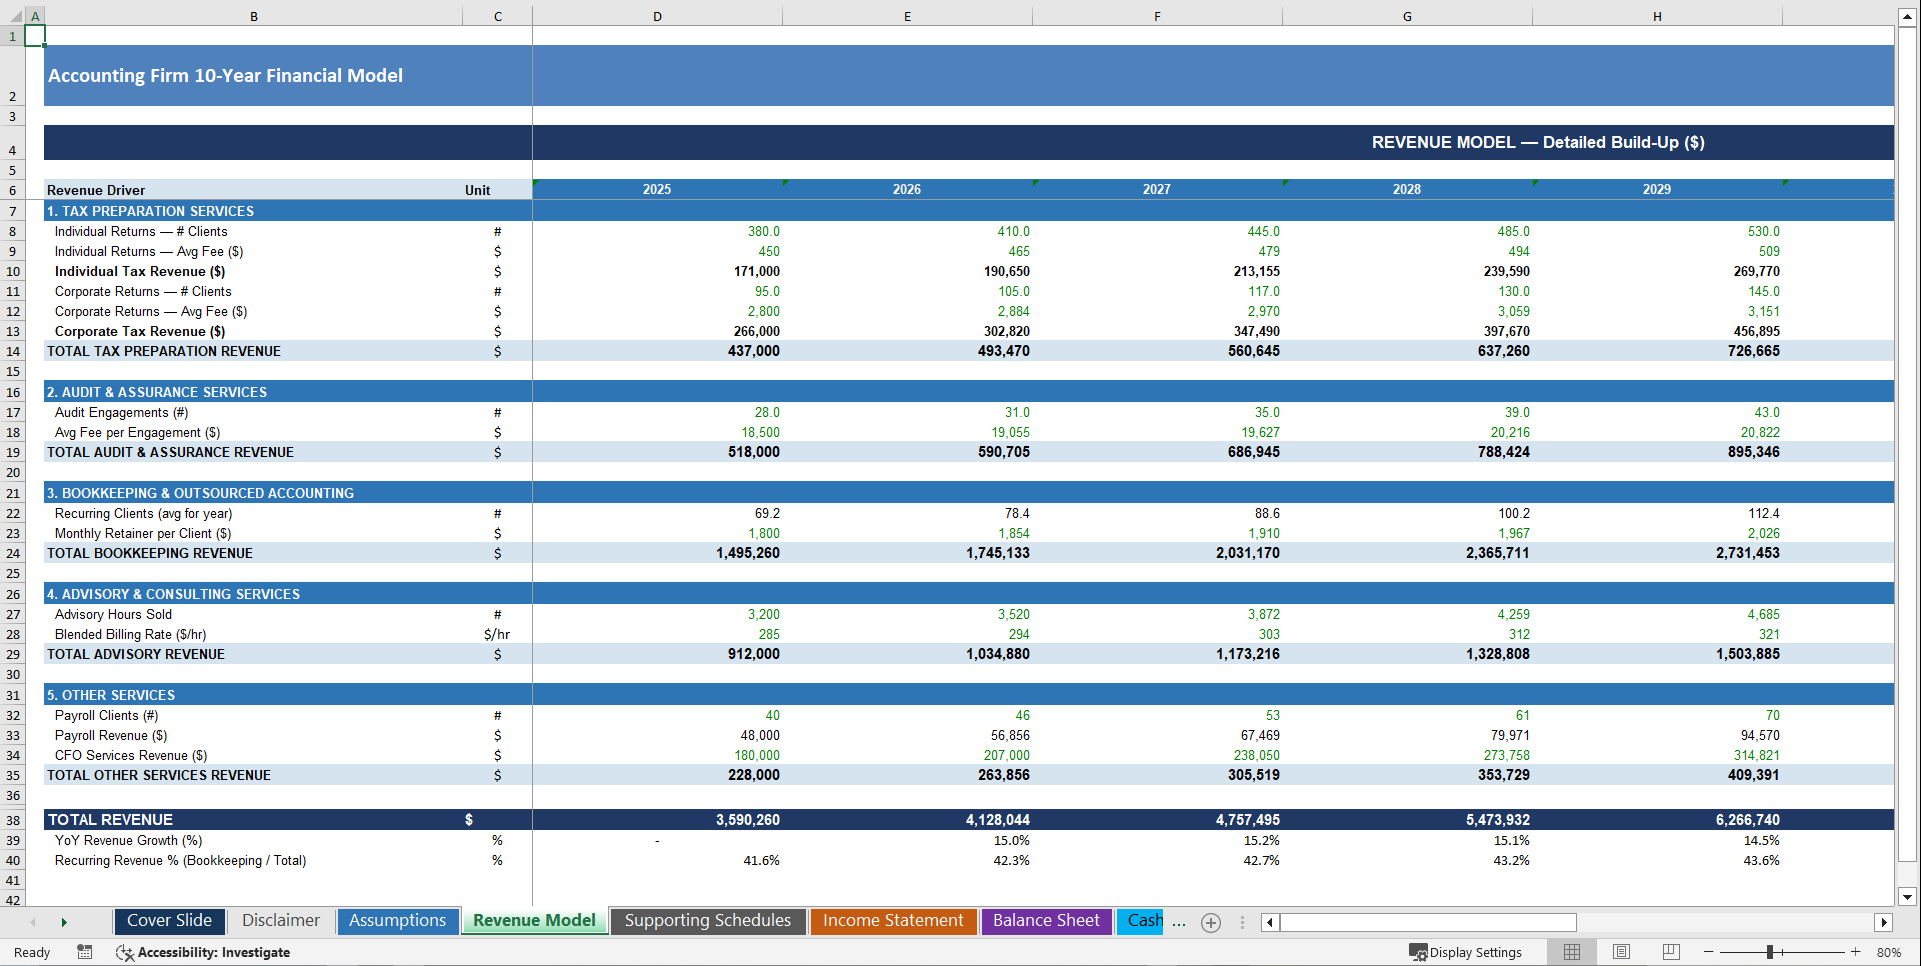
Tab 3: Revenue Model
• Revenue Stream 1 – Tax Preparation: individual and corporate returns each built from client count × average fee, with seasonal weighting logic
• Revenue Stream 2 – Audit & Assurance: engagements × average fee per engagement, growing independently from tax
• Revenue Stream 3 – Bookkeeping & Outsourced Accounting: monthly recurring client base roll-forward with churn and acquisition rates driving a true ARR-style revenue engine
• Revenue Stream 4 – Advisory & Consulting: hours sold × blended billing rate, growing on a configurable project growth trajectory
• Revenue Stream 5 – Other Services: payroll clients × annual fee plus CFO services revenue modeled separately
• Year-over-year revenue growth percentage auto-calculated for all 10 years
• Recurring revenue percentage benchmarked annually – the metric acquirers value most in CPA firm transactions
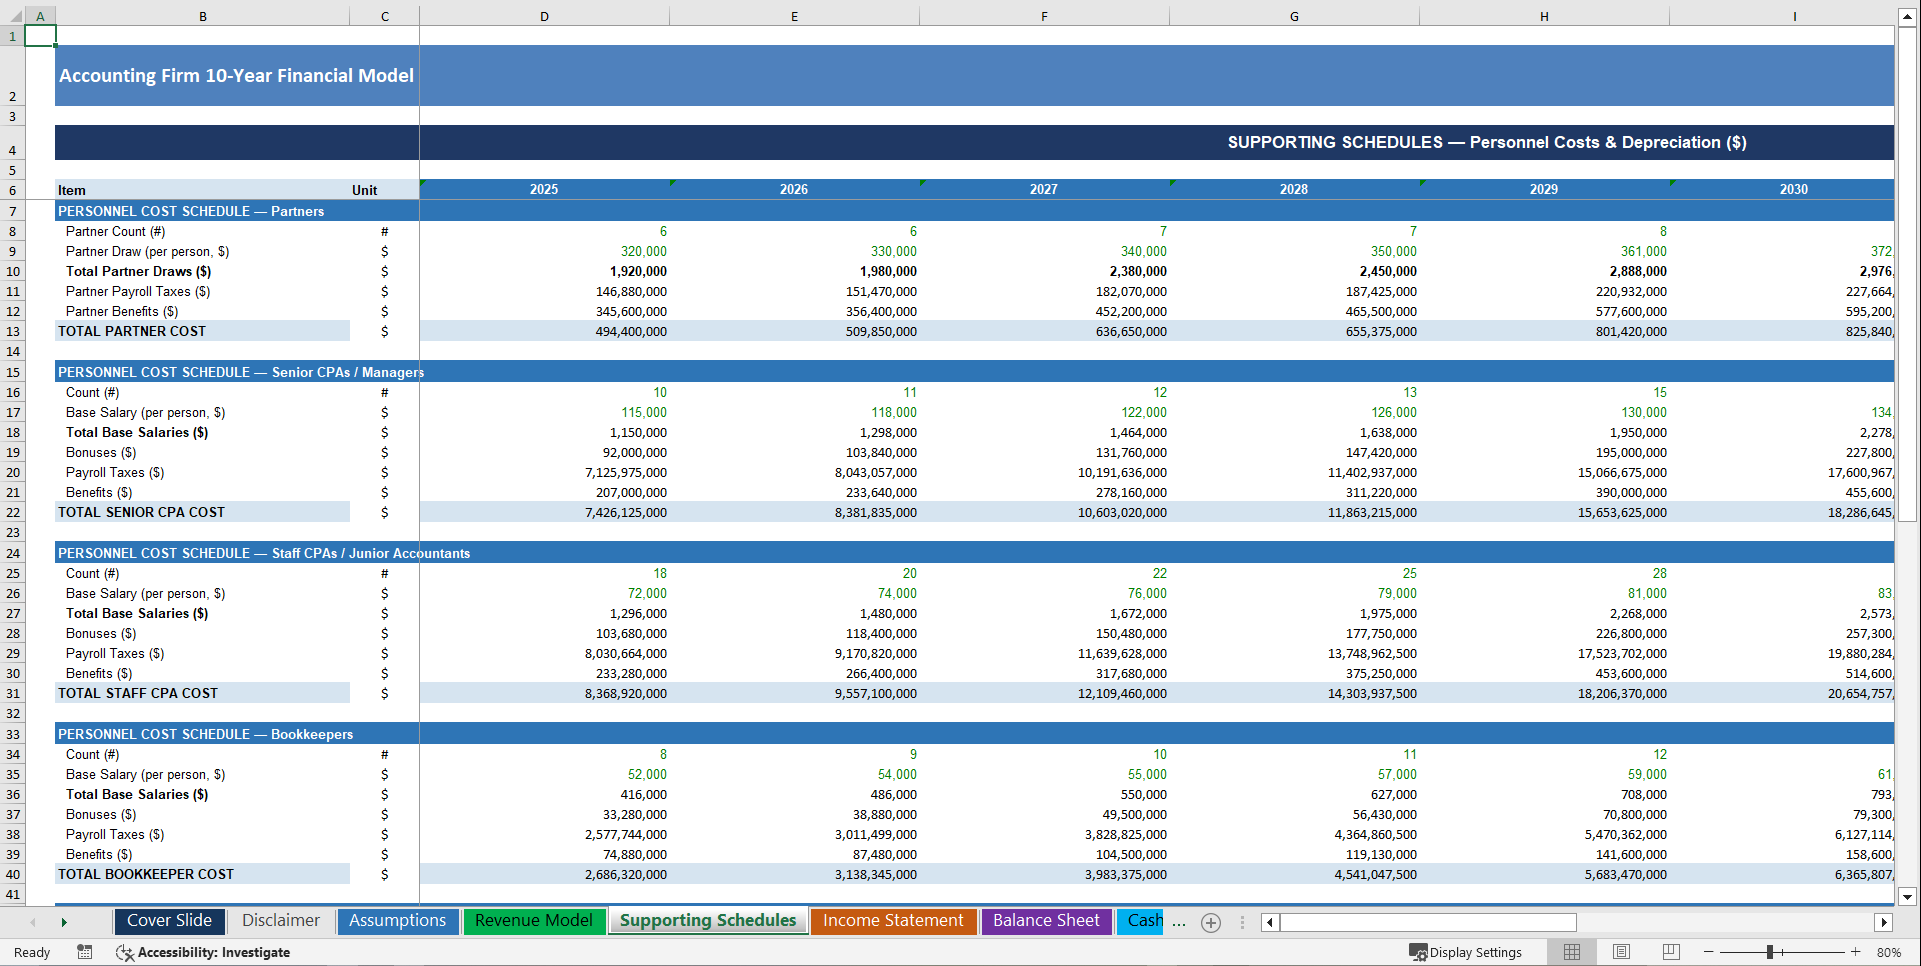
Tab 4: Supporting Schedules
• Full personnel cost schedule broken out by role – partners, senior CPAs, staff CPAs, bookkeepers, and admin – each with base salary, bonus, payroll taxes, and benefits modeled separately
• Billable vs. non-billable cost split allocates direct labor to gross profit and overhead correctly – the distinction most generic models miss entirely
• PP&E roll-forward: opening gross assets, annual CapEx additions, accumulated depreciation, and net book value for every year
• Debt schedule: opening balance, interest expense, annual repayment, and closing balance – fully linked to the Income Statement and Cash Flow Statement
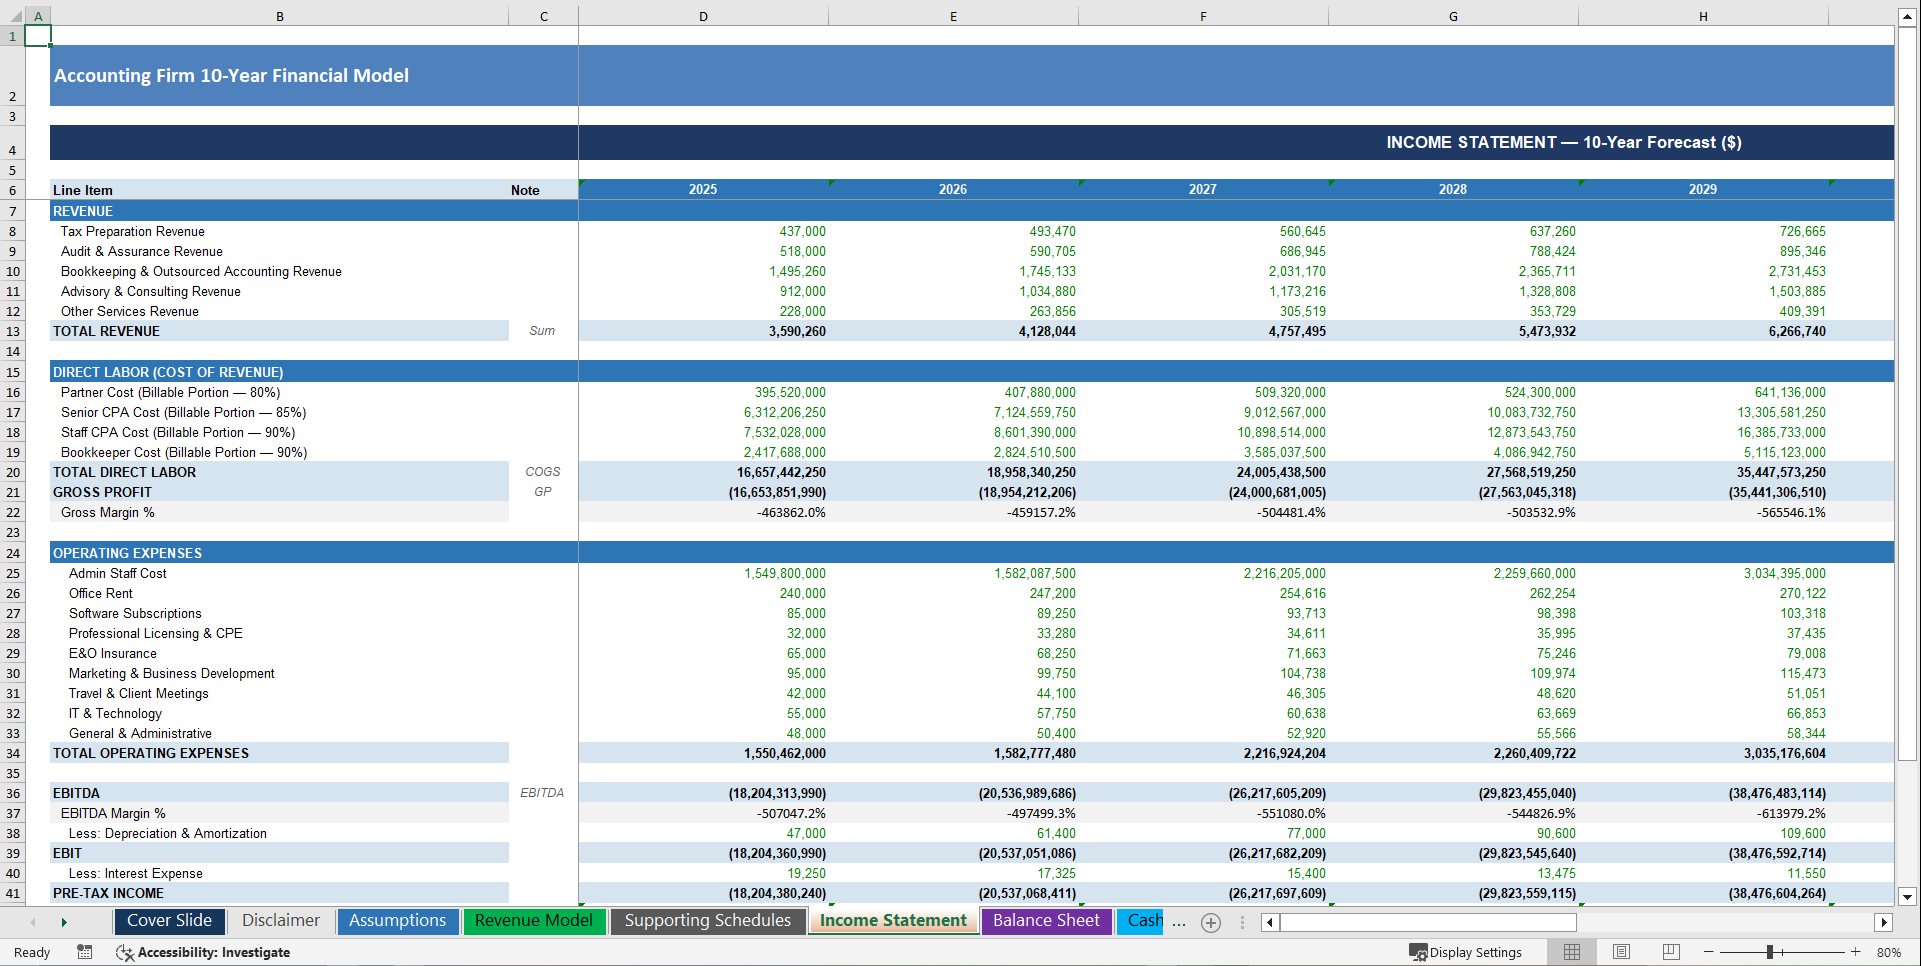
Tab 5: Income Statement
• Full GAAP-format P&L for Years 1–10
• Net Revenue by service line pulled directly from the Revenue Model
• Direct Labor (COGS equivalent) separated from operating overhead – shows true gross margin by engagement
• Gross Profit and Gross Margin % for every year
• Operating Expenses broken into admin staff cost, rent, software, CPE, insurance, marketing, travel, IT, and G&A – no lump sums
• EBITDA and EBITDA Margin % for every year
• Depreciation & Amortization from the PP&E roll-forward schedule
• EBIT, Interest Expense, Pre-Tax Income, Tax Expense, and Net Income – full waterfall
• Partner distributions as a configurable % of net income, reducing retained earnings correctly
• Net Margin % output for every year
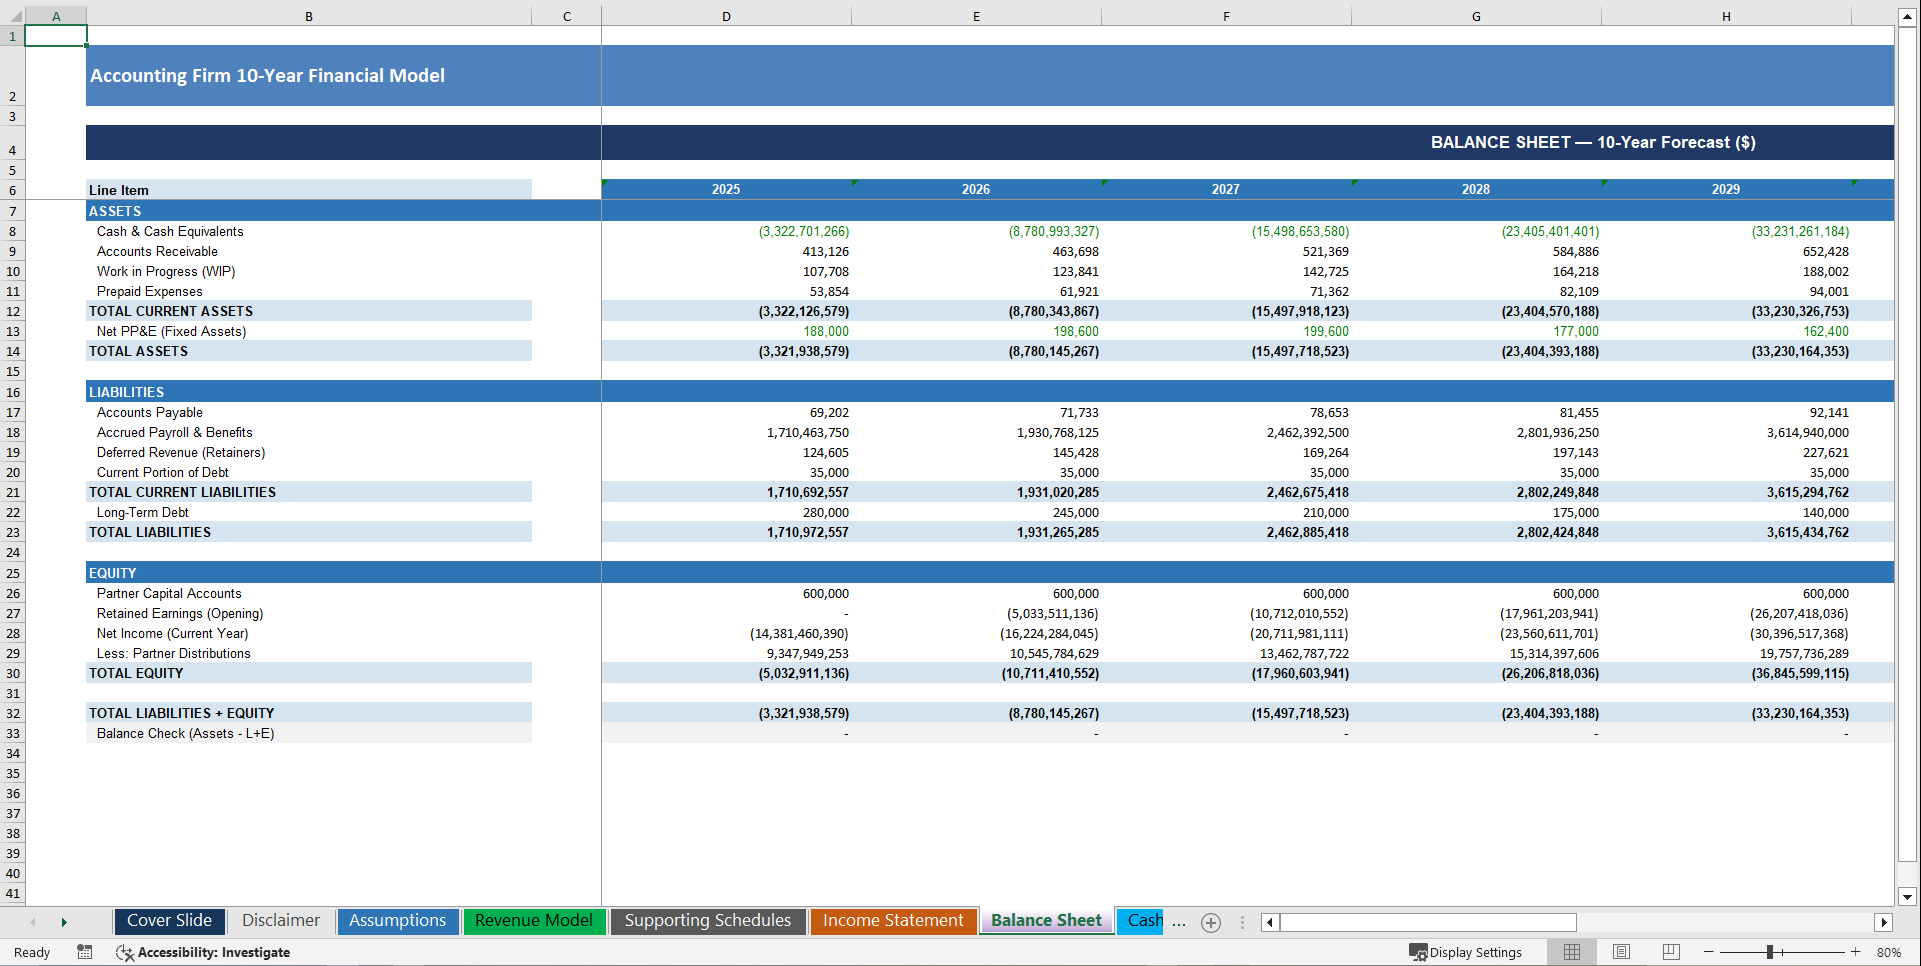
Tab 6: Balance Sheet
• Current Assets: Cash (hard-linked from Cash Flow Statement), Accounts Receivable (DSO-driven), Work in Progress, and Prepaid Expenses
• Non-Current Assets: Net PP&E from depreciation roll-forward – fully dynamic
• Current Liabilities: Accounts Payable (DPO-driven), Accrued Payroll (1-month rolling), Deferred Revenue from retainer clients, and current debt repayment
• Long-Term Debt from the debt schedule
• Equity: Partner Capital Accounts, Retained Earnings roll-forward, current year Net Income, and Partner Distributions
• Balance check formula confirms Total Assets = Total Liabilities + Equity for all 10 years – zero reconciliation risk
Tab 7: Cash Flow Statement (Indirect Method)
• Operating Activities: Net Income + Depreciation + changes in AR, WIP, Prepaids, AP, Accrued Payroll, and Deferred Revenue – all 7 working capital line items modeled
• Investing Activities: Annual CapEx outflows from the Assumptions tab
• Financing Activities: Partner capital contributions, debt repayment, and partner distributions – all three financing flows explicitly modeled
• Net change in cash per year
• Opening cash roll-forward linked from prior year ending balance
• Ending cash hard-linked to Balance Sheet – the integration test every lender runs on page one of due diligence
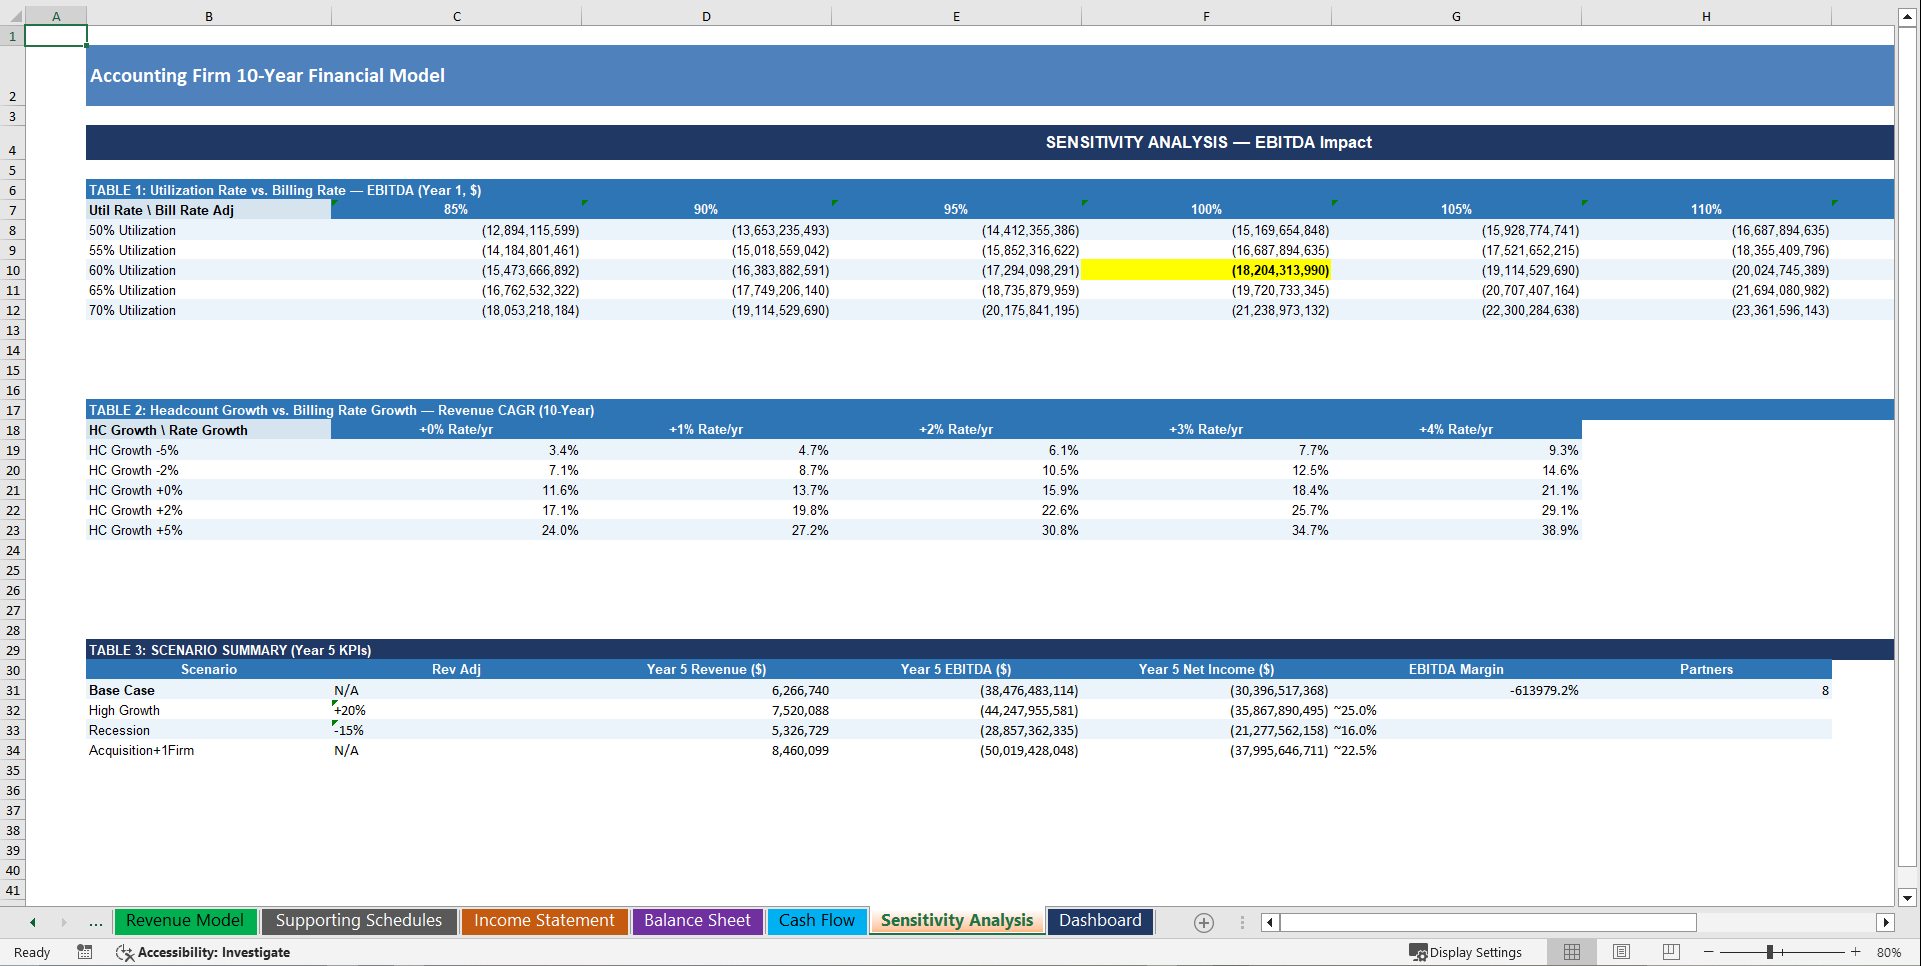
Tab 8: Sensitivity & Scenario Analysis
• Table 1 – Utilization Rate × Billing Rate EBITDA Matrix: 35-cell sensitivity grid showing Year 1 EBITDA across 5 utilization rate scenarios and 7 billing rate adjustment scenarios – instantly reveals your breakeven utilization floor and the billing rate premium needed to hit margin targets
• Table 2 – Headcount Growth × Rate Growth Revenue CAGR Table: 25-cell matrix showing 10-year revenue CAGR across combinations of headcount growth and billing rate escalation – quantifies the compounding power of staff leverage
• Table 3 – Five-Scenario Comparison: Base Case, High Growth, Recession, and Acquisition scenarios each showing Year 5 Revenue, EBITDA, Net Income, EBITDA Margin, and Partner Count – every scenario your PE buyer or lender will stress-test before signing
💎 PLUS: Sensitivity & Scenario Analysis Built In
This is NOT a static model with one set of outputs.
It includes:
1️⃣ Utilization Rate × Billing Rate EBITDA Sensitivity Matrix
35-cell grid showing Year 1 EBITDA across every combination of utilization and billing rate adjustment. Instantly reveals your breakeven utilization floor and exactly how much rate premium you need to protect EBITDA under a hiring or slowdown scenario.
2️⃣ Headcount Growth × Billing Rate CAGR Table
Shows you the 10-year compounding effect of adding headcount vs. raising rates. The answer surprises most operators – and it's the conversation every growth equity investor wants to have.
3️⃣ Four Full Business Scenarios
• Base Case – conservative scaling with realistic partner leverage and steady client growth
• High Growth – aggressive hiring, acquisition of client books, and billing rate expansion
• Recession / Demand Softness – client churn acceleration and rate compression stress test
• Acquisition Scenario – revenue upside from tuck-in firm acquisition with blended margin impact
💰 Why This Model Is Different
This model delivers:
✔ Revenue built from client counts, billing rates, utilization, and service line mix – not a growth percentage multiplied against last year
✔ Staff economics fully modeled: billable vs. non-billable cost split, 5-tier headcount architecture, partner draw mechanics
✔ Accounting firm–specific cost structure: E&O insurance, CPE, tax software, per-engagement labor allocation, and retainer deferred revenue
✔ Institutional-grade 3-statement integration – every number ties, every balance sheet balances
✔ Fully transparent assumption architecture – one tab controls 1,600+ formulas
✔ Sensitivity and scenario analysis built for PE due diligence, bank credit committees, and partner buyout negotiations
✔ Professional color-coded formatting: blue inputs, black formulas, green cross-sheet links – investment banker standard
It's built for PE-backed CPA firm roll-ups, SBA-financed practice acquisitions, managing partner growth plans, and institutional M&A transactions – not generic professional services templates.
🧠 Built for Real Capital Decisions
This model helps you:
• Underwrite accounting firm acquisitions with institutional rigor
• Build a lender-ready financial package for SBA 7(a) loans, practice acquisition financing, and growth lines of credit
• Present to private equity and search fund investors with a clean, fully linked 3-statement model
• Stress-test your utilization rate and billing rate assumptions before committing to a new office or lateral hire
• Understand your true unit economics: revenue per employee, EBITDA per partner, recurring revenue as a % of total revenue
• Compress months of financial modeling work into hours – and walk into every partner meeting with the numbers to back your strategy
🚨 The Cost of NOT Having This
Every capital raise or acquisition you run without a proper model risks:
• Losing an SBA loan because your cash flow statement doesn't tie to your balance sheet
• Undervaluing your firm in a sale because you couldn't model a clean recurring revenue trajectory for the buyer
• Overpaying for a client book acquisition due to weak working capital and deferred revenue underwriting
• Failing PE due diligence because your revenue model is a straight-line growth guess with no operational drivers
• Spending $20,000–$30,000 on a Big 4 consultant to build what you can own and reuse forever
One financing round or acquisition modeled correctly could return this investment thousands of times over.
⚡ Stop Building From Scratch. Start Closing Deals.
If you're serious about:
• Raising debt or equity capital with a credible, bottoms-up revenue model your lender actually believes
• Underwriting CPA firm acquisitions with proper billing economics and working capital modeling
• Building a board-ready financial plan your managing partner would be proud of
• Saving weeks of financial modeling time on your next deal, succession plan, or PE process
This model is your shortcut.
👉 Get the Accounting Firm Financial Model the Right Way
No hardcoded revenue projections.
No broken formula links.
No wasted weekends rebuilding from scratch.
Just a complete, verified, accounting firm–specific 3-statement financial model – ready to deploy on your next raise, acquisition, partner buyout, or operating plan.
Download the Accounting Firm Financial Model today – and underwrite your next deal with the confidence of a McKinsey-trained CFO.
Keywords:
Strategy & Transformation, Growth Strategy, Strategic Planning, Strategy Frameworks, Innovation Management, Pricing Strategy, Core Competencies, Strategy Development, Business Transformation, Marketing Plan Development, Product Strategy, Breakout Strategy, Competitive Advantage, Mission, Vision, Values, Strategy Deployment & Execution, Innovation, Vision Statement, Core Competencies Analysis, Corporate Strategy, Product Launch Strategy, BMI, Blue Ocean Strategy, Breakthrough Strategy, Business Model Innovation, Business Strategy Example, Corporate Transformation, Critical Success Factors, Customer Segmentation, Customer Value Proposition, Distinctive Capabilities, Enterprise Performance Management, KPI, Key Performance Indicators, Market Analysis, Market Entry Example, Market Entry Plan, Market Intelligence, Market Research, Market Segmentation, Market Sizing, Marketing, Michael Porter's Value Chain, Organizational Transformation, Performance Management, Performance Measurement, Platform Strategy, Product Go-to-Market Strategy, Reorganization, Restructuring, SWOT, SWOT Analysis, Service 4.0, Service Strategy, Service Transformation, Strategic Analysis, Strategic Plan Example, Strategy Deployment, Strategy Execution, Strategy Frameworks Compilation, Strategy Methodologies, Strategy Report Example, Value Chain, Value Chain Analysis, Value Innovation, Value Proposition, Vision Statement, Corporate Strategy, Business Development, Business plan pdf, business plan, PDF, Business Plan DOC, Business Plan Template, PPT, Market strategy playbook, strategic market planning, competitive analysis tools, market segmentation frameworks, growth strategy templates, product positioning strategy, market execution toolkit, strategic alignment playbook, KPI and OKR frameworks, business growth strategy guide, cross-functional strategy templates, market risk management, market strategy PowerPoint doc, guide, ebook, e-book ,McKinsey Change Playbook, Organizational change management toolkit, Change management frameworks 2025, Influence model for change, Change leadership strategies, Behavioral change in organizations, Change management PowerPoint templates, Transformational leadership in change, supply chain KPIs, supply chain KPI toolkit, supply chain PowerPoint template, logistics KPIs, procurement KPIs, inventory management KPIs, supply chain performance metrics, manufacturing KPIs, supply chain dashboard, supply chain strategy KPIs, reverse logistics KPIs, sustainability KPIs in supply chain, financial supply chain KPIs, warehouse KPIs, digital supply chain KPIs, 1200 KPIs, supply chain scorecard, KPI examples, supply chain templates, Corporate Finance SOPs, Finance SOP Excel Template, CFO Toolkit, Finance Department Procedures, Financial Planning SOPs, Treasury SOPs, Accounts Payable SOPs, Accounts Receivable SOPs, General Ledger SOPs, Accounting Policies Template, Internal Controls SOPs, Finance Process Standardization, Finance Operating Procedures, Finance Department Excel Template, FP&A Process Documentation, Corporate Finance Template, Finance SOP Toolkit, CFO Process Templates, Accounting SOP Package, Tax Compliance SOPs, Financial Risk Management Procedures.
NOTE: Our digital products are sold on an "as is" basis, making returns and refunds unavailable post-download. Please preview and inquire before purchasing. Please contact us before purchasing if you have any questions! This policy aligns with the standard Flevy Terms of Usage.
Got a question about the product? Email us at support@flevy.com or ask the author directly by using the "Ask the Author a Question" form. If you cannot view the preview above this document description, go here to view the large preview instead.
Source: Best Practices in Integrated Financial Model Excel: Accounting Firm 10-Year 3 Statement Financial Model Excel (XLSX) Spreadsheet, SB Consulting
ABOUT THE AUTHOR
SB Consulting is dedicated to empowering businesses to communicate their ideas with impact. This consulting firm specializes in teaching organizations how to create effective corporate and management presentations. With training from top-tier global consulting firms, including McKinsey, BCG, and Porsche Consulting, extensive expertise in presentation design and ... [read more]
Ask the Author a Question
You must be logged in to contact the author.
