
Full Factorial DOE (Design of Experiment) (PowerPoint PPT Slide Deck)
PowerPoint (PPT) 48 Slides
BENEFITS OF THIS POWERPOINT DOCUMENT
- Factorial designs are more efficient than OFAT experiments.
- This document can be used as training material.
- This documents can be modified or change as per business requirement.
DOE PPT DESCRIPTION
This document of Full Factorial DOE (Design of Experiment) is prepare to provide understanding of Standard design. This will help the project owner in the Measure & Analyze phases of the DMAIC process. These presentations can be modified and re branded to your own business needs.
Chapter Objectives:
Understand how to create a standard order design.
Determine how to design and analyze full factorials.
Understand the concept of randomization.
This Full Factorial DOE presentation offers a comprehensive dive into the intricacies of experimental design, tailored for professionals seeking to optimize their process improvement initiatives. The slides break down complex statistical concepts into actionable insights, making it easier for your team to grasp and apply these methodologies effectively. The content is meticulously structured to guide you through the nuances of setting up and interpreting full factorial experiments.
The preview images reveal a detailed walkthrough of the steps involved in creating a standard order design. Visual aids and examples are used to illustrate key points, ensuring that even those new to DOE can follow along and implement the techniques. The presentation also covers the importance of randomization in experiments, highlighting how it can eliminate bias and improve the reliability of your results.
Designed with the needs of project owners in mind, this PPT is a valuable resource for the Measure and Analyze phases of the DMAIC process. The material is presented in a clear, concise manner, making it easy to customize and adapt to your specific business requirements. This presentation is an indispensable tool for any executive looking to drive data-driven decision-making in their organization.
Got a question about the product? Email us at support@flevy.com or ask the author directly by using the "Ask the Author a Question" form. If you cannot view the preview above this document description, go here to view the large preview instead.
MARCUS OVERVIEW
This synopsis was written by Marcus [?] based on the analysis of the full 48-slide presentation.
Executive Summary
The Full Factorial Design of Experiment (DOE) PowerPoint presentation provides a comprehensive overview of full factorial designs, emphasizing their utility in process improvement strategies. This presentation is ideal for professionals seeking to understand how to create standard order designs, analyze full factorials, and apply randomization concepts effectively. Users will gain insights into the practical applications of full factorial designs, particularly in scenarios requiring detailed analysis of multiple factors.
Who This Is For and When to Use
• Quality Assurance Managers focused on improving product quality through systematic experimentation
• Process Engineers looking to optimize manufacturing processes using statistical methods
• Operations Managers aiming to enhance efficiency and throughput in production
• Consultants specializing in Lean Six Sigma methodologies and process improvement
Best-fit moments to use this deck:
• During training sessions on statistical process control and experimental design
• When initiating new product development projects requiring rigorous testing
• In workshops focused on process optimization and quality improvement initiatives
Learning Objectives
• Define full factorial designs and their significance in experimentation
• Construct a standard order design for factorial experiments
• Analyze and interpret results from full factorial designs
• Understand the role of randomization in ensuring valid experimental outcomes
• Identify important factors affecting response variables in experiments
• Apply Six Sigma principles to analyze and improve process performance
Table of Contents
• Introduction to Full Factorial Designs (page 3)
• Standard Order for a Full Factorial (page 5)
• Statapult Experiment Overview (page 10)
• Cookie DOE Case Study (page 15)
• Analysis Techniques: Practical, Graphical, and Analytical (page 20)
• Interaction Effects in Full Factorial Designs (page 25)
• Creating Predictive Equations from Experimental Data (page 30)
• Executing a DOE: Key Questions and Considerations (page 35)
• Conclusion and Next Steps (page 40)
Primary Topics Covered
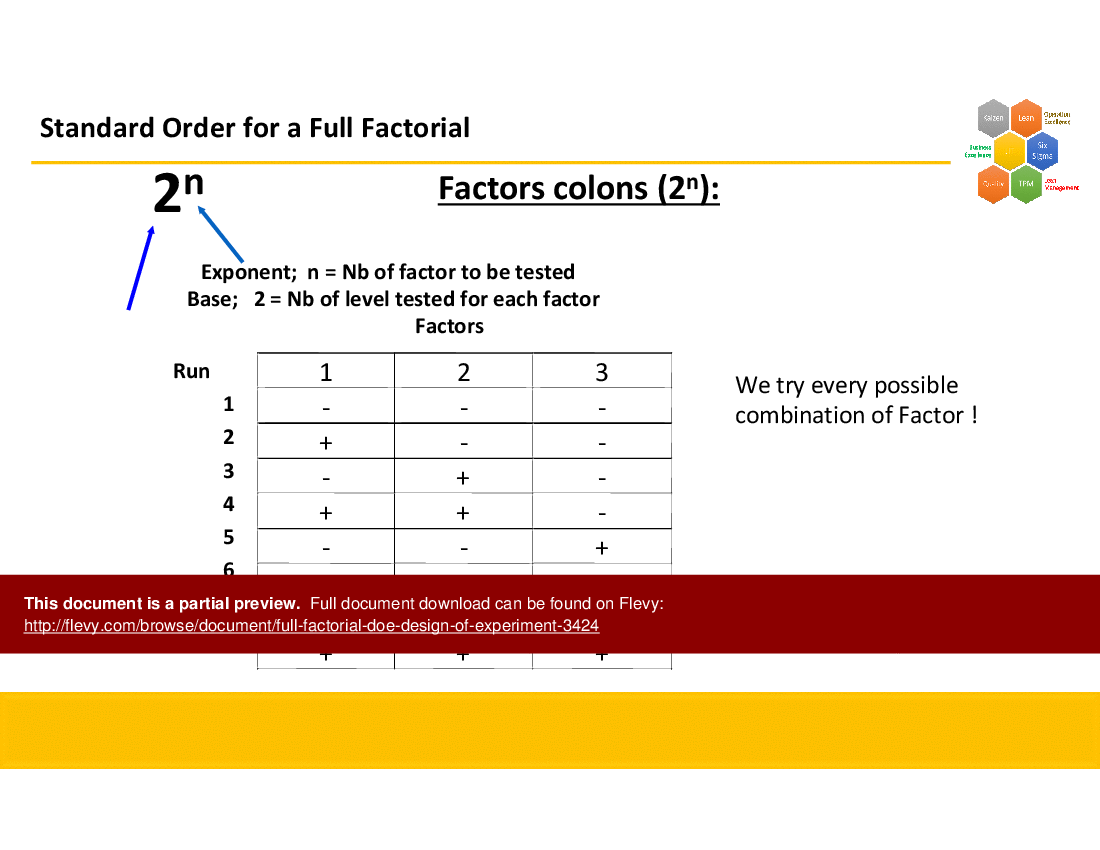
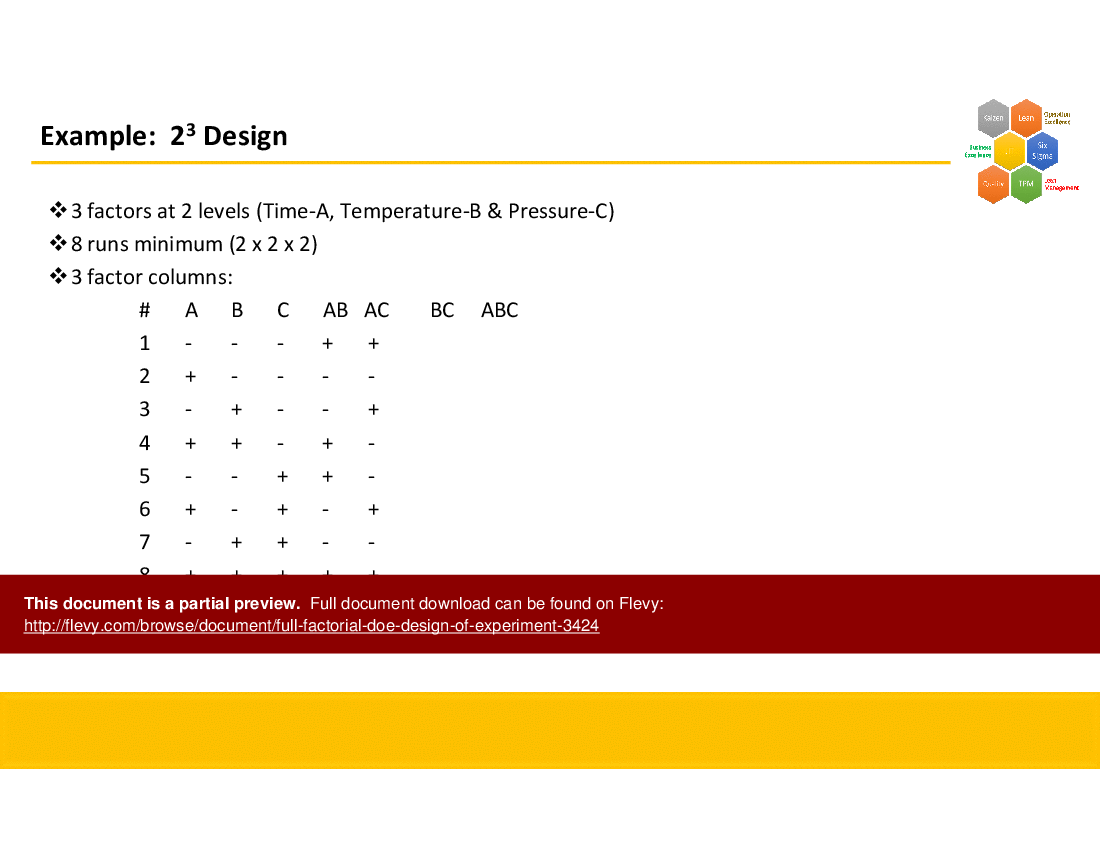
• Full Factorial Designs - These designs test every possible combination of factors, providing extensive information for analysis.
• Standard Order Design - A systematic approach to organizing experiments that ensures all combinations of factors are tested.
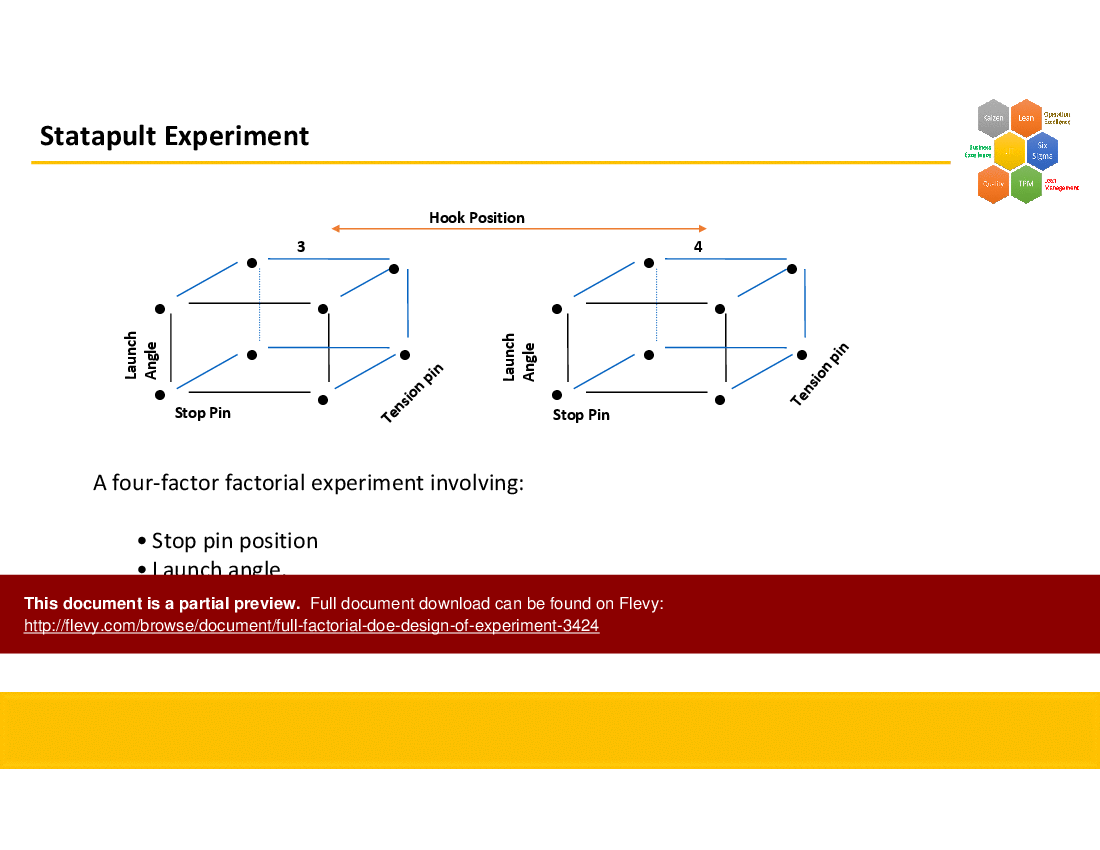
• Statapult Experiment - An illustrative example demonstrating the application of factorial designs in a practical setting.
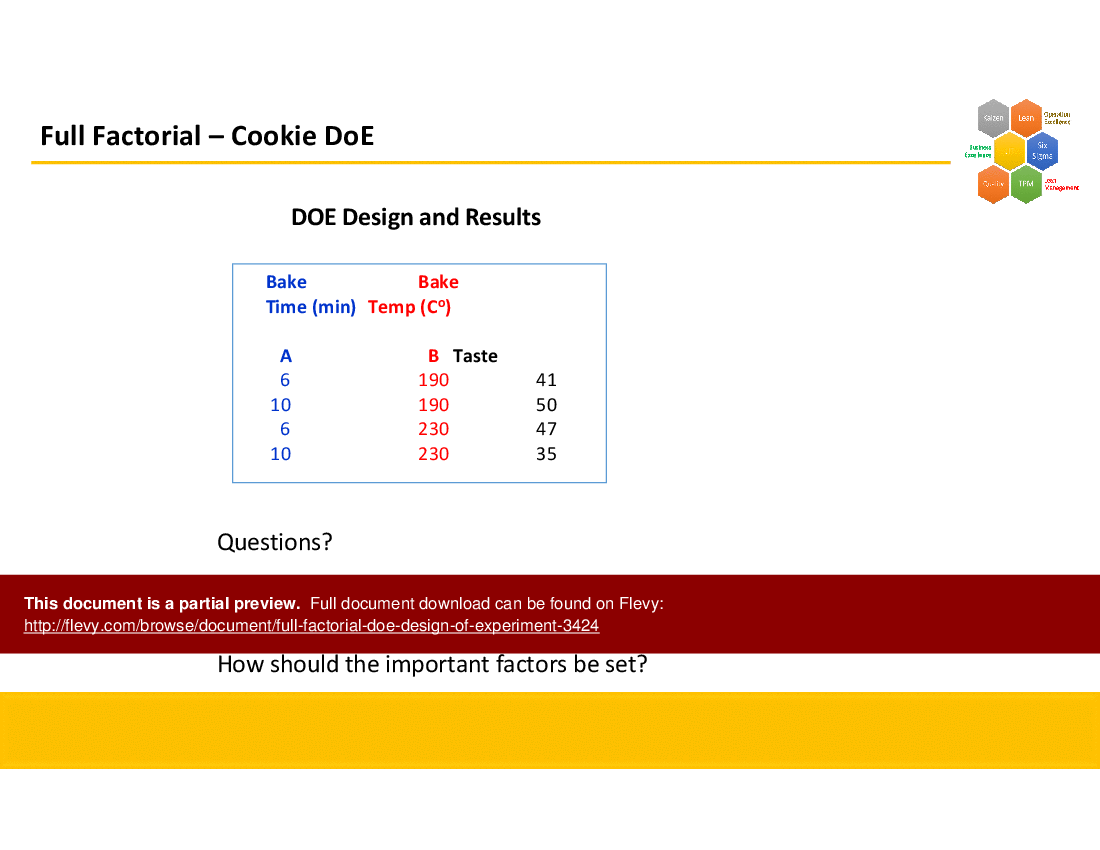
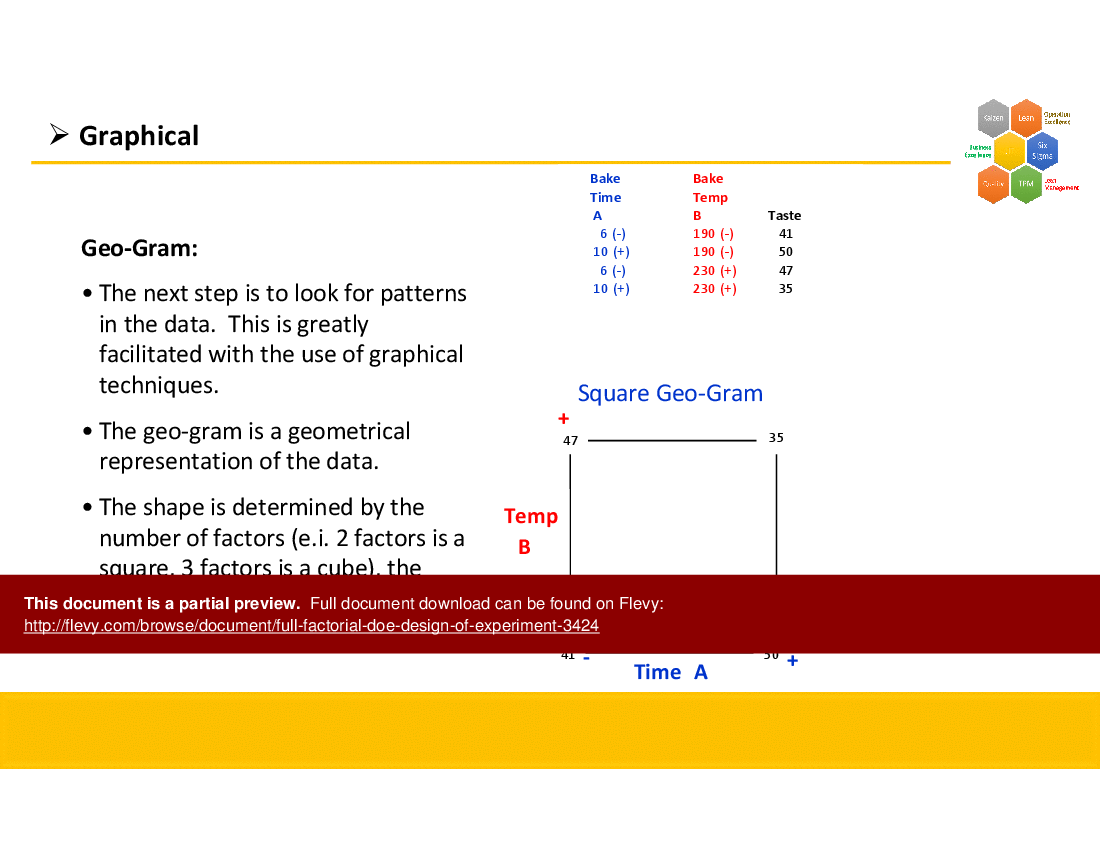
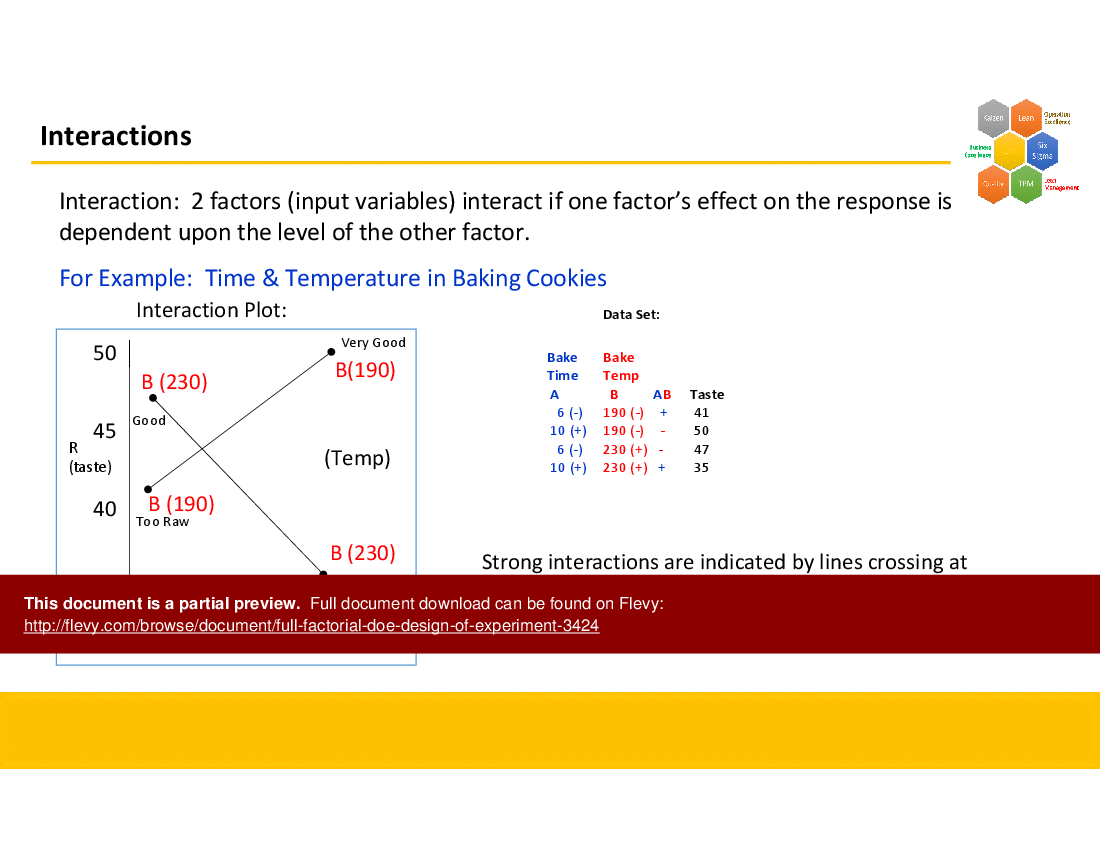
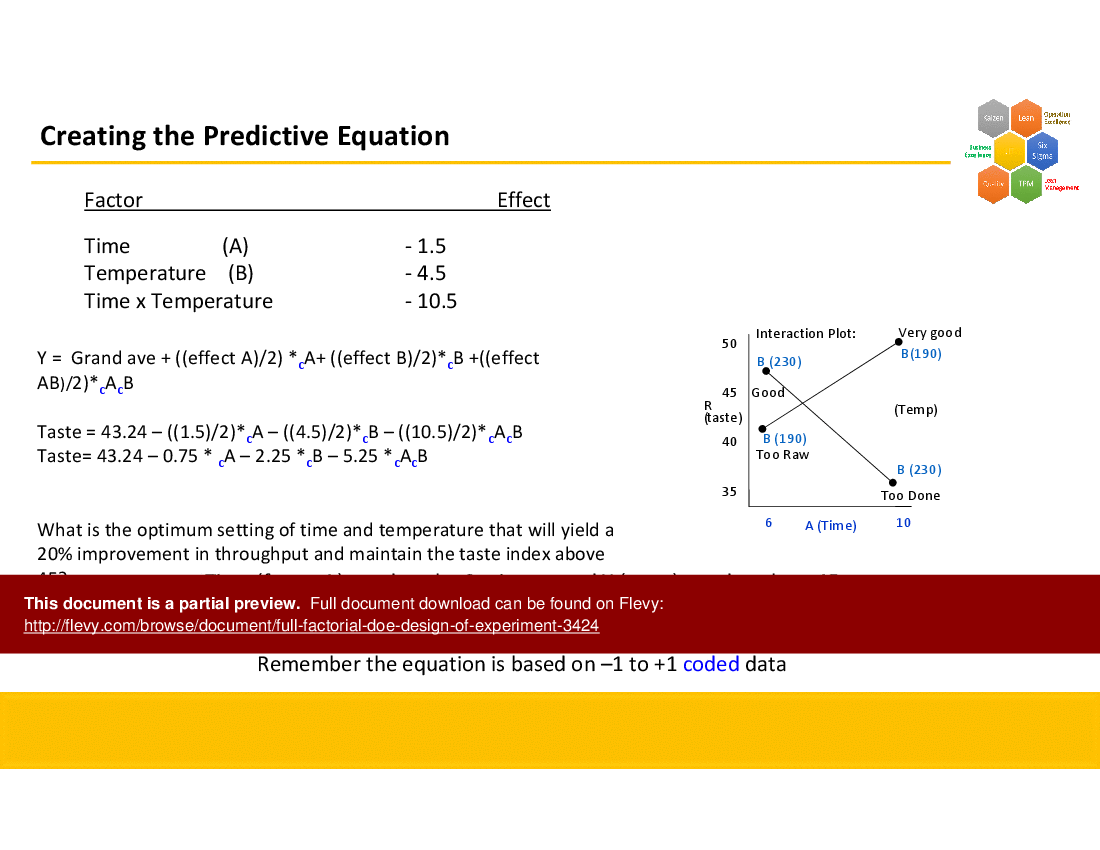
• Cookie DOE Case Study - A real-world scenario analyzing the effects of bake time and temperature on cookie quality.
• ANOG (Analysis of Good) - A method for identifying patterns in experimental data to inform decision-making.
• Interaction Effects - Understanding how 2 factors interact to influence the outcome of an experiment.
Deliverables, Templates, and Tools
• Standard order design templates for organizing factorial experiments
• Example data sets for practice in analyzing full factorial designs
• Graphical tools for visualizing interaction effects and results
• Predictive equation templates for deriving outcomes from experimental data
• Guidelines for conducting effective DOE sessions using statistical software
Slide Highlights
• Overview of Full Factorial Designs slide detailing their significance and applications
• Standard Order Design slide illustrating the coding system for factors
• Statapult Experiment slide showcasing practical applications of factorial designs
• Cookie DOE Case Study slide summarizing the objectives and results of the experiment
• Interaction Effects slide explaining the importance of factor interactions in analysis
Potential Workshop Agenda
Introduction to Full Factorial Designs (30 minutes)
• Overview of factorial designs and their applications
• Discussion on the importance of standard order designs
Hands-On Statapult Experiment (60 minutes)
• Conducting the experiment using the Statapult setup
• Recording and analyzing results
Cookie DOE Case Study Review (45 minutes)
• Analyzing the cookie baking experiment data
• Discussing implications for process improvement
Wrap-Up and Q&A Session (30 minutes)
• Addressing participant questions
• Discussing next steps for applying learned concepts
Customization Guidance
• Tailor the examples and case studies to reflect industry-specific scenarios relevant to your audience
• Adjust the statistical analysis techniques based on the familiarity of participants with statistical software
• Incorporate company-specific data sets for practical application during workshops
Secondary Topics Covered
• Basics of Six Sigma principles in relation to DOE
• The role of replication and repetition in experimental design
• Importance of randomization in ensuring valid results
• Techniques for analyzing variance in experimental data
Topic FAQ
What is a full factorial design and when is it appropriate to use one?
A full factorial design tests every possible combination of factor levels to reveal main effects and interactions. It is appropriate when the number of factors is manageable and detailed interaction information is needed; the overview notes typical use with 2–4 factors and comprehensive analysis of interactions and effects.How do I set up a standard order design for a factorial experiment?
Setting up a standard order design involves coding factor levels and arranging runs so every combination is tested, then applying randomization. The product provides a standard order design slide and editable templates to create and document the run order and coding system.What analysis techniques are commonly used to interpret full factorial DOE results?
Results are analyzed using practical, graphical, and analytical approaches, including ANOG for pattern identification, interaction plots to visualize factor interplay, and predictive equations to forecast outcomes. These methods are all covered as analysis techniques in the deck.How do interaction effects change how I interpret experimental outcomes?
Interaction effects mean the effect of one factor depends on another factor’s level, so looks at single-factor effects can be misleading. Proper interpretation requires graphical plots and analytical decomposition to quantify interactions, as demonstrated in the Interaction Effects slide and related examples.What should I look for in DOE templates if my team has limited time or budget?
Prioritize templates that speed setup and analysis: standard order design templates, example data sets for practice, graphical tools for interaction plots, and predictive equation templates. The Full Factorial DOE deck lists these deliverables as included items to accelerate implementation.How much workshop time should I plan to teach full factorial DOE to a mixed-skill team?
The product suggests a workshop agenda with timed modules: a 30-minute introduction, 60-minute hands-on Statapult experiment, 45-minute case study review, and a 30-minute wrap-up, totaling 165 minutes for a single-session workshop structure.How does randomization improve DOE validity and how is it addressed in training?
Randomization mitigates uncontrolled confounders by varying run order so external influences are balanced across treatments, improving result validity. The presentation explains the role of randomization and includes guidance for implementing it during DOE sessions and when using statistical software.Can DOE be applied to product development experiments like bake time and temperature for recipes?
Yes; full factorial DOE suits NPD scenarios that test combinations of process settings. The deck includes a Cookie DOE case study analyzing bake time and temperature impacts and shows how to derive predictive equations from experimental data.Document FAQ
These are questions addressed within this presentation.
What is a full factorial design?
A full factorial design tests every possible combination of factors, providing comprehensive insights into the effects of multiple variables on a response.
When should I use a full factorial design?
Use a full factorial design when you have a manageable number of factors (typically 2-4) and need detailed information about their interactions and effects.
What are the limitations of full factorial designs?
The main limitations are the significant resource requirements for larger numbers of factors, as the number of runs increases exponentially with each additional factor.
How does randomization affect experimental results?
Randomization helps mitigate the influence of uncontrolled variables, ensuring that the results are valid and reliable by mixing the effects of potential confounding factors.
What is the purpose of the Statapult experiment?
The Statapult experiment serves as a practical example to illustrate the application of full factorial designs in a controlled setting, allowing participants to engage in hands-on learning.
How can I analyze the results of a full factorial experiment?
Results can be analyzed using practical, graphical, and analytical methods, including ANOG, interaction plots, and predictive equations.
What is the significance of interaction effects in experiments?
Interaction effects indicate that the impact of one factor on the response variable depends on the level of another factor, highlighting the complexity of real-world processes.
How do I create a predictive equation from experimental data?
A predictive equation is created by calculating the effects of each factor and their interactions, allowing for forecasting of outcomes based on input variables.
Glossary
• Full Factorial Design - An experimental design that tests all possible combinations of factors.
• Standard Order Design - A systematic arrangement of experimental runs to ensure all combinations are tested.
• Randomization - The practice of randomly assigning treatment conditions to mitigate bias.
• Interaction Effect - The phenomenon where the effect of one factor depends on the level of another factor.
• ANOG - A method for identifying patterns in experimental data.
• Predictive Equation - A mathematical representation of the relationship between factors and response variables based on experimental data.
• Replication - Running the same experimental conditions multiple times to ensure reliability.
• Repetition - Conducting experiments under the same conditions without changing variables.
• Response Variable - The outcome measured in an experiment to assess the effects of factors.
• Factors - Variables that are manipulated in an experiment to observe their effects on the response variable.
• Levels - The specific values or settings of a factor in an experiment.
• Throughput - The rate at which a process produces output.
• Taste Index - A measure of the quality of a product based on sensory evaluation.
• Statistical Process Control - A method of monitoring and controlling a process through statistical analysis.
• Six Sigma - A set of techniques and tools for process improvement.
• Lean Management - A methodology focused on minimizing waste while maximizing productivity.
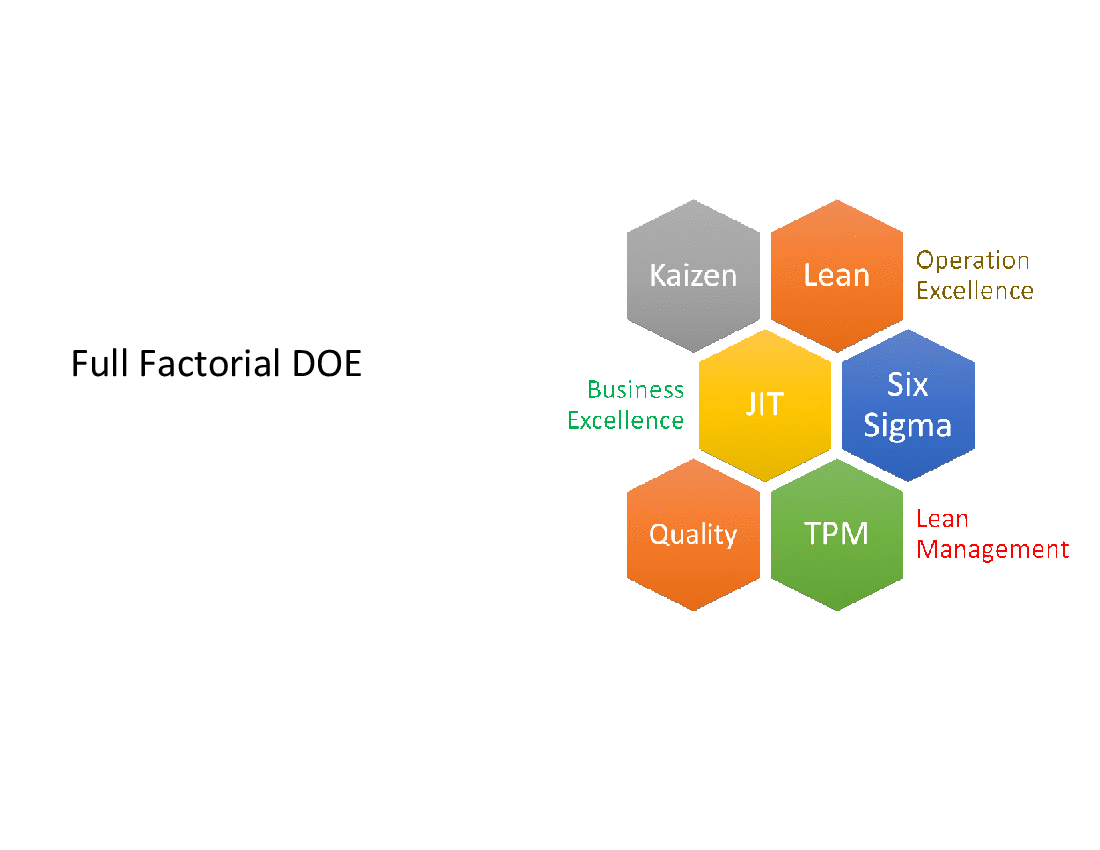
• Kaizen - A Japanese term meaning "continuous improvement."
• JIT (Just-In-Time) - An inventory strategy to increase efficiency and decrease waste by receiving goods only as they are needed.
• TPM (Total Productive Maintenance) - A maintenance program that aims to increase productivity by reducing downtime.
• Quality - The degree to which a product or service meets customer expectations.
Source: Best Practices in DOE PowerPoint Slides: Full Factorial DOE (Design of Experiment) PowerPoint (PPT) Presentation Slide Deck, Nishil Josh
