
 Click main image to view in full screen. Unlock all 15 preview images:
Vending Machine Profitability and Route Model – Excel XLSX
Excel (XLSX) + supplemental PDF


BENEFITS OF THIS DOWNLOADABLE EXCEL DOCUMENT
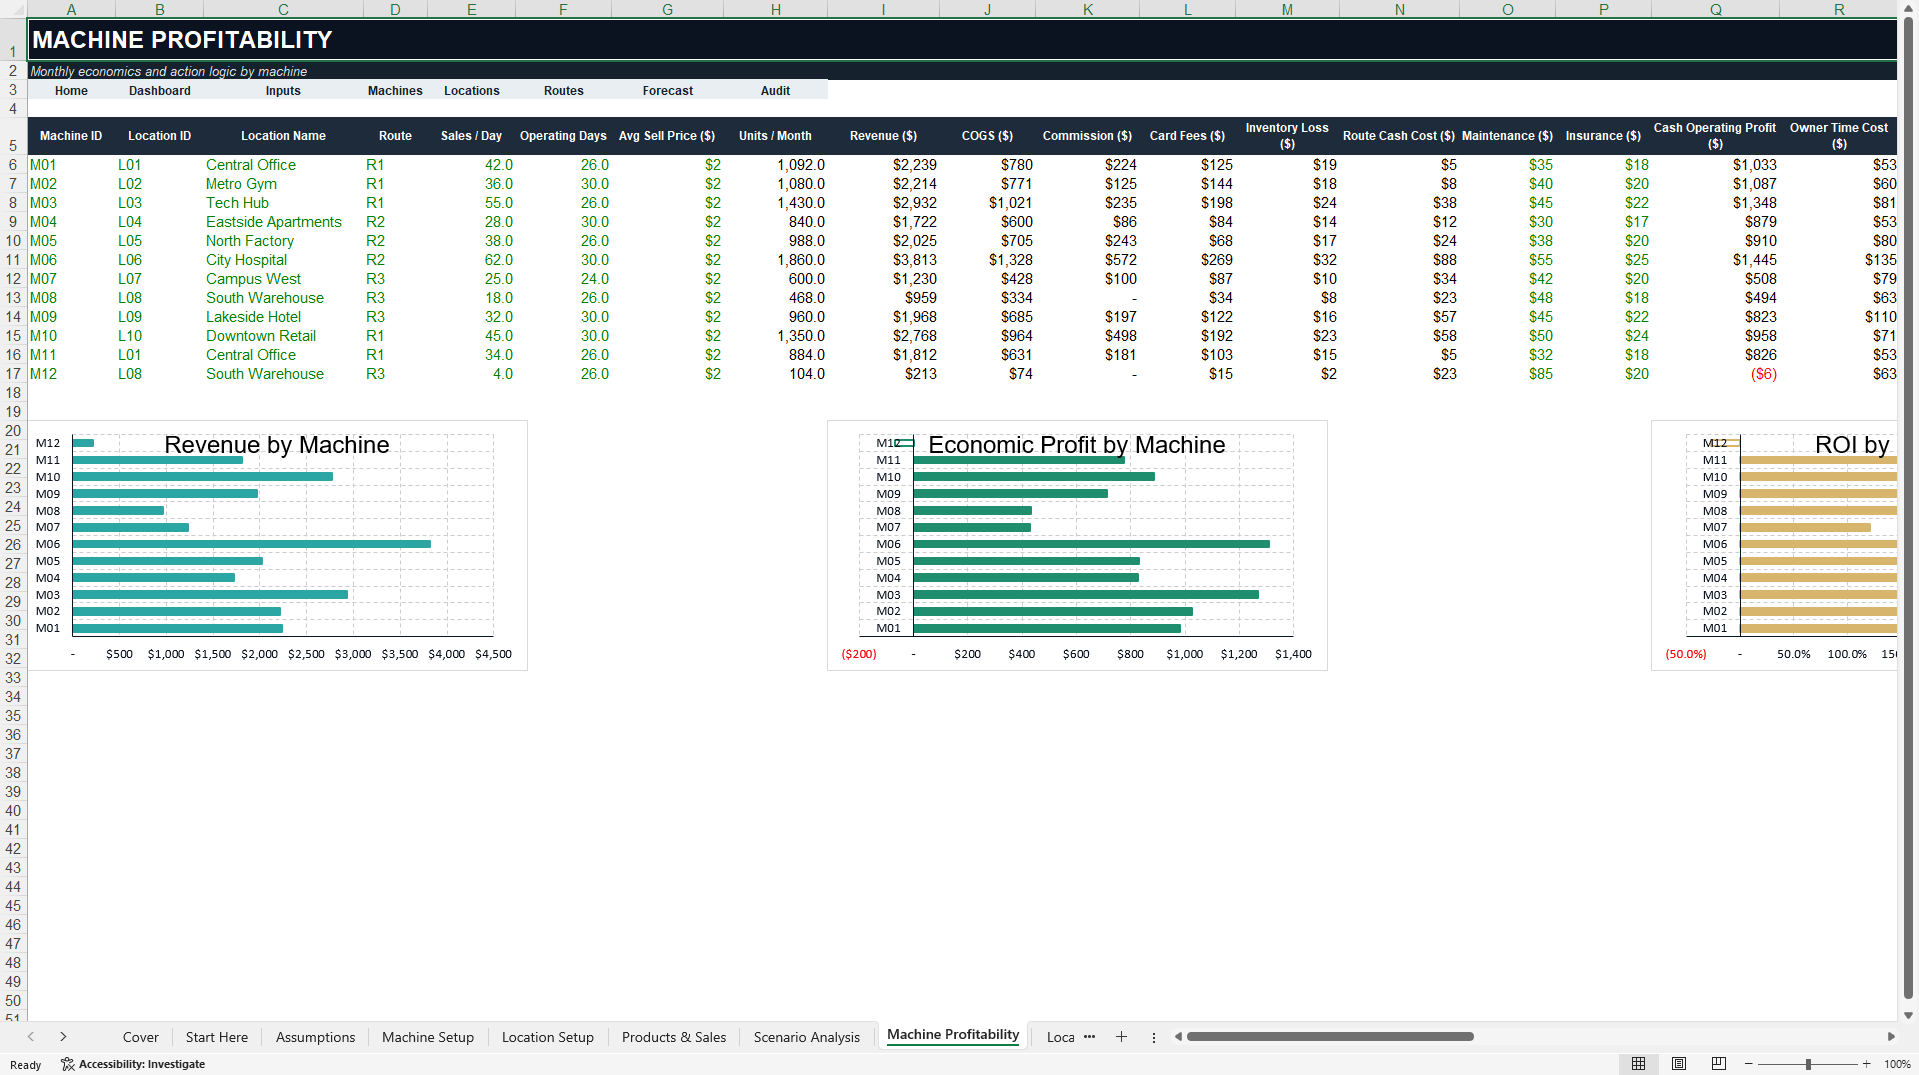
- Evaluates individual machine, location and route economics so users can see where revenue is actually converting into profit after commissions, card fees, servicing costs and owner time.
- Supports purchase and expansion decisions with financing, break-even, cash payback, ROI, sensitivity analysis, five-year forecasting and +1/+3/+5 machine scenarios.
- Turns operating data into clear action through professional dashboards, 27 audit controls and formula-driven KEEP / RELOCATE / REMOVE and BUY / REVIEW / DO NOT BUY indicators.
INTEGRATED FINANCIAL MODEL EXCEL DESCRIPTION
💼 VENDING MACHINE PROFITABILITY AND ROUTE MODEL
This premium Excel template is designed for first-time vending investors, side-hustle operators, existing vending-machine owners and small route businesses that need more than a simple sales tracker. It converts real operating drivers into a structured view of machine profitability, location quality, route efficiency, break-even, cash payback, financing and expansion potential.
📊 WHAT THE MODEL DOES
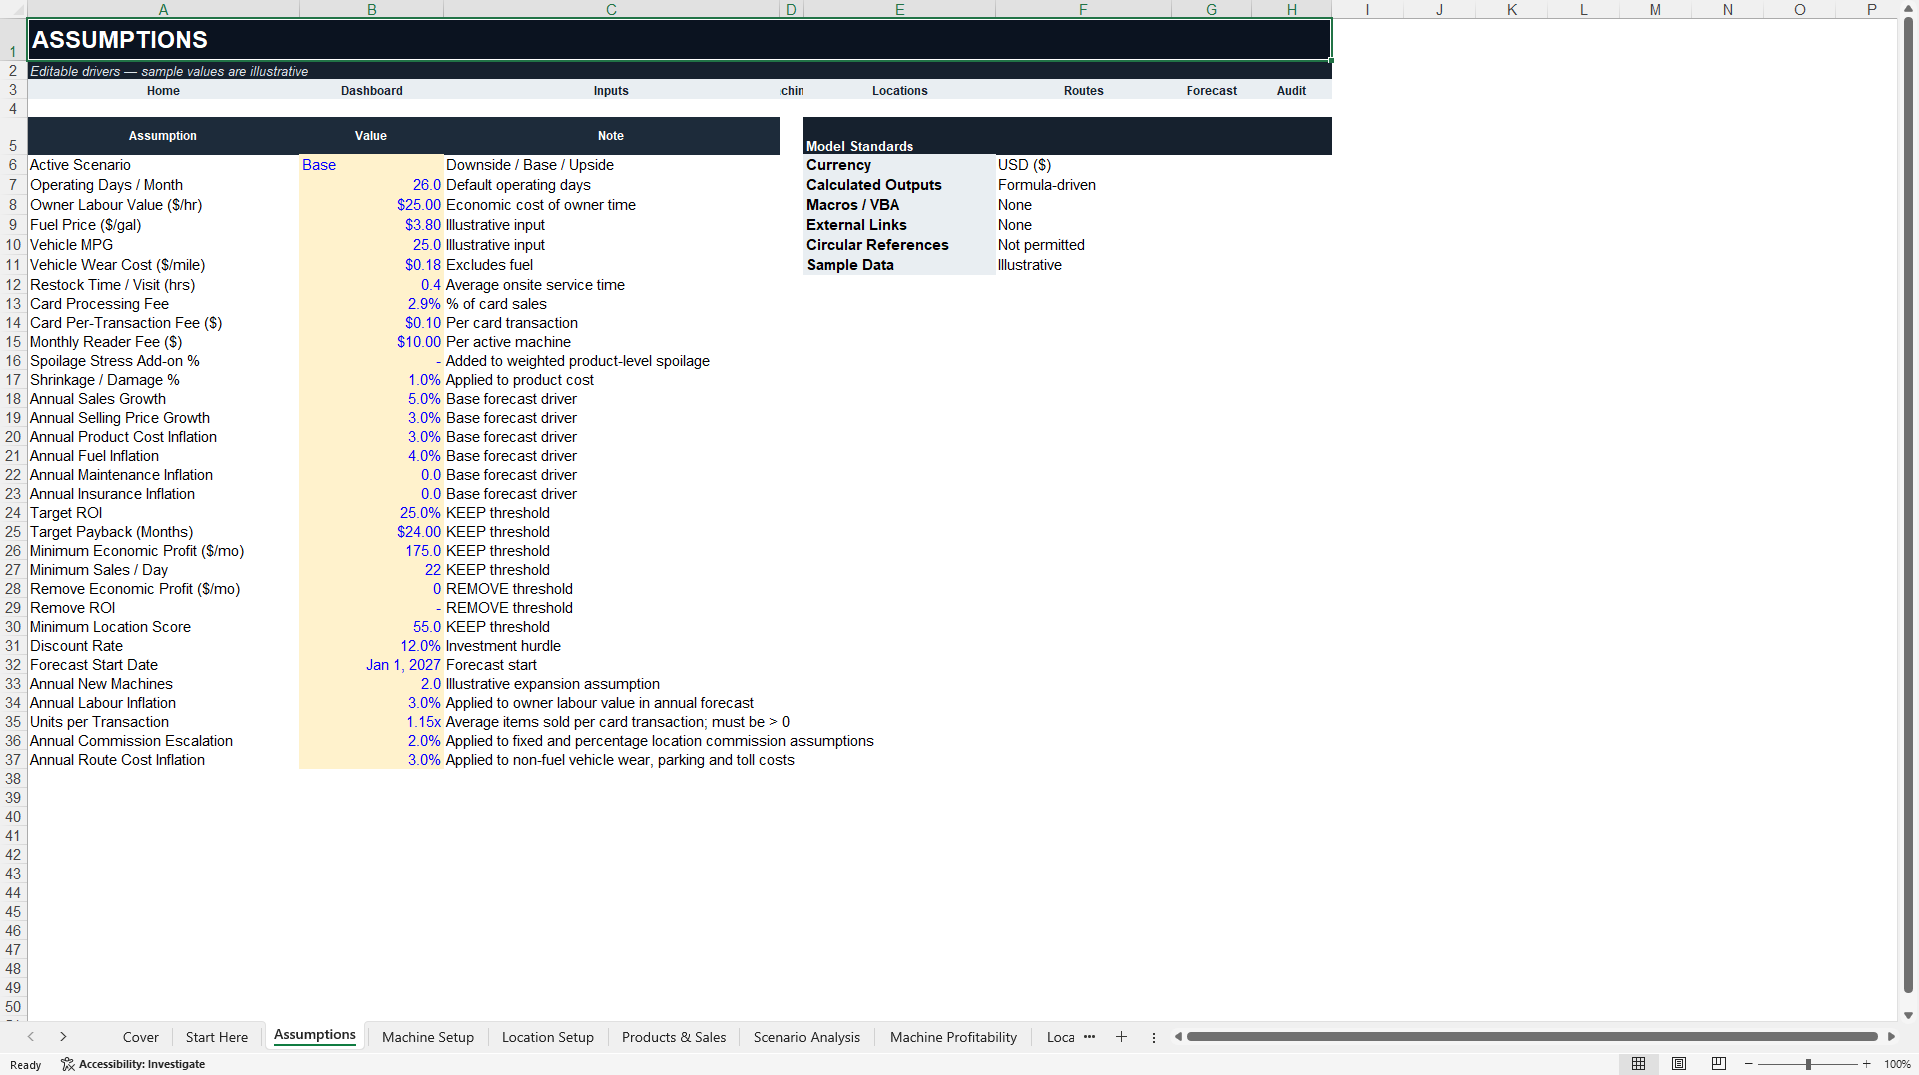
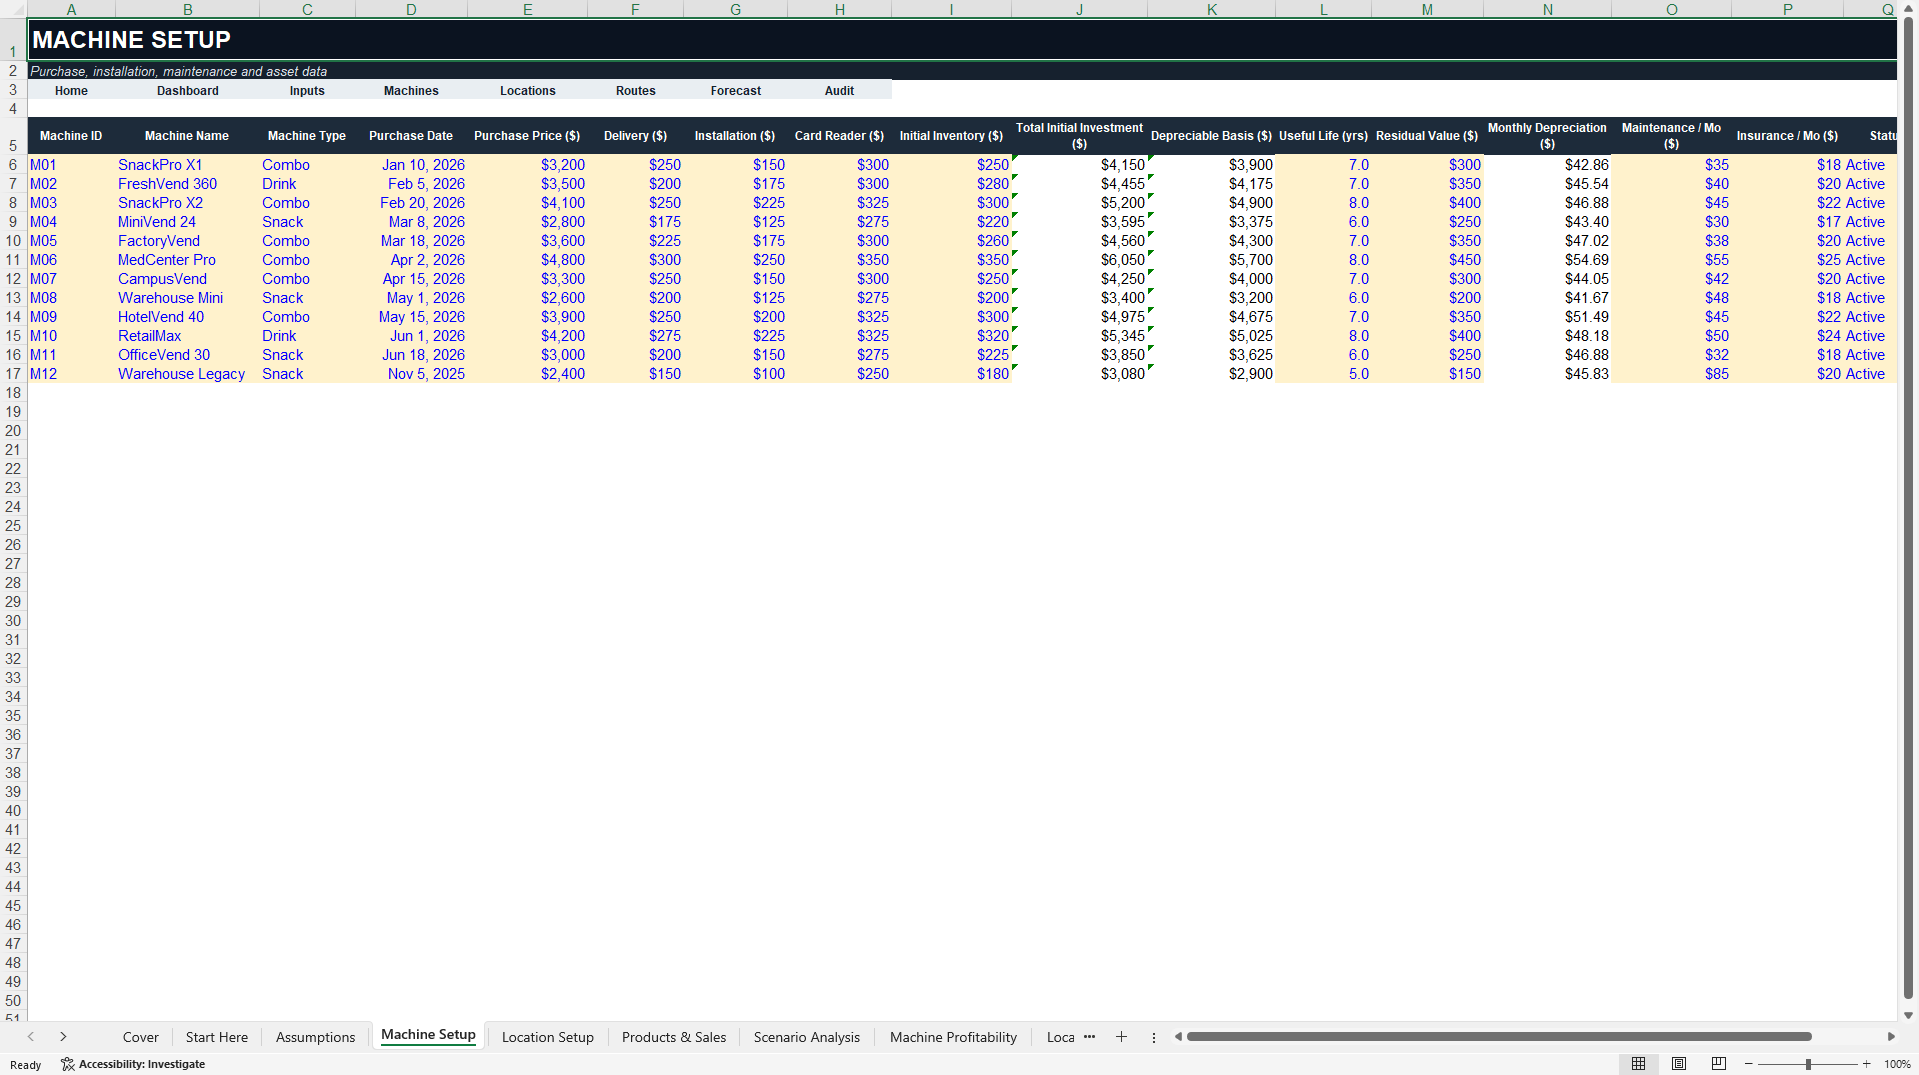
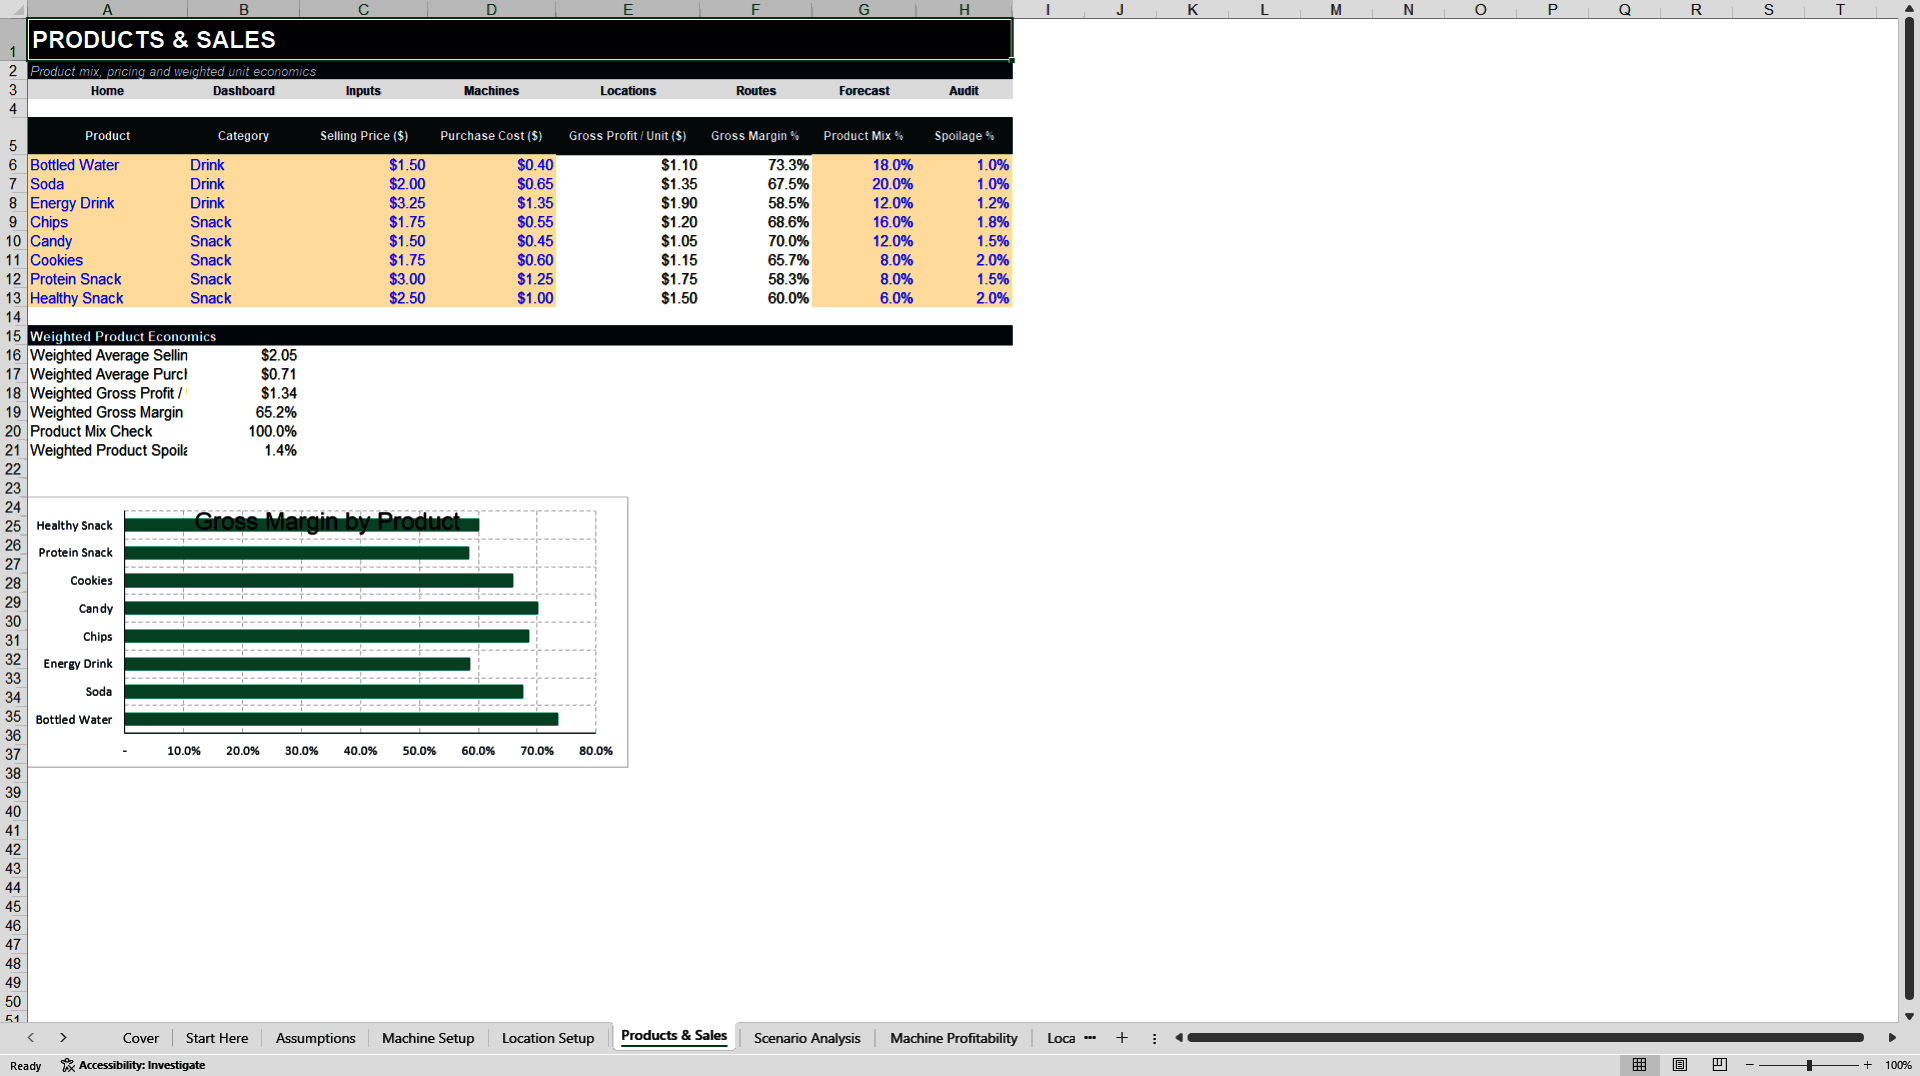
The workbook evaluates each machine independently. Users can enter machine purchase cost, setup costs, sales per day, product mix, selling prices, product costs, cash/card split, card-processing fees, location commission, spoilage, shrinkage, maintenance, insurance and servicing assumptions. These drivers flow into monthly and annual revenue, operating costs, cash operating profit, economic profit, ROI, payback and break-even sales per day.
📍 LOCATION AND ROUTE ECONOMICS
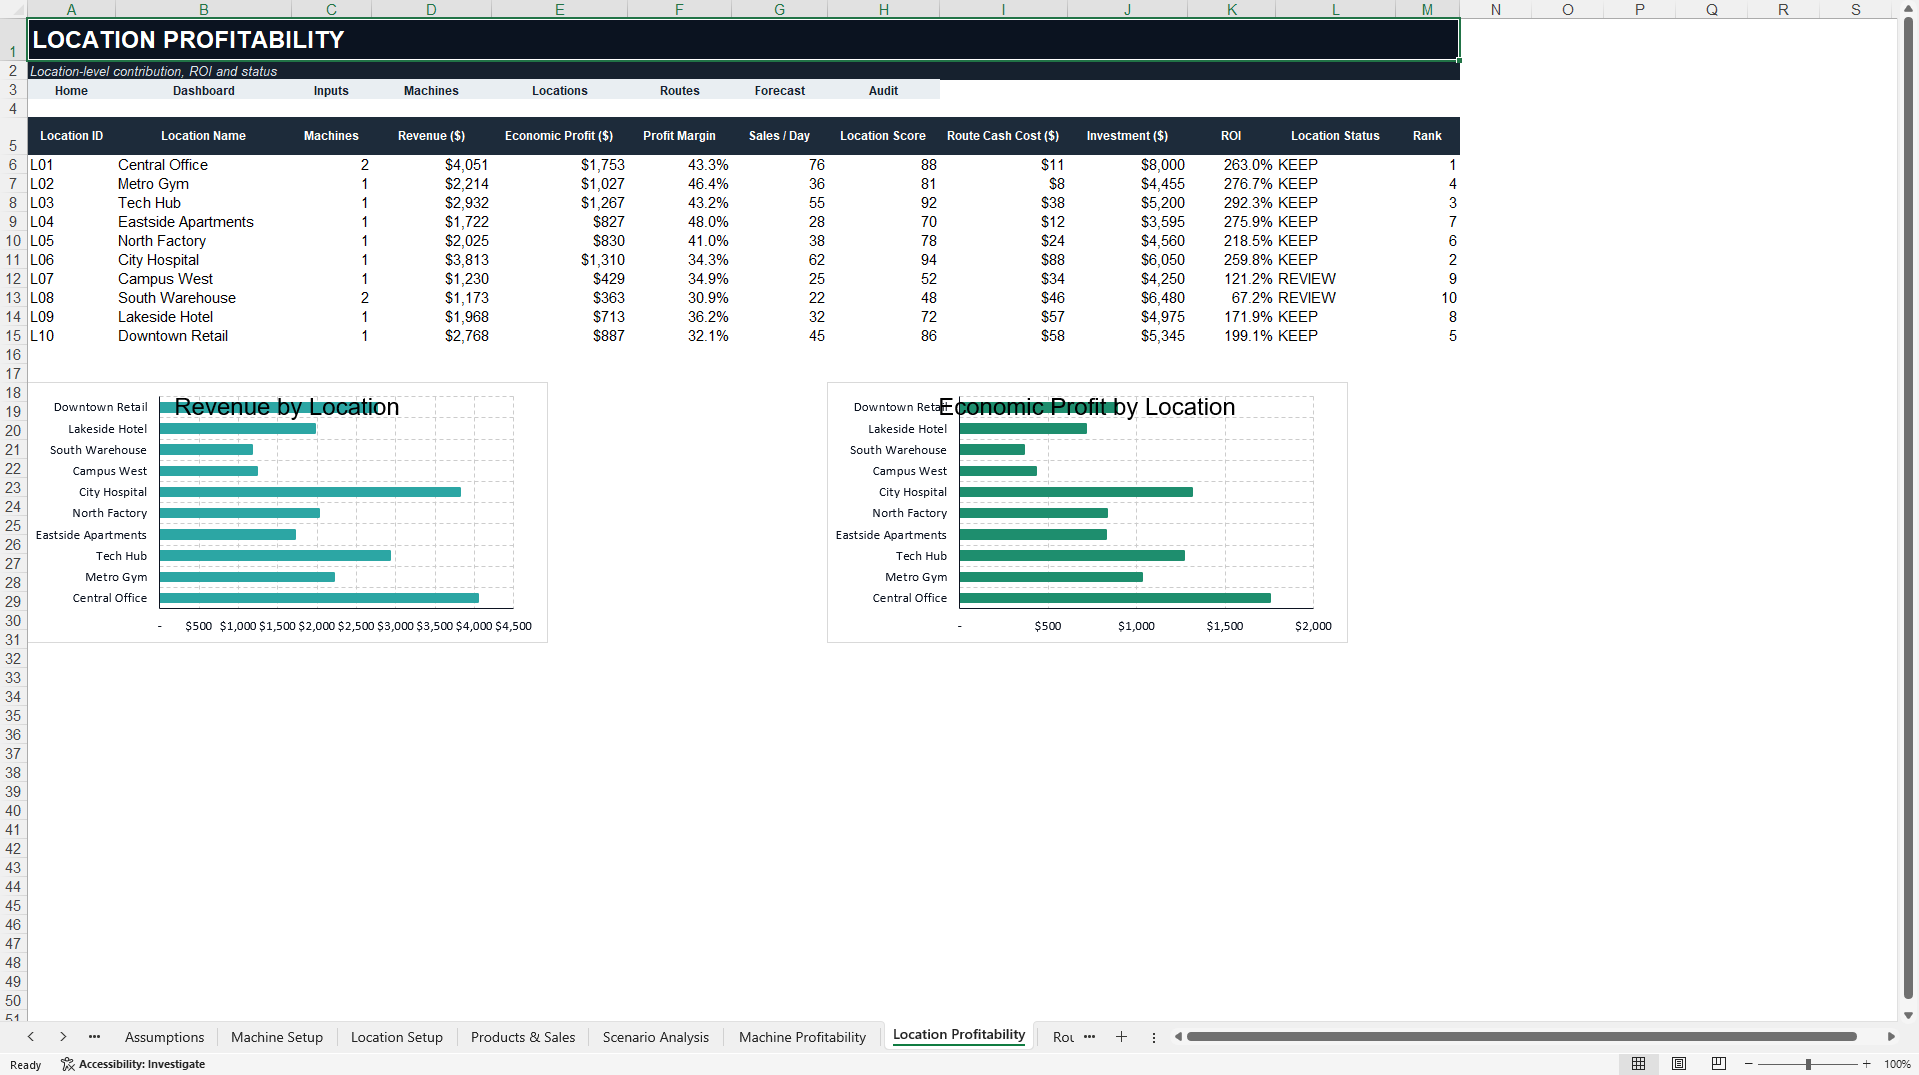
Vending profitability is highly dependent on placement and servicing efficiency. The model therefore analyzes location economics separately from route economics. Location outputs include revenue, profit, commission burden, margin, ROI, payback and a location score. Route outputs include miles, hours, route cash cost, owner-time cost, revenue per mile, profit per mile, revenue per hour and profit per hour.
A route-density view helps users understand why a remote machine can underperform even when its sales are acceptable.
🟢 KEEP / RELOCATE / REMOVE
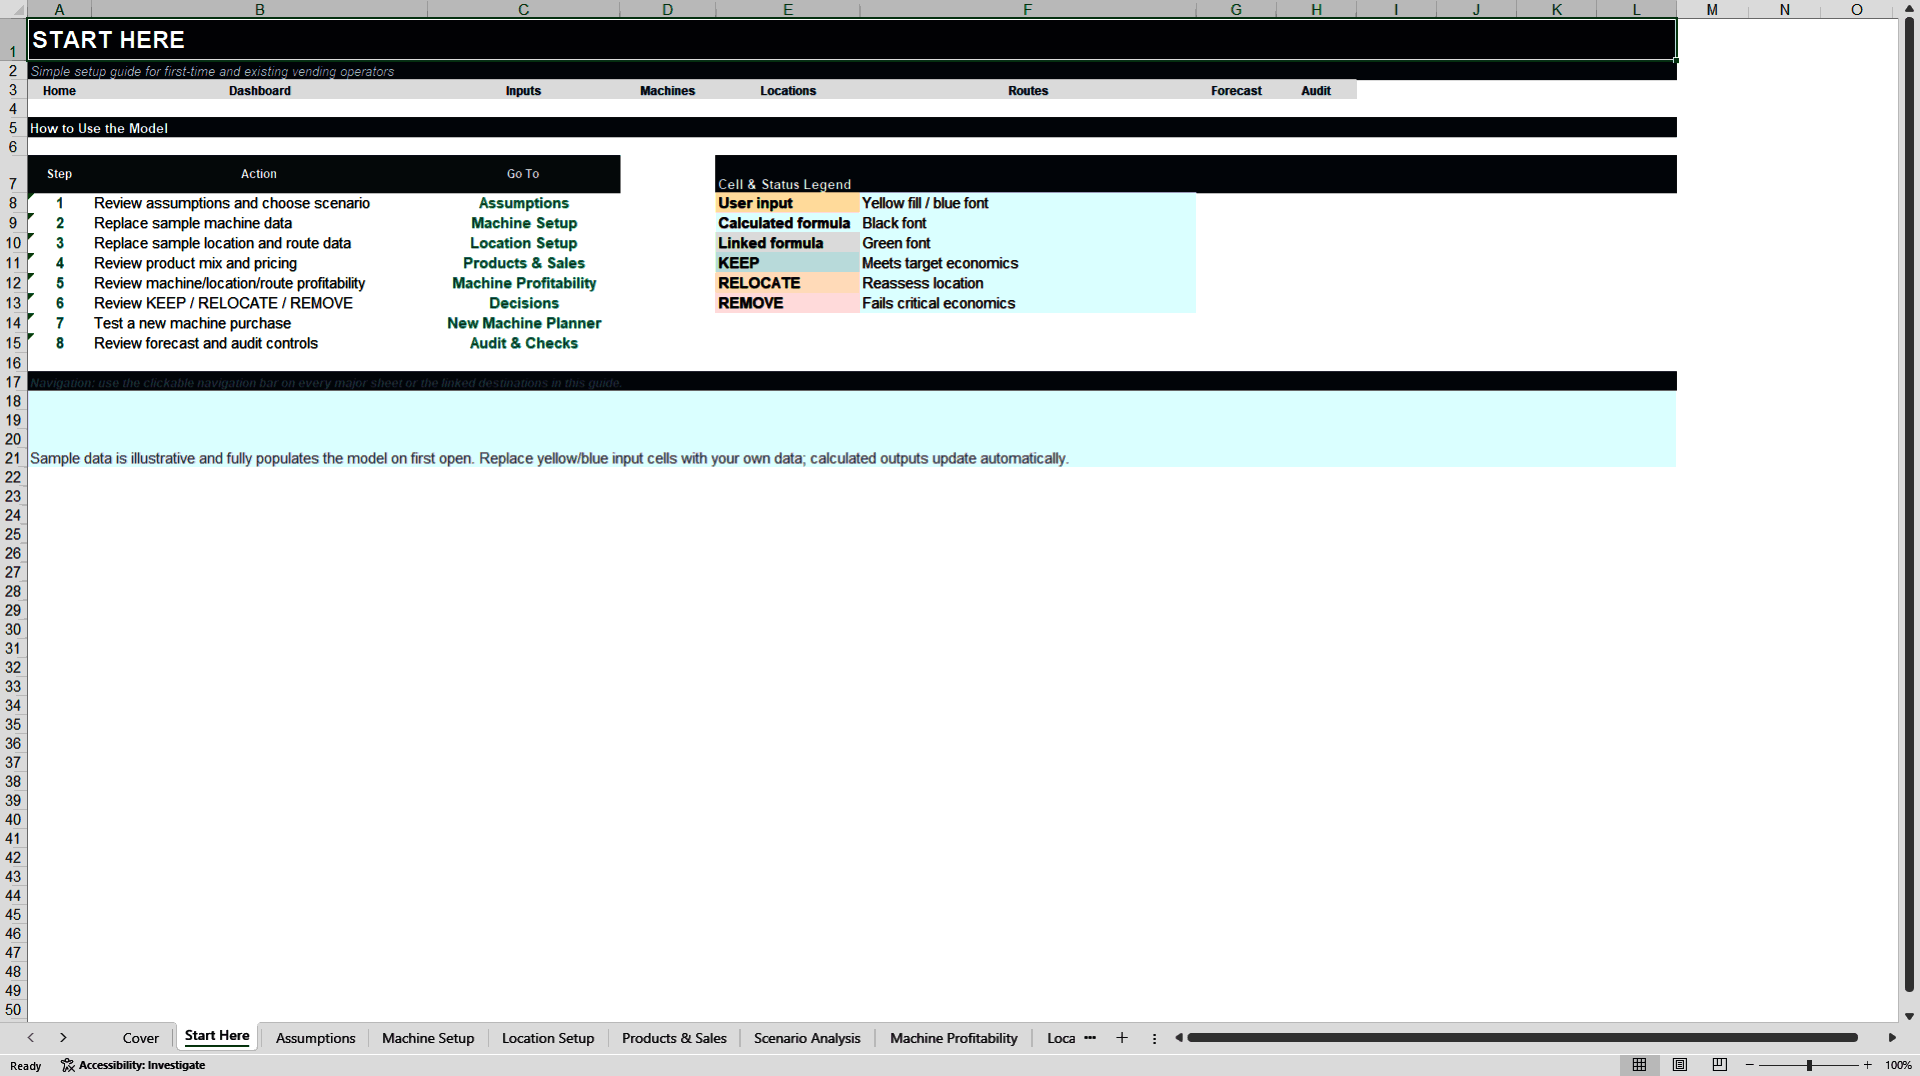
The workbook includes a formula-driven decision framework that automatically classifies each active machine as KEEP, RELOCATE or REMOVE based on its economics and user-defined thresholds. A confidence indicator helps distinguish clear recommendations from borderline cases.
This feature is especially useful for existing operators deciding which machines deserve more attention, which locations should be renegotiated, and where capital is being tied up without sufficient return.
🆕 NEW MACHINE AND EXPANSION PLANNING
The New Machine Planner answers a practical question: Should I buy another machine?
Enter the proposed machine cost, installation, card reader, initial inventory, expected sales, commission, route requirements, maintenance, insurance and financing. The model calculates initial investment, monthly revenue, cash and economic profit, ROI, cash payback, break-even sales, debt payment, cash required and DSCR, then provides a BUY, REVIEW or DO NOT BUY planning signal.
Expansion scenarios model the impact of adding 1, 3 or 5 machines, including route-density benefits and incremental investment, revenue and economic profit.
🏦 FINANCING, PAYBACK AND FORECASTING
The financing section includes loan amount, down payment, interest rate, term, debt payment, principal, interest and ending balance. Depreciation is modeled separately from cash economics.
A dedicated break-even and payback section compares actual sales with required break-even sales. The five-year forecast includes a 12-month operating forecast and annual Years 1-5 expansion outlook with machine count, revenue, variable costs, cash fixed operating costs, cash operating profit, owner-time cost, economic profit, debt service, growth capex and equity free cash flow.
🎯 SCENARIO AND SENSITIVITY ANALYSIS
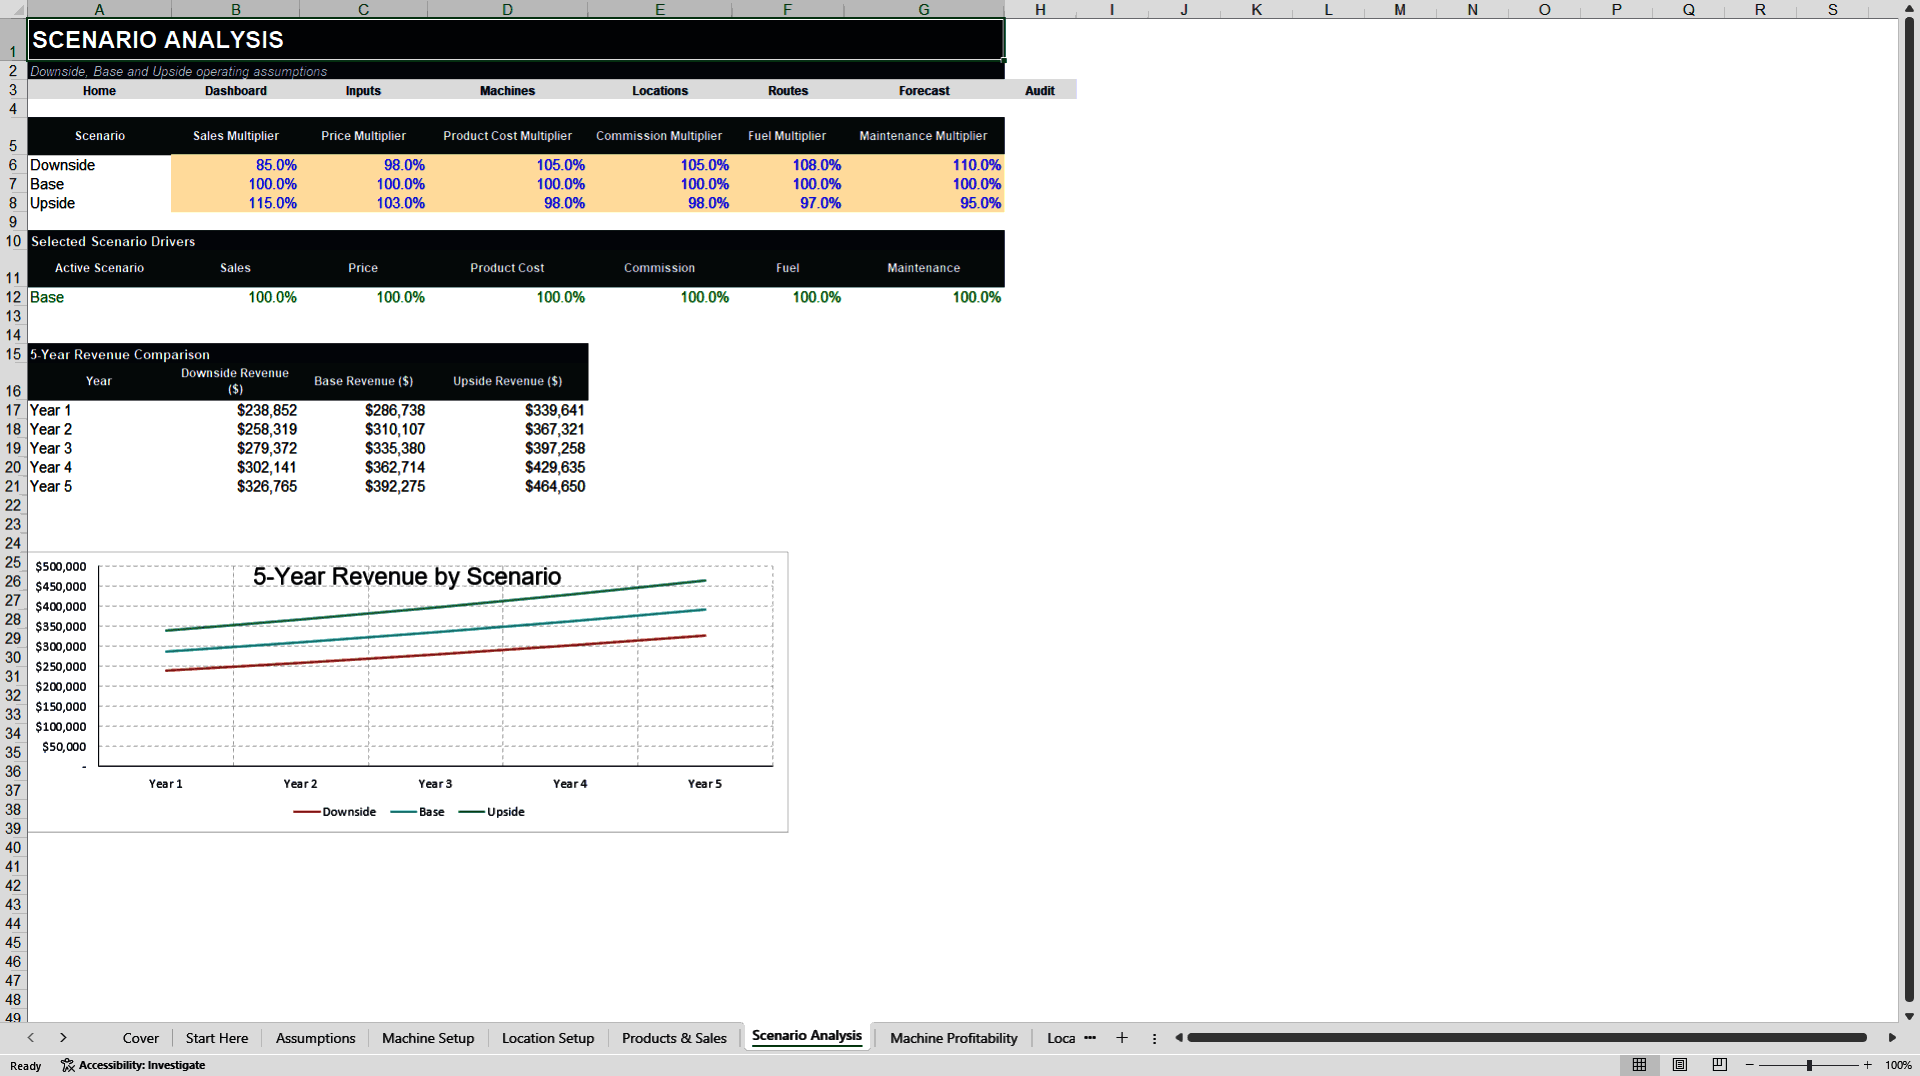
Users can test Downside, Base and Upside cases. Sensitivity tables show how machine ROI and payback change under different sales-per-day and machine-cost assumptions.
📈 DASHBOARDS, CHARTS AND AUDIT CONTROLS
The 20-sheet workbook contains 27 professional charts across the dashboard and analytical sheets. The Executive Dashboard summarizes active machines, monthly revenue, economic profit, average ROI, average cash payback, revenue per machine, profit per machine, profit per mile and KEEP / RELOCATE / REMOVE counts.
The Audit & Checks sheet contains 27 formula-driven controls covering product mix, cash/card allocation, machine P&L identities, location and route reconciliation, decision coverage, depreciation, debt, forecast roll-forwards, seasonality, payback and free cash flow.
📦 INCLUDED
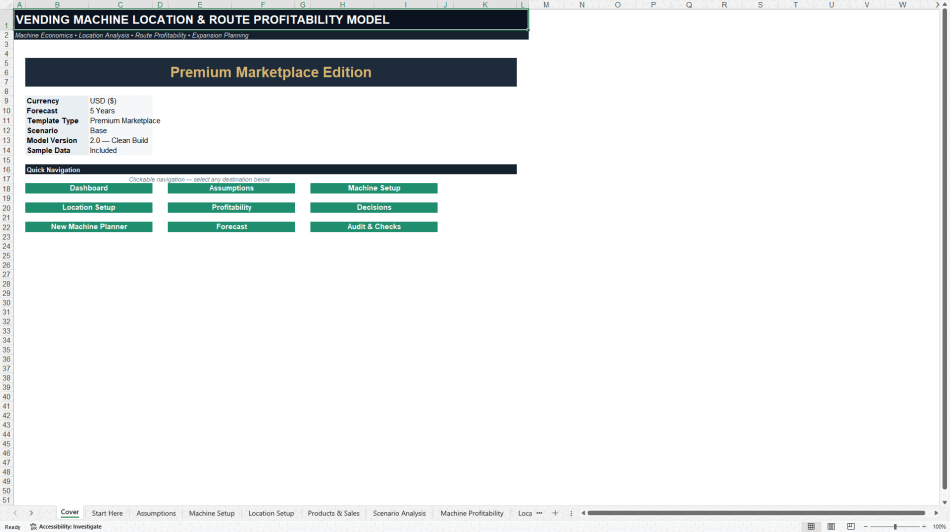
The purchase includes one fully editable Microsoft Excel workbook with realistic sample data for 12 machines, 10 locations and 3 routes. The file is macro-free and includes internal navigation, instructions, a disclaimer, scenario analysis, sensitivity analysis and five-year forecasting.
⚠️ IMPORTANT
All included operating and financing assumptions are illustrative. Users should replace sample values with their own information and independently validate assumptions before making business, financing or investment decisions. The workbook is a planning tool and is not financial, legal, tax, accounting, lending or investment advice.
Got a question about the product? Email us at support@flevy.com or ask the author directly by using the "Ask the Author a Question" form. If you cannot view the preview above this document description, go here to view the large preview instead.
Source: Best Practices in Integrated Financial Model Excel: Vending Machine Profitability and Route Model Excel (XLSX) Spreadsheet, PDMM Financial Models
ABOUT THE AUTHOR

PDMM Financial Models develops professional, decision-ready Excel models for business owners, entrepreneurs, investors, consultants, analysts, and finance teams. Our objective is to transform complex business assumptions into clear, structured analysis that supports better planning and investment decisions.
Our models cover business planning, forecasting, budgeting, feasibility analysis,
... [read more]
Ask the Author a Question
You must be logged in to contact the author.




























