
 Click main image to view in full screen. Unlock all 9 preview images:
Utility-Scale Solar PV Debt Sizing & P50 Bias Model – Excel XLSX
Excel (XLSX) + supplemental PDF


BENEFITS OF THIS DOWNLOADABLE EXCEL DOCUMENT
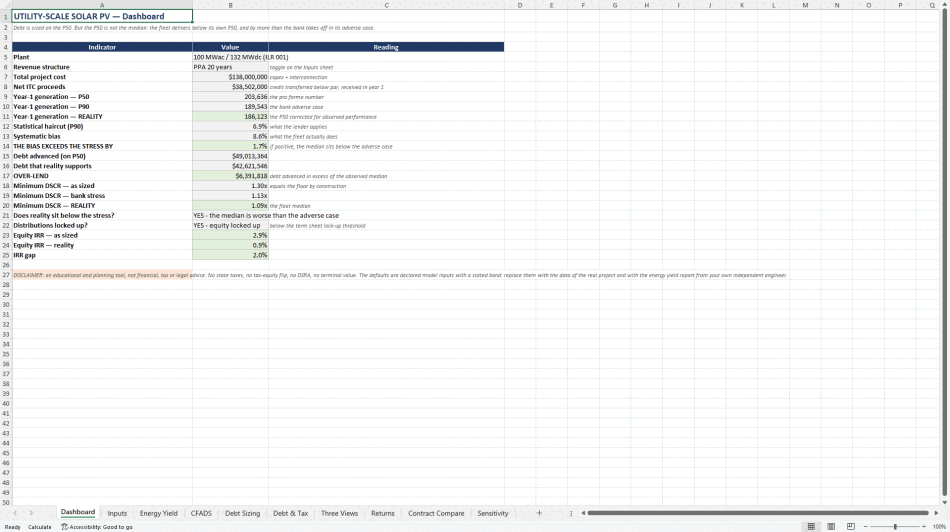
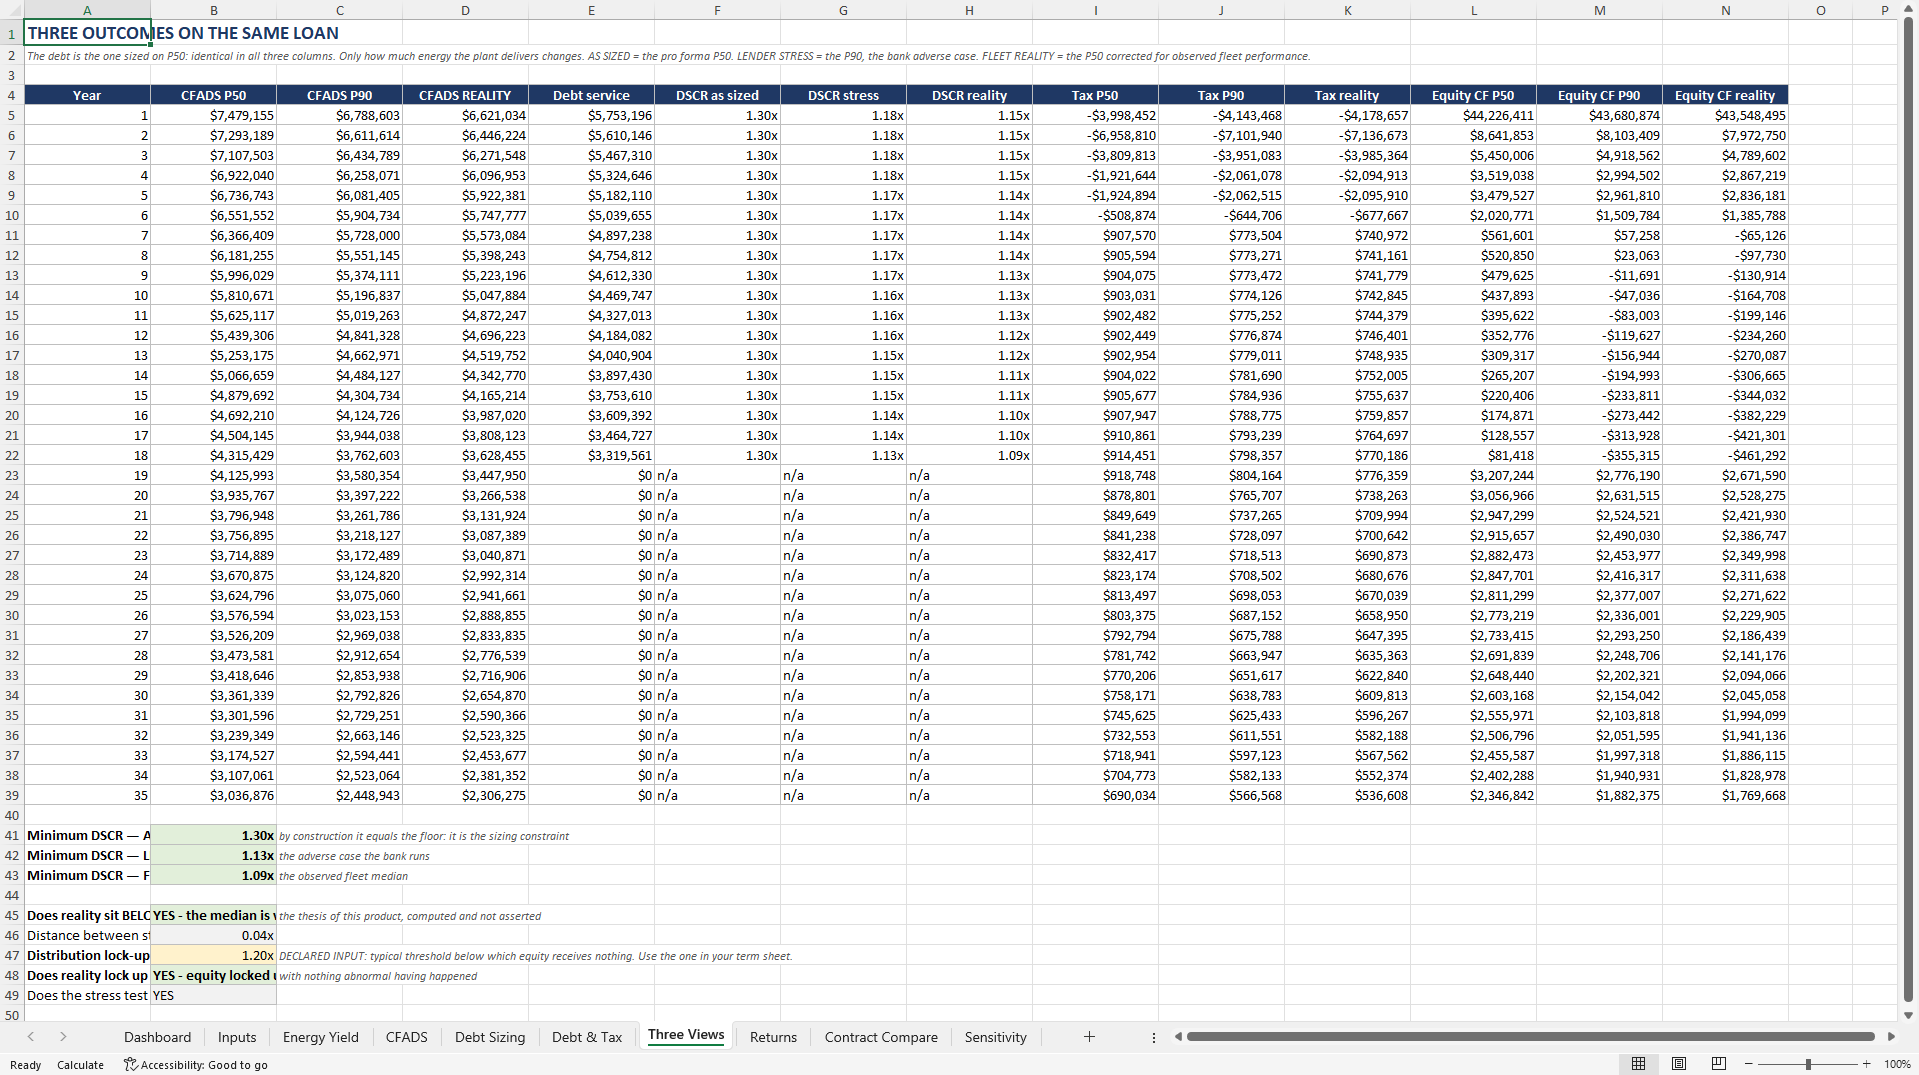
- Run one loan through three production cases, P50 as sized, the bank's adverse case and the empirically corrected median, and watch a 1.30x DSCR read 1.1335x and then 1.0931x.
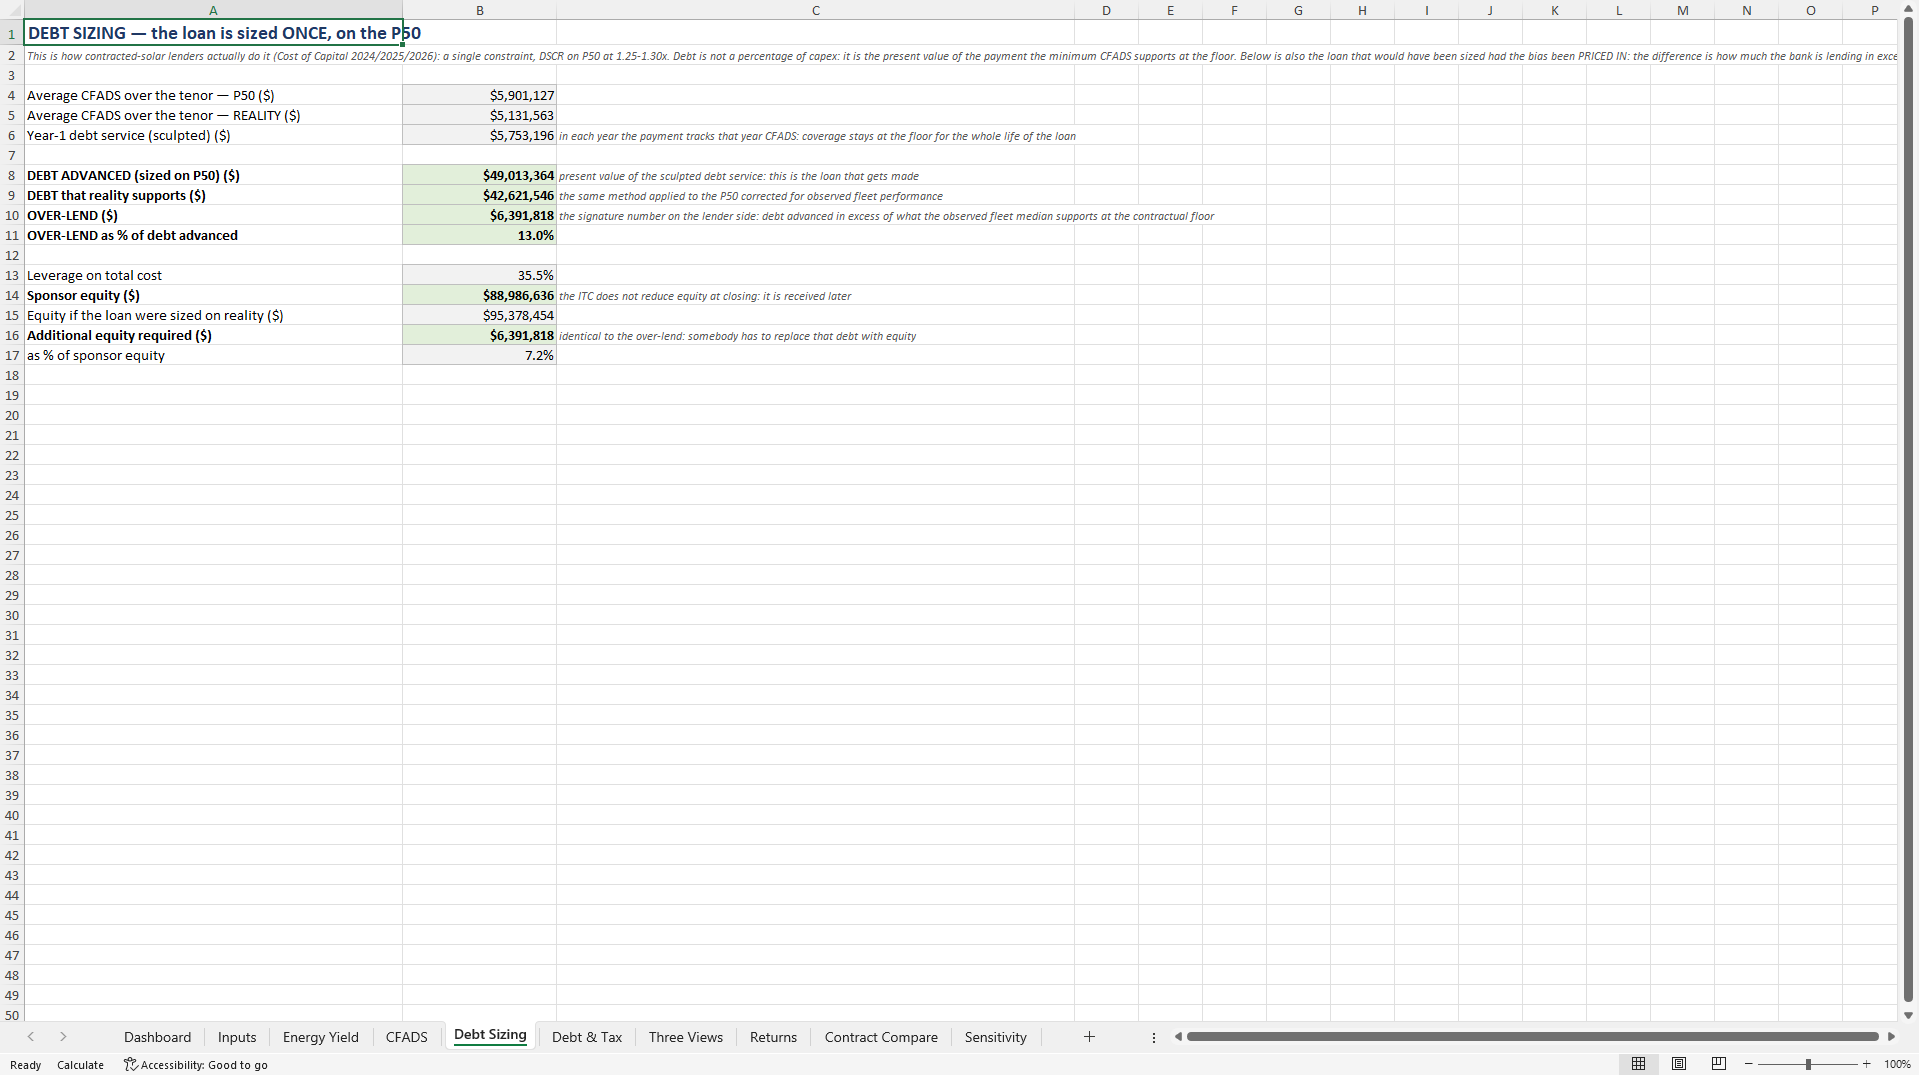
- Quantify the sizing error in money rather than in percentage points: $6,391,818 of over-lending, 13.0% of the facility, and $25,659,449 of revenue underwritten but never produced.
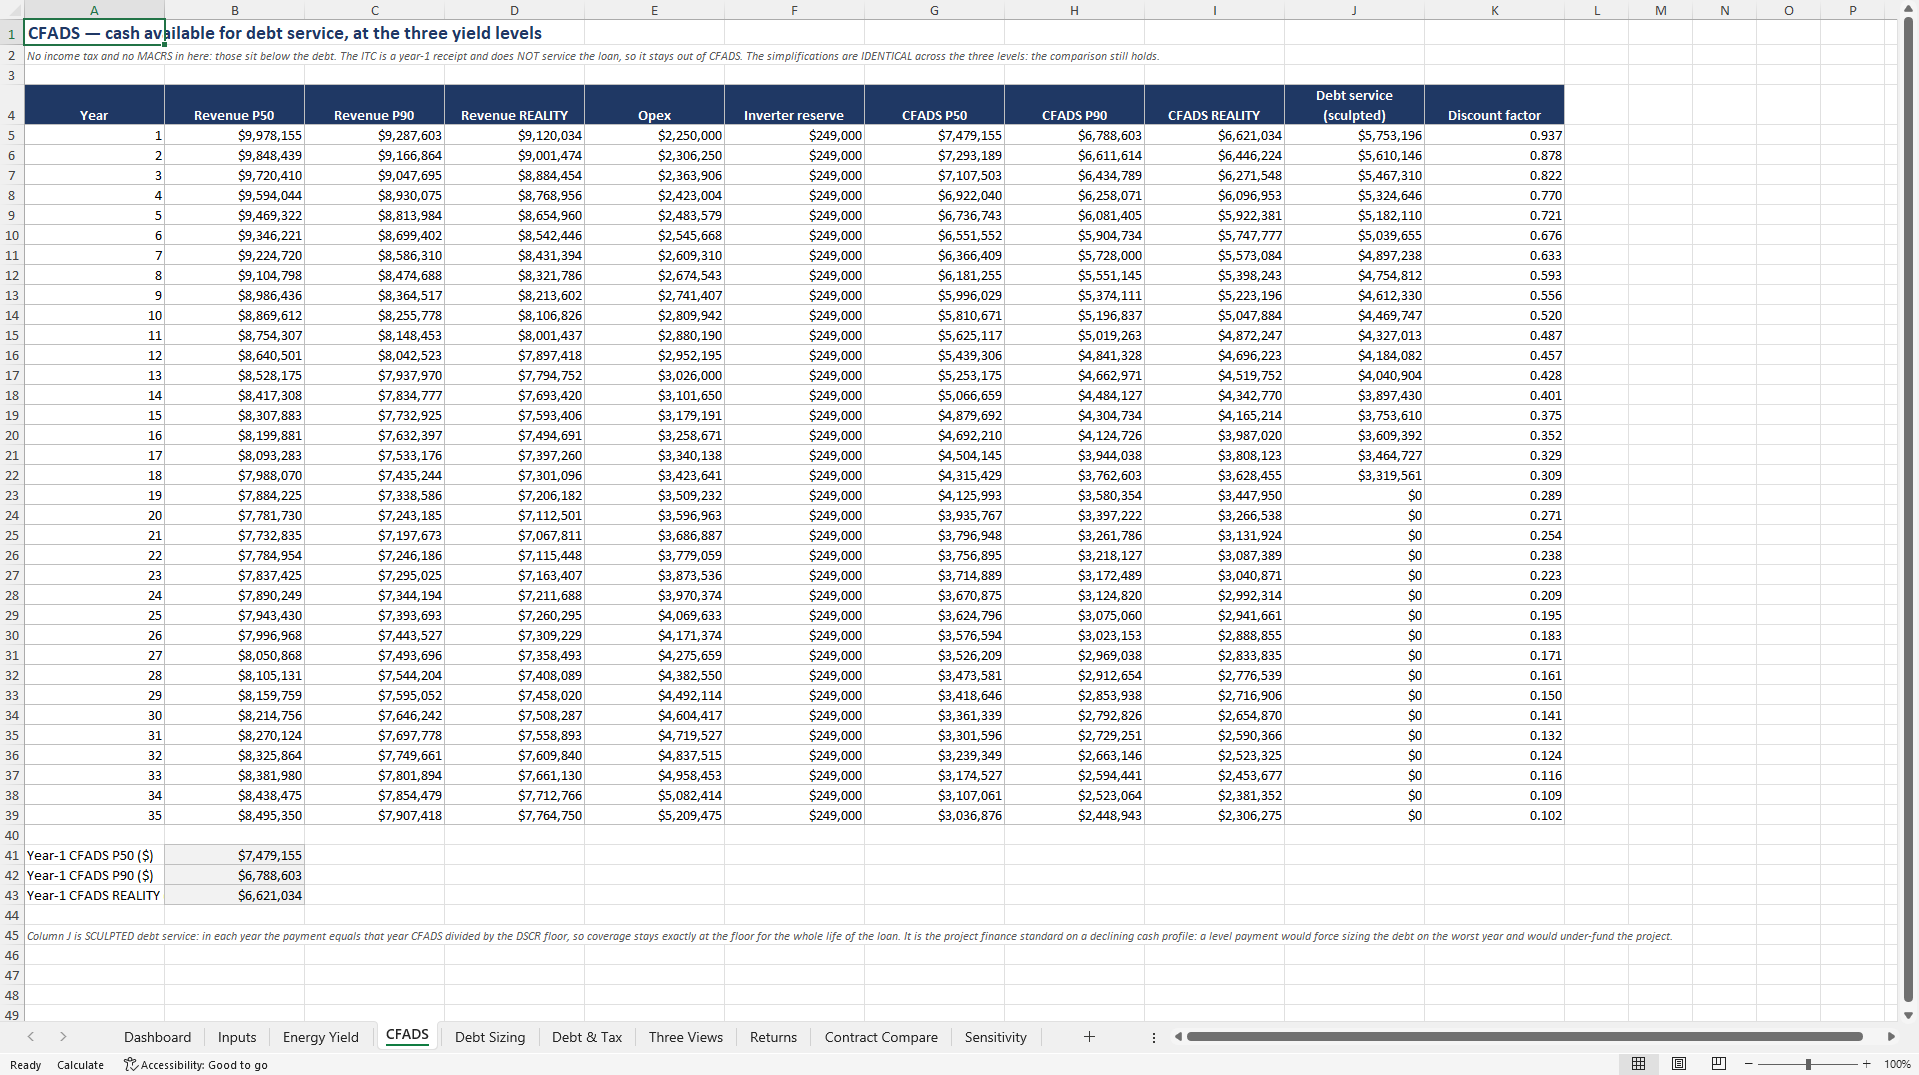
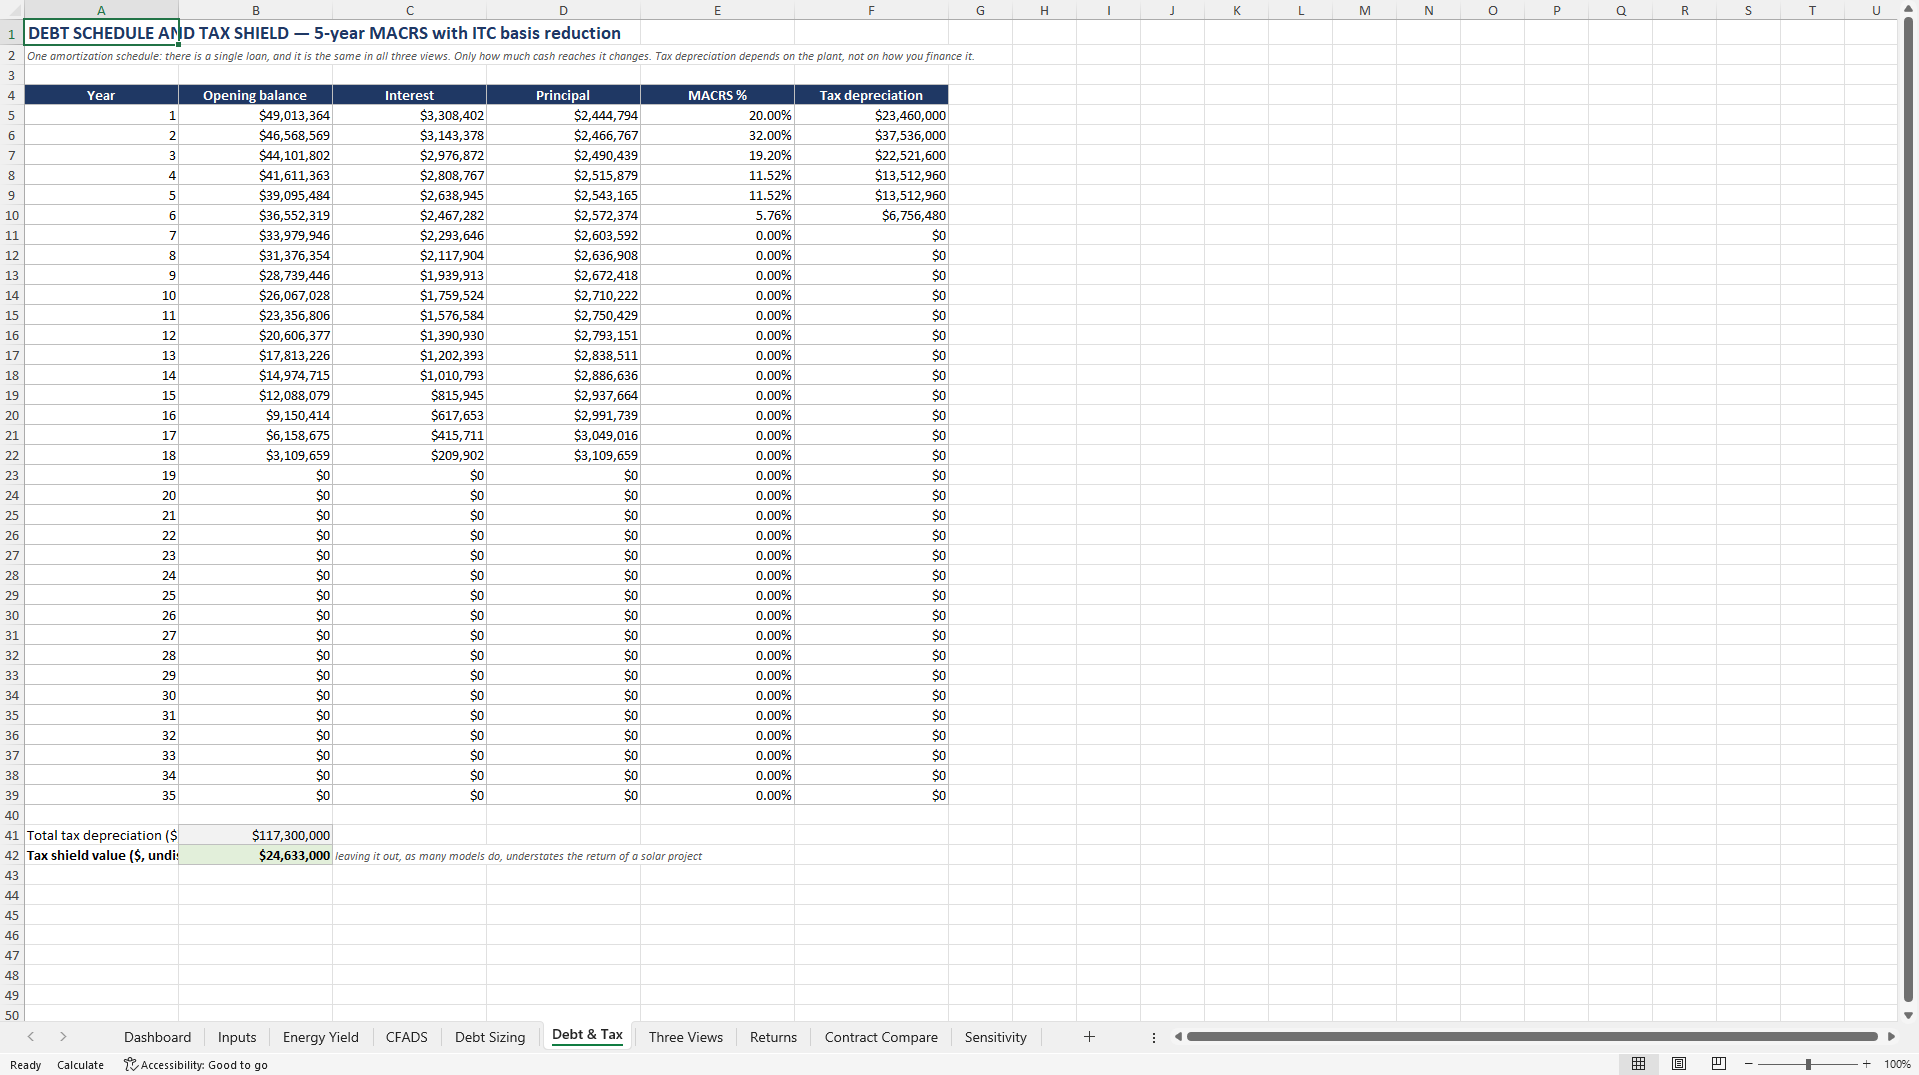
- Sculpt the debt to the coverage target with the ITC and the MACRS shield modelled explicitly, and carry 1.3% annual system degradation instead of a flat output line.
SOLAR ENERGY EXCEL DESCRIPTION
This model is for the lender, sponsor or adviser sizing debt on a contracted utility-scale solar PV project, and for anyone who has to defend a coverage ratio after the plant starts producing. It is a project-finance underwrite over a 35-year horizon, not a development forecast.
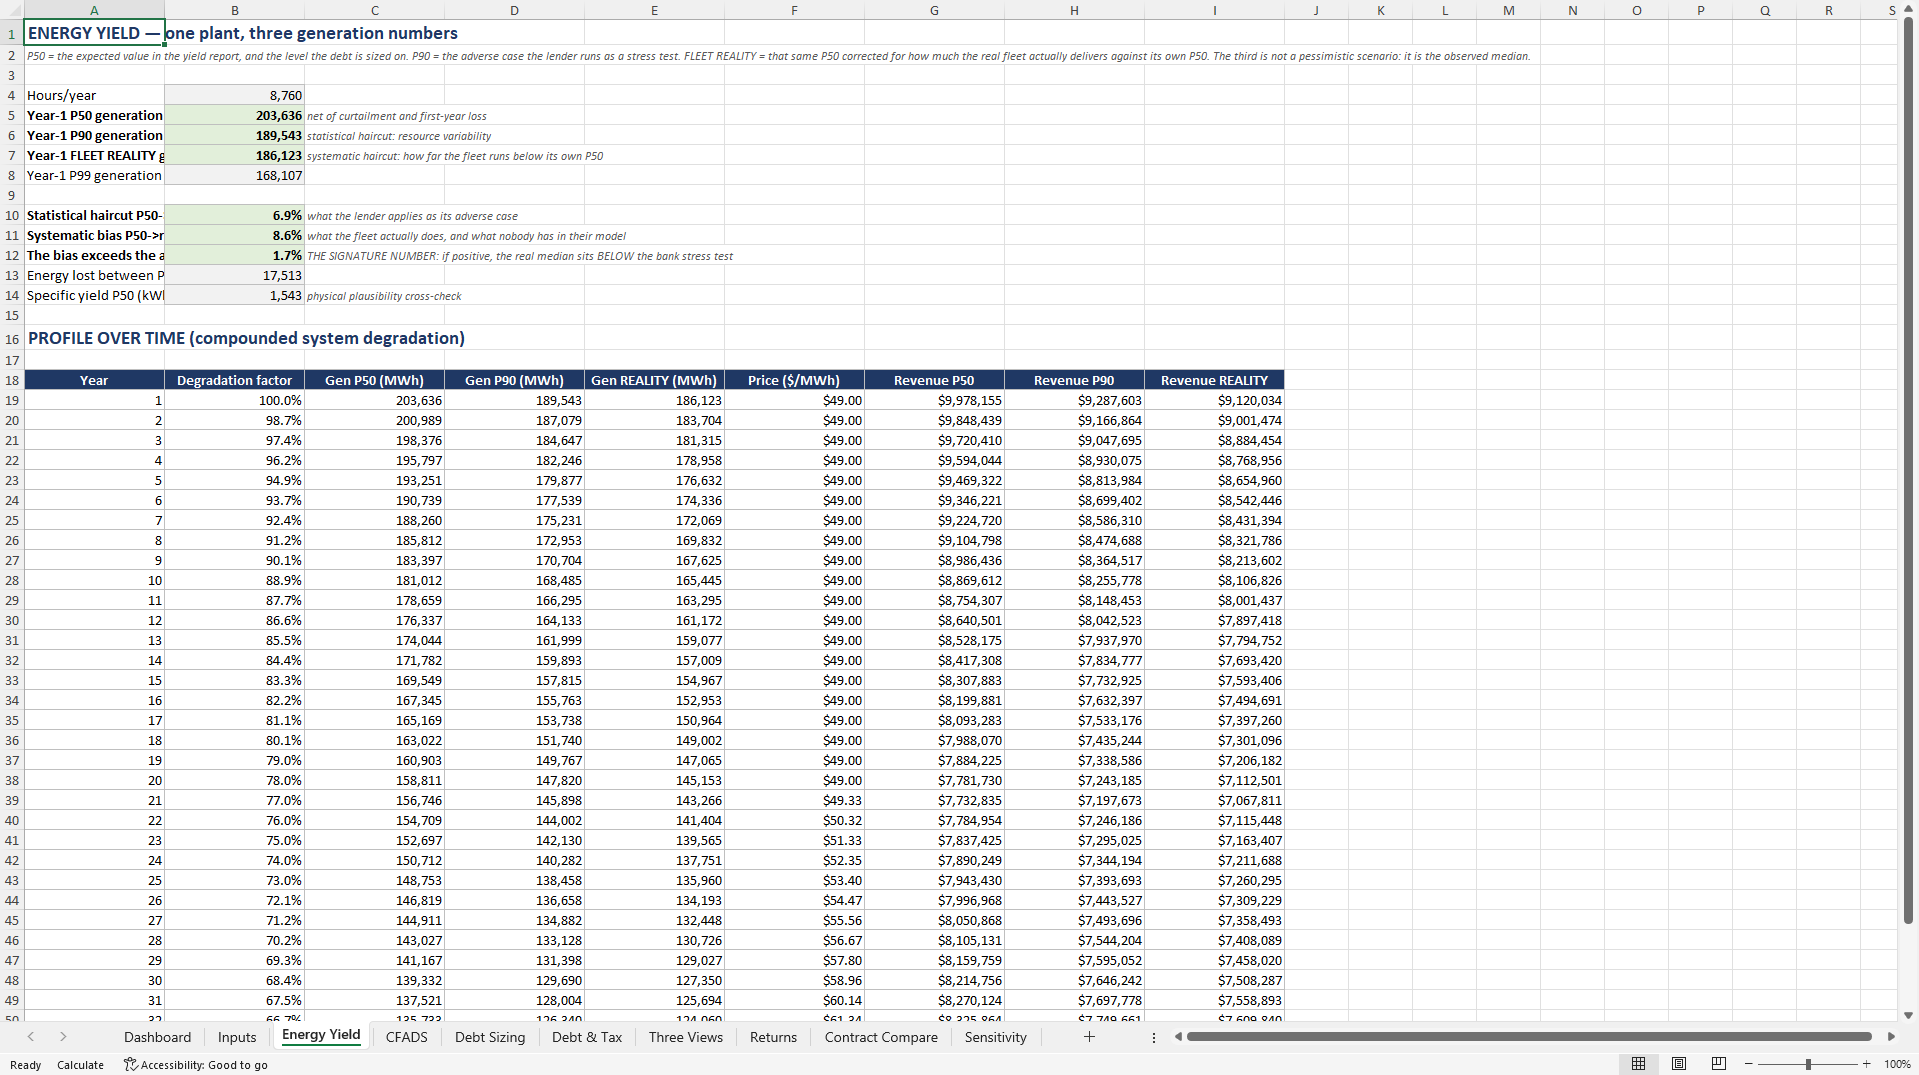
The error it intercepts sits inside the production estimate. Contracted solar debt is sized on the P50 at a 1.25-1.30x DSCR, not on the P90, which is the market convention. But the P50 is not the median: the United States fleet produces 8.60% below its own P50, which is more than the 6.92% a bank typically deducts in its adverse scenario. The model runs the same loan through all three cases. As sized the ratio is 1.30x, under the bank stress it is 1.1335x, and on real median output it is 1.0931x, below a 1.20x lock-up. Expressed in money on the base case, that is over-lending of $6,391,818, or 13.0%.
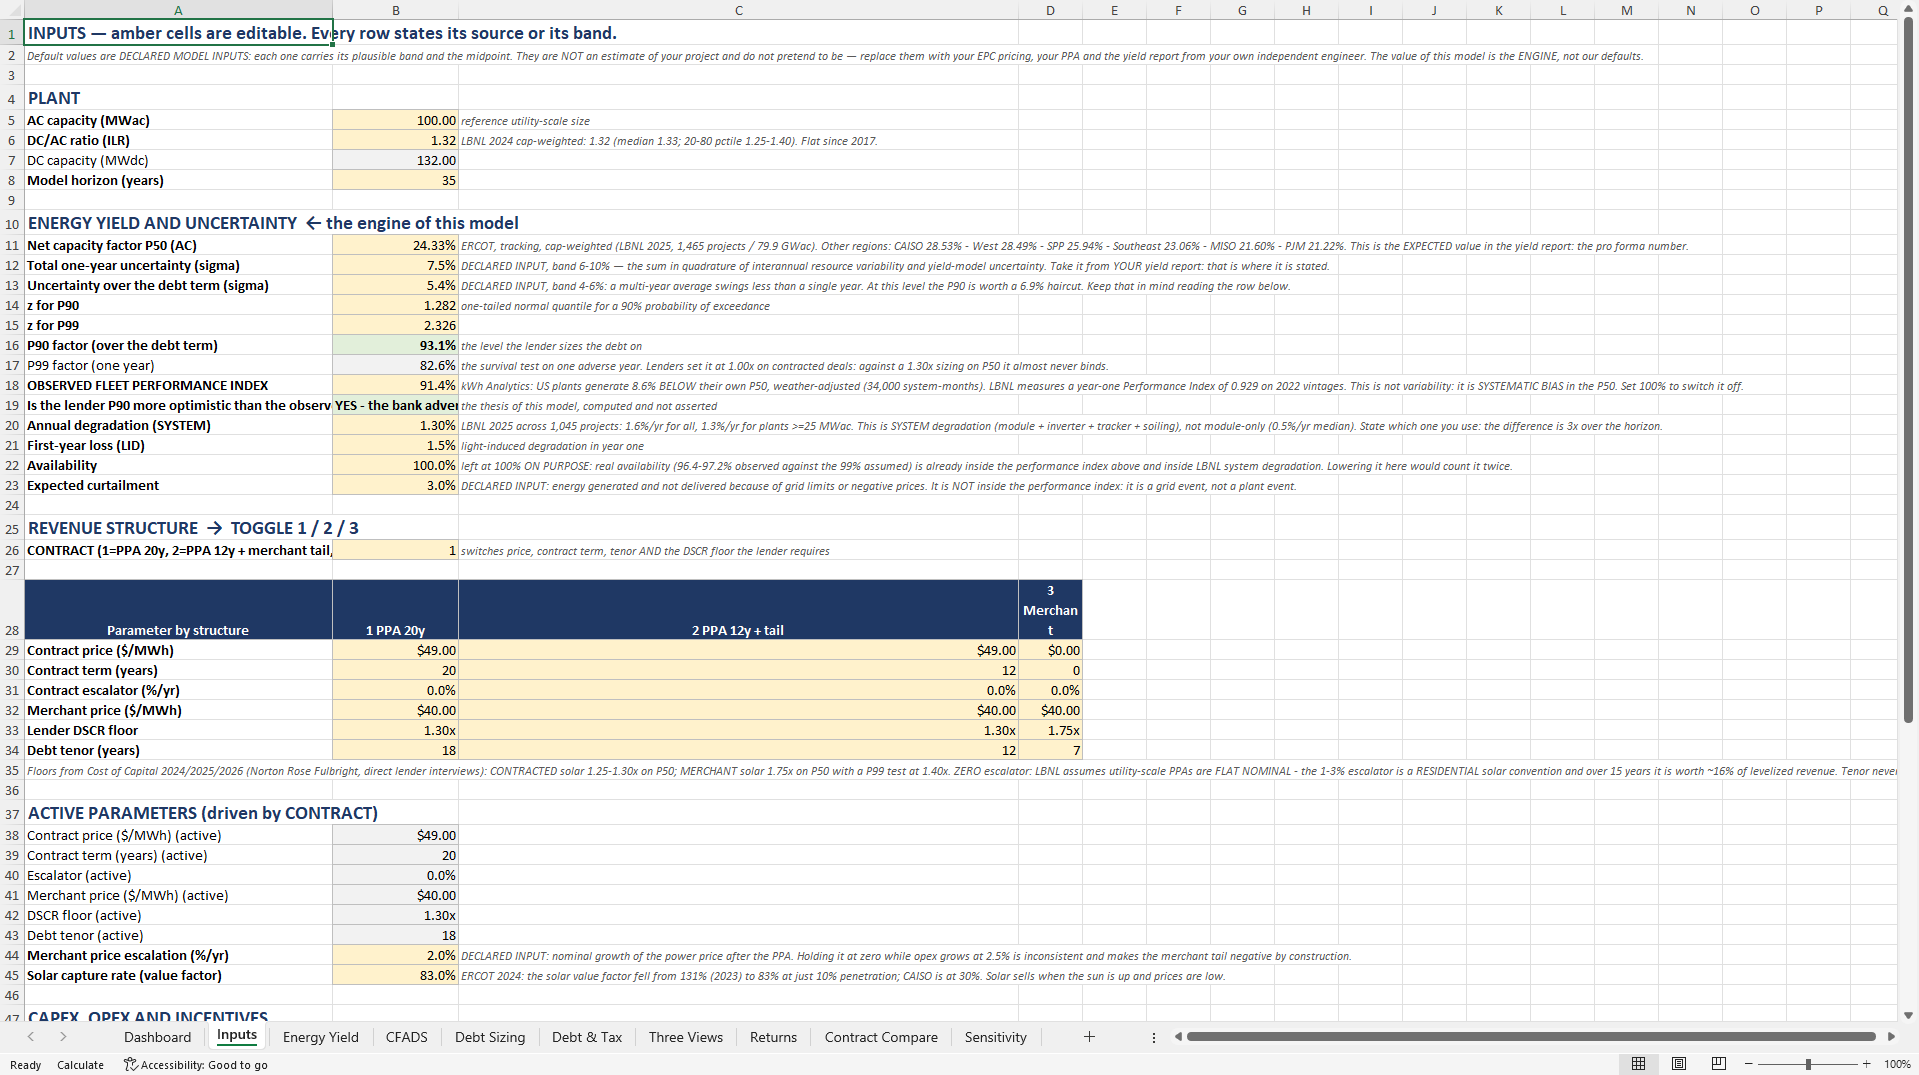
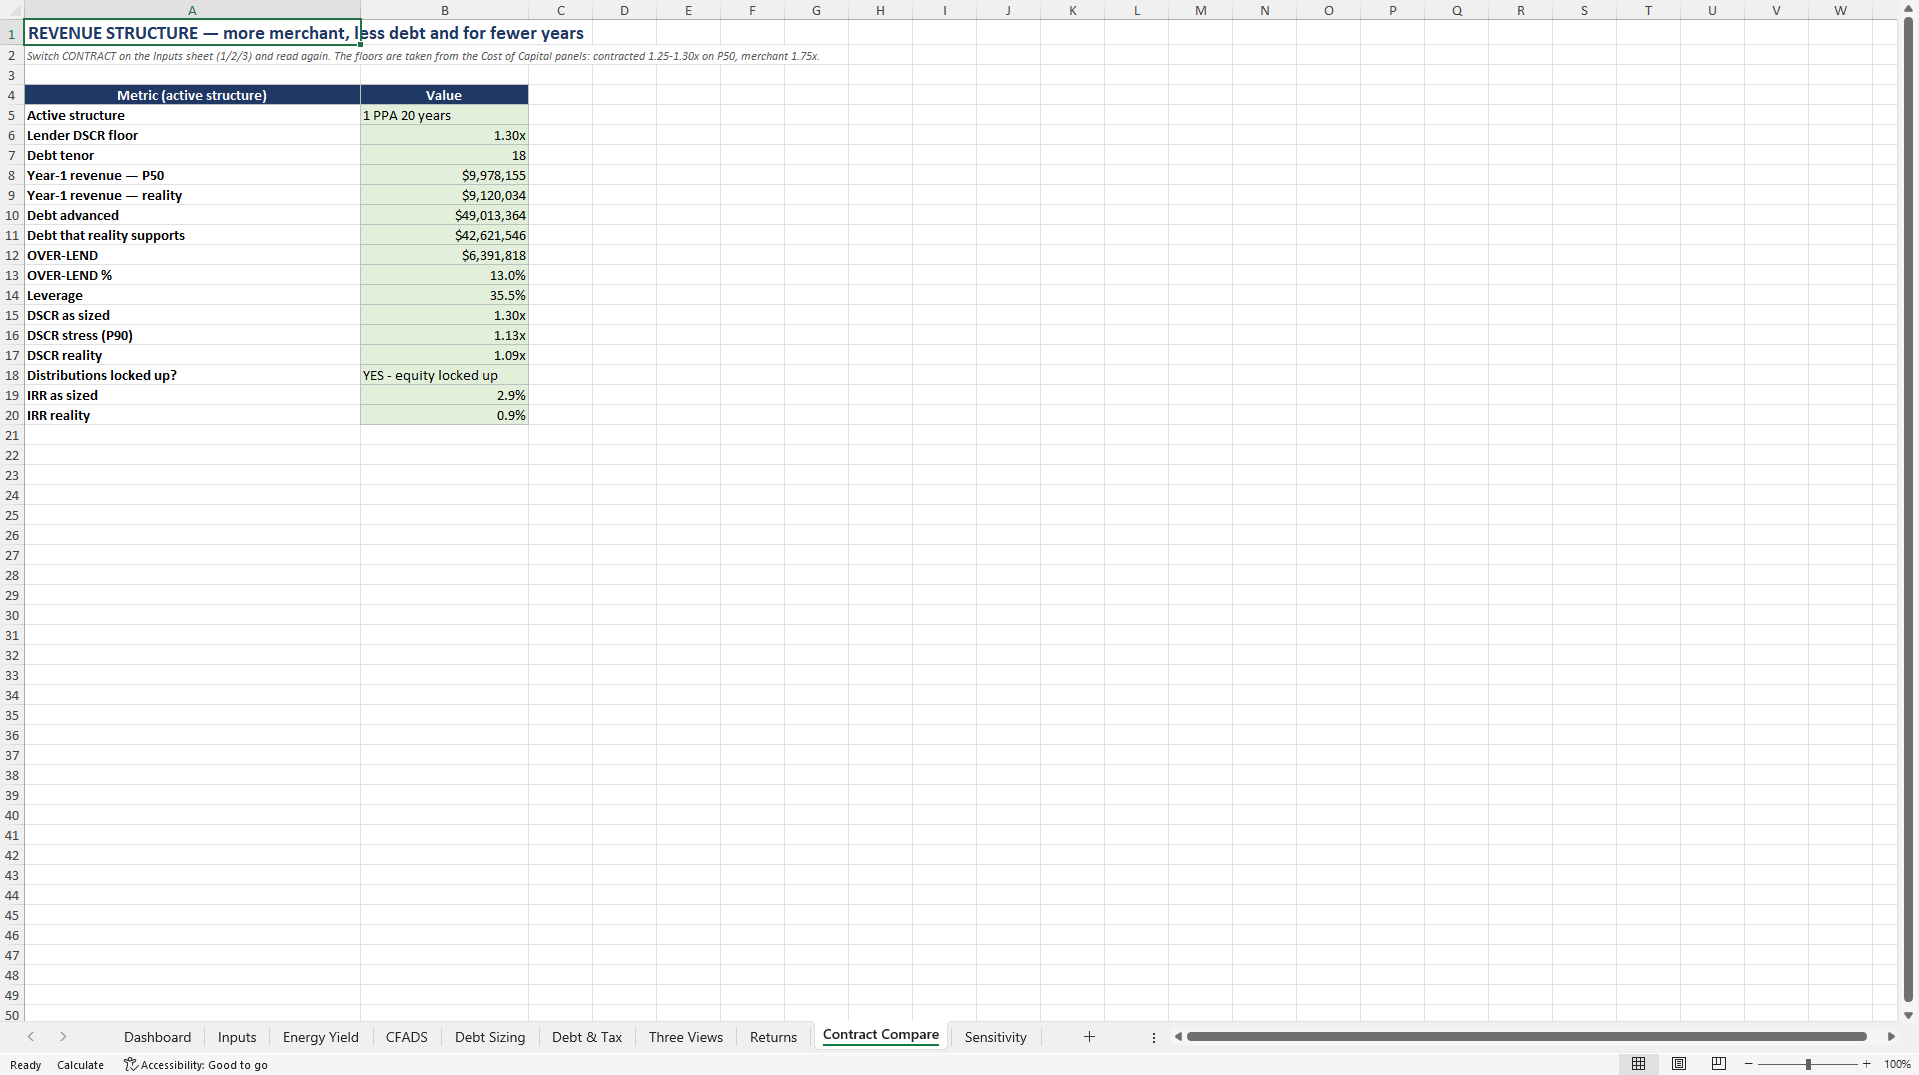
How the engine works. The base configuration is a 100 MWac / 132 MWdc plant at an ERCOT P50 capacity factor of 24.33%, giving year-one generation of 203,636 MWh at P50, 189,543 MWh at the bank stress and 186,123 MWh on the empirically corrected case, with 1.3% per year system degradation over the life. Capital cost is $138,000,000, against a net ITC of $38,502,000 and a MACRS shield of $24,633,000. The offtake is a flat $49.00/MWh PPA over 20 years and operating cost is $22.50 per kWac per year. Debt is sculpted to the coverage target, at $49,013,364 against $42,621,546 on the corrected case, leverage of 35.5% and equity of $88,986,636. Equity IRR reads 2.87%, 1.31% and 0.90% across the three production cases at a 1.09x MOIC, and the model quantifies $25,659,449 of revenue that was underwritten but never produced.
Inside is an Excel workbook covering the three production cases, the sculpted debt sizing, the ITC and MACRS tax lines, the coverage tests and the lock-up, and the returns, with every assumption editable.
What the model does not claim. It is not sold as the first or the only solar model: the research behind it counted 67 paid solar models on the market, and the claim made here is narrower and checkable, namely that it corrects the P50 with observed fleet performance and shows what that does to the DSCR. The base case is also left deliberately unflattering, with the PPA set at the cheapest quartile of observed offers and the capital cost of the cheapest region, so the returns are low by construction rather than by accident, and that is stated rather than hidden. It is an educational planning tool, not financial, investment or lending advice.
Got a question about the product? Email us at support@flevy.com or ask the author directly by using the "Ask the Author a Question" form. If you cannot view the preview above this document description, go here to view the large preview instead.
Source: Best Practices in Solar Energy, Integrated Financial Model Excel: Utility-Scale Solar PV Debt Sizing & P50 Bias Model Excel (XLSX) Spreadsheet, ProformaWorks
ABOUT THE AUTHOR
ProformaWorks builds acquisition-grade financial models for Main Street and lower-middle-market businesses - the kind of deal financed with an SBA 7(a) loan or a small commercial facility.
Every model answers one question: does this deal pencil at the bank? That means SDE or NOI rebuilt from the seller's own numbers, the add-backs a lender will and will not accept, a debt-service
... [read more]
Ask the Author a Question
You must be logged in to contact the author.




























