
Third-Party Logistics (3PL) Company – 10 Year Financial Model – Excel XLSX
Excel (XLSX)
BENEFITS OF THIS DOWNLOADABLE EXCEL DOCUMENT
- Provides a structured framework for forecasting the financial performance of a third-party logistics and fulfillment business.
- Enables clear modeling of client growth, logistics activity, and multi-stream revenue across a 10-year planning horizon.
- Supports strategic planning for logistics operations, infrastructure investment, and operational scaling.
3PL EXCEL DESCRIPTION
Curated by McKinsey-trained Executives
🚚 3PL Logistics Financial Model (10-Year Forecast)
The Complete Financial Forecasting System for Third-Party Logistics and Fulfillment Businesses 📦📊
The 3PL Logistics Financial Model is a fully integrated 10-year financial forecasting workbook built specifically for logistics companies, fulfillment providers, freight operators, and supply chain platforms.
It allows you to model client growth, logistics volume, warehouse utilization, multiple logistics revenue streams, operational costs, capital investment, and full financial statements across a 10-year projection period.
Every projection in the model is driven by operational logistics inputs rather than simple revenue growth assumptions.
No generic templates.
No simplified projections.
Just a structured logistics financial model built around the core operational drivers of a modern third-party logistics business.
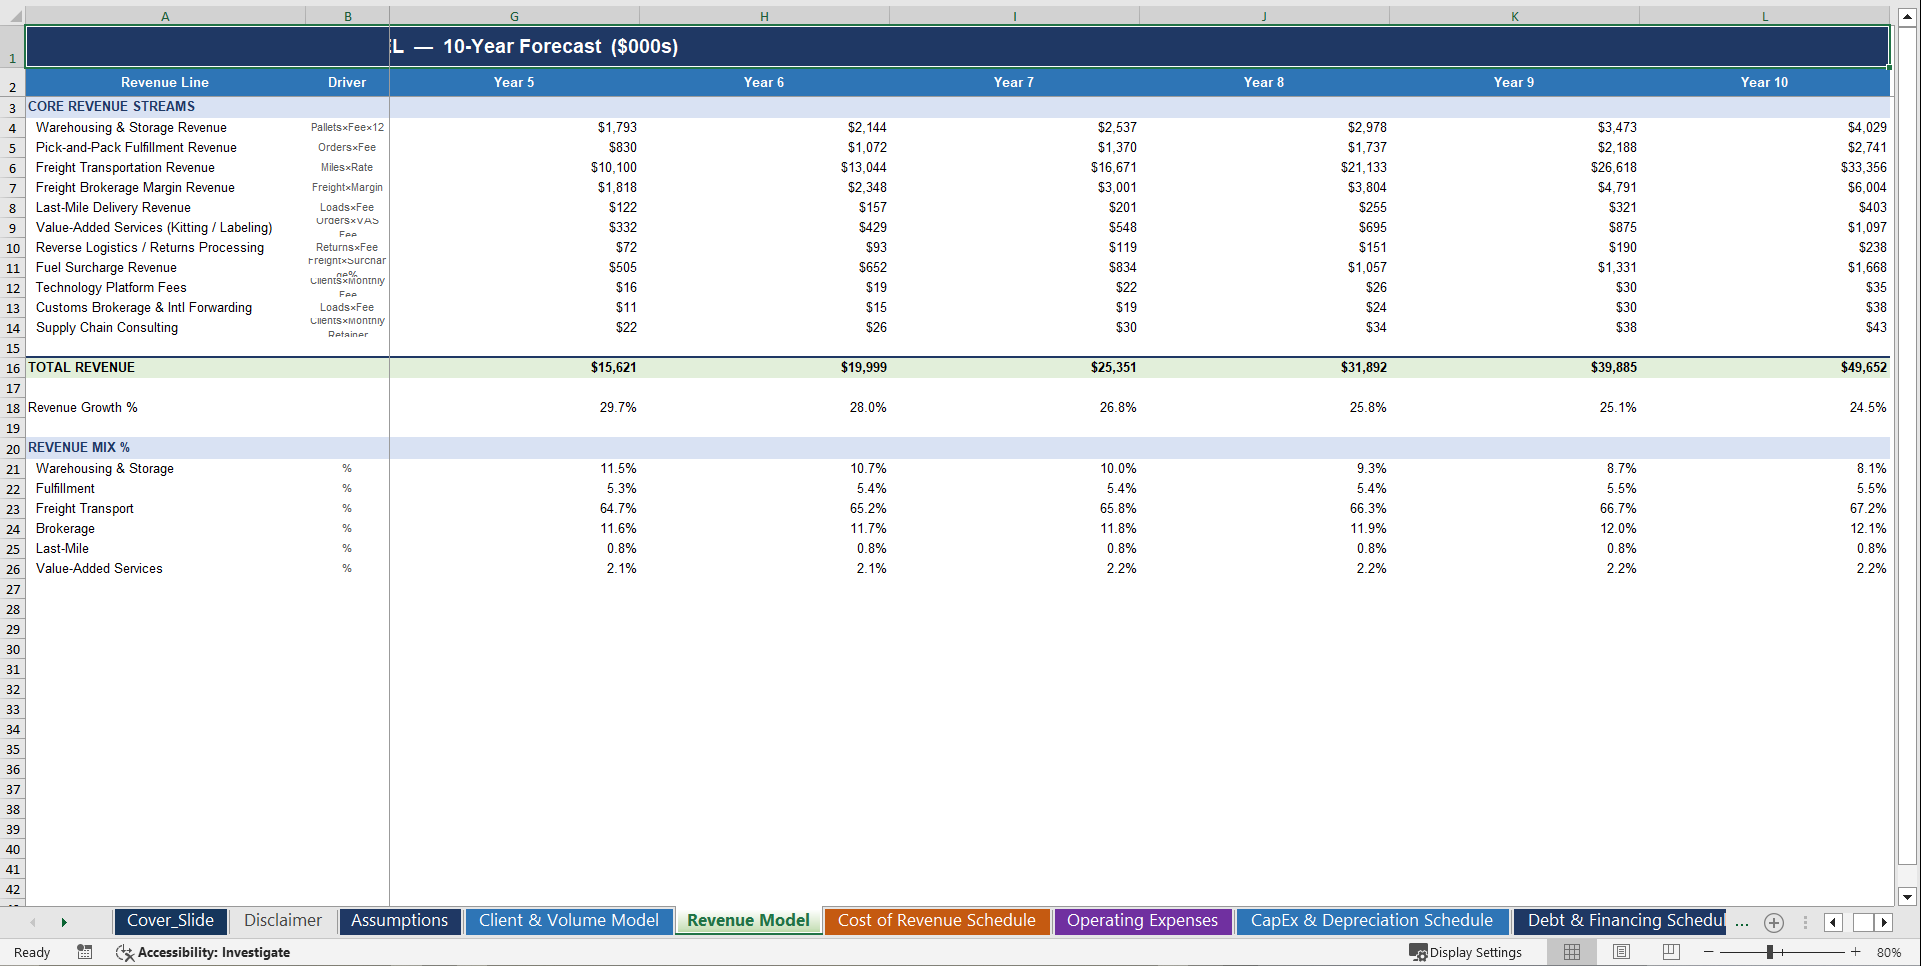
📦 Built Around Real 3PL Revenue Streams
The model includes a multi-stream revenue model reflecting the different services provided by modern logistics companies.
Each revenue stream is calculated from operational drivers defined in the Assumptions sheet and aggregated into the Revenue Model sheet.
📊 Warehousing & Storage Revenue
Storage revenue is generated from pallet storage across active logistics clients.
Revenue is calculated using:
• Average pallets stored per client
• Storage fee per pallet per month
• Number of active clients
Storage revenue scales automatically as the client base and storage demand grow.
📦 Pick-and-Pack Fulfillment Revenue
Fulfillment revenue is generated from orders processed through the warehouse.
Inputs include:
• Orders per client per month
• Pick-and-pack fee per order
• Annual order growth rate
Total fulfillment revenue grows as order volume increases across the client base.
🚛 Freight Transportation Revenue
Freight transportation revenue is calculated from transport activity measured in miles driven.
Key inputs include:
• Freight loads per client per year
• Average miles per shipment
• Freight rate per mile
Total freight revenue increases as the number of clients and shipments grows.
📦 Freight Brokerage Revenue
The model includes a freight brokerage revenue line representing margin generated from brokered freight shipments.
Revenue is calculated using:
• Freight loads brokered
• Brokerage margin percentage
🚚 Last-Mile Delivery Revenue
Last-mile delivery services generate revenue based on:
• Deliveries per client
• Last-mile delivery fee per shipment
📦 Value-Added Logistics Services
Additional supply chain services can generate extra revenue.
Examples include:
• Kitting
• Labeling
• Packaging services
Revenue is calculated from service usage across the client base.
🔁 Reverse Logistics & Returns Processing
The model includes revenue from processing returned goods.
Revenue is calculated using:
• Returns rate as a percentage of orders
• Returns processing fee
⛽ Fuel Surcharge Revenue
Fuel surcharge revenue is applied to transportation activity.
It is calculated as a percentage surcharge on freight revenue.
💻 Technology Platform Fees
The model includes a revenue stream for technology or platform access fees charged to clients.
This reflects logistics companies that provide digital supply chain platforms or client portals.
🌍 Customs Brokerage & International Forwarding
Revenue can also be generated from customs brokerage or international shipping coordination services.
📈 Supply Chain Consulting Revenue
The model includes a consulting revenue stream for advisory services related to supply chain optimization.
👥 Client Growth Model
All logistics activity in the model begins with the client growth engine.
The Client & Volume Model sheet tracks how the client base evolves over time.
Key drivers include:
• Starting number of active clients
• New clients acquired each year
• Client acquisition growth rate
• Annual client churn rate
• Enterprise vs SMB client mix
From these inputs, the model calculates:
• Total active clients each year
• Net client growth across the forecast period
This client base then drives order volume, freight activity, and warehouse utilization.
📦 Order Volume & Logistics Activity Model
Operational logistics activity is modeled using several volume drivers.
These inputs determine the operational scale of the logistics platform.
Key inputs include:
• Orders per client per month
• Annual order growth rate
• Average pallets stored per client
• Returns rate on orders
• Freight loads per client
• Average miles per shipment
From these inputs, the model calculates:
• Total orders processed
• Total pallets stored
• Returns processed
• Freight loads shipped
• Total miles driven
These metrics feed directly into the Revenue Model and Cost of Revenue schedules.
🏭 Warehouse Capacity & Utilization
Warehouse storage demand is calculated using:
• Average pallets stored per client
• Total number of active clients
The model also includes assumptions for:
• Starting warehouse capacity
• Warehouse utilization threshold
• Capacity added when expansion occurs
Warehouse capacity and utilization are tracked across the forecast period to ensure storage demand remains within capacity assumptions.
🧾 Cost of Revenue – Logistics Operating Costs
The Cost of Revenue Schedule models the operational costs associated with delivering logistics services.
Cost categories included in the model:
Warehouse Operations
• Warehouse labor costs
• Warehouse utilities
• Warehouse lease variable costs
• Equipment maintenance
Transportation Costs
• Carrier costs
• Fuel costs per mile
Fulfillment Costs
• Packaging materials
Returns Processing Costs
• Operational costs associated with handling product returns
Technology Transaction Costs
• Platform transaction costs associated with logistics technology systems
These costs scale with logistics activity and shipment volume.
📊 Gross Profit Calculation
Gross profit is calculated by subtracting total cost of revenue from total logistics revenue.
The model automatically calculates:
• Total cost of revenue
• Gross profit
• Gross margin percentage
These metrics are displayed in the Income Statement and Executive Dashboard.
🧑💼 Operating Expense Structure
The Operating Expenses sheet tracks overhead costs required to run the logistics company.
Personnel Costs
Personnel expenses include:
• Salaries
• Payroll taxes
• Employee benefits
• Bonuses
• Stock-based compensation
Personnel roles included in the model:
• CEO
• COO / VP Operations
• CFO
• Warehouse Managers
• Logistics Coordinators
• Supply Chain Analysts
• Warehouse Workers
Headcount and compensation assumptions are defined in the Assumptions sheet.
Technology Expenses
Technology infrastructure expenses include systems such as:
• Warehouse Management Systems (WMS)
• Transportation Management Systems (TMS)
• Cloud infrastructure
These costs are modeled as operating expenses in the model.
Sales & Marketing Expenses
Sales and marketing costs are modeled as a percentage of total revenue.
General & Administrative Expenses
General and administrative expenses include corporate overhead costs and are also modeled as a percentage of revenue.
🏗 Capital Expenditure & Infrastructure Investment
The CapEx & Depreciation Schedule tracks capital investments required to operate and scale the logistics platform.
Asset categories included:
• Warehouse buildouts
• Automation systems
• Material handling equipment
• Delivery fleet vehicles
• IT infrastructure
• Logistics software platforms
Annual capital expenditures are recorded for each asset category.
📉 Depreciation Schedule
All capital assets are depreciated using straight-line depreciation.
Depreciation is tracked for:
• Warehouse infrastructure
• Automation equipment
• Material handling equipment
• Fleet vehicles
• IT infrastructure
• Software platforms
Depreciation expense flows directly into the Income Statement and Cash Flow Statement.
💰 Debt & Financing Model
The Debt & Financing Schedule models external financing used to fund company growth.
The model tracks:
Equity Financing
• Equity capital raised
• Cumulative equity investment
Debt Financing
• Loan drawdowns
• Principal repayments
• Interest expense
Debt balances flow directly into the Balance Sheet and Cash Flow Statement.
🔄 Working Capital Schedule
The model includes a Working Capital Schedule that tracks operating working capital accounts.
Accounts included:
• Accounts receivable
• Accounts payable
• Inventory
Changes in working capital automatically flow into the Cash Flow Statement.
📊 Fully Integrated 3-Statement Financial Model
All operational assumptions flow into three fully connected financial statements.
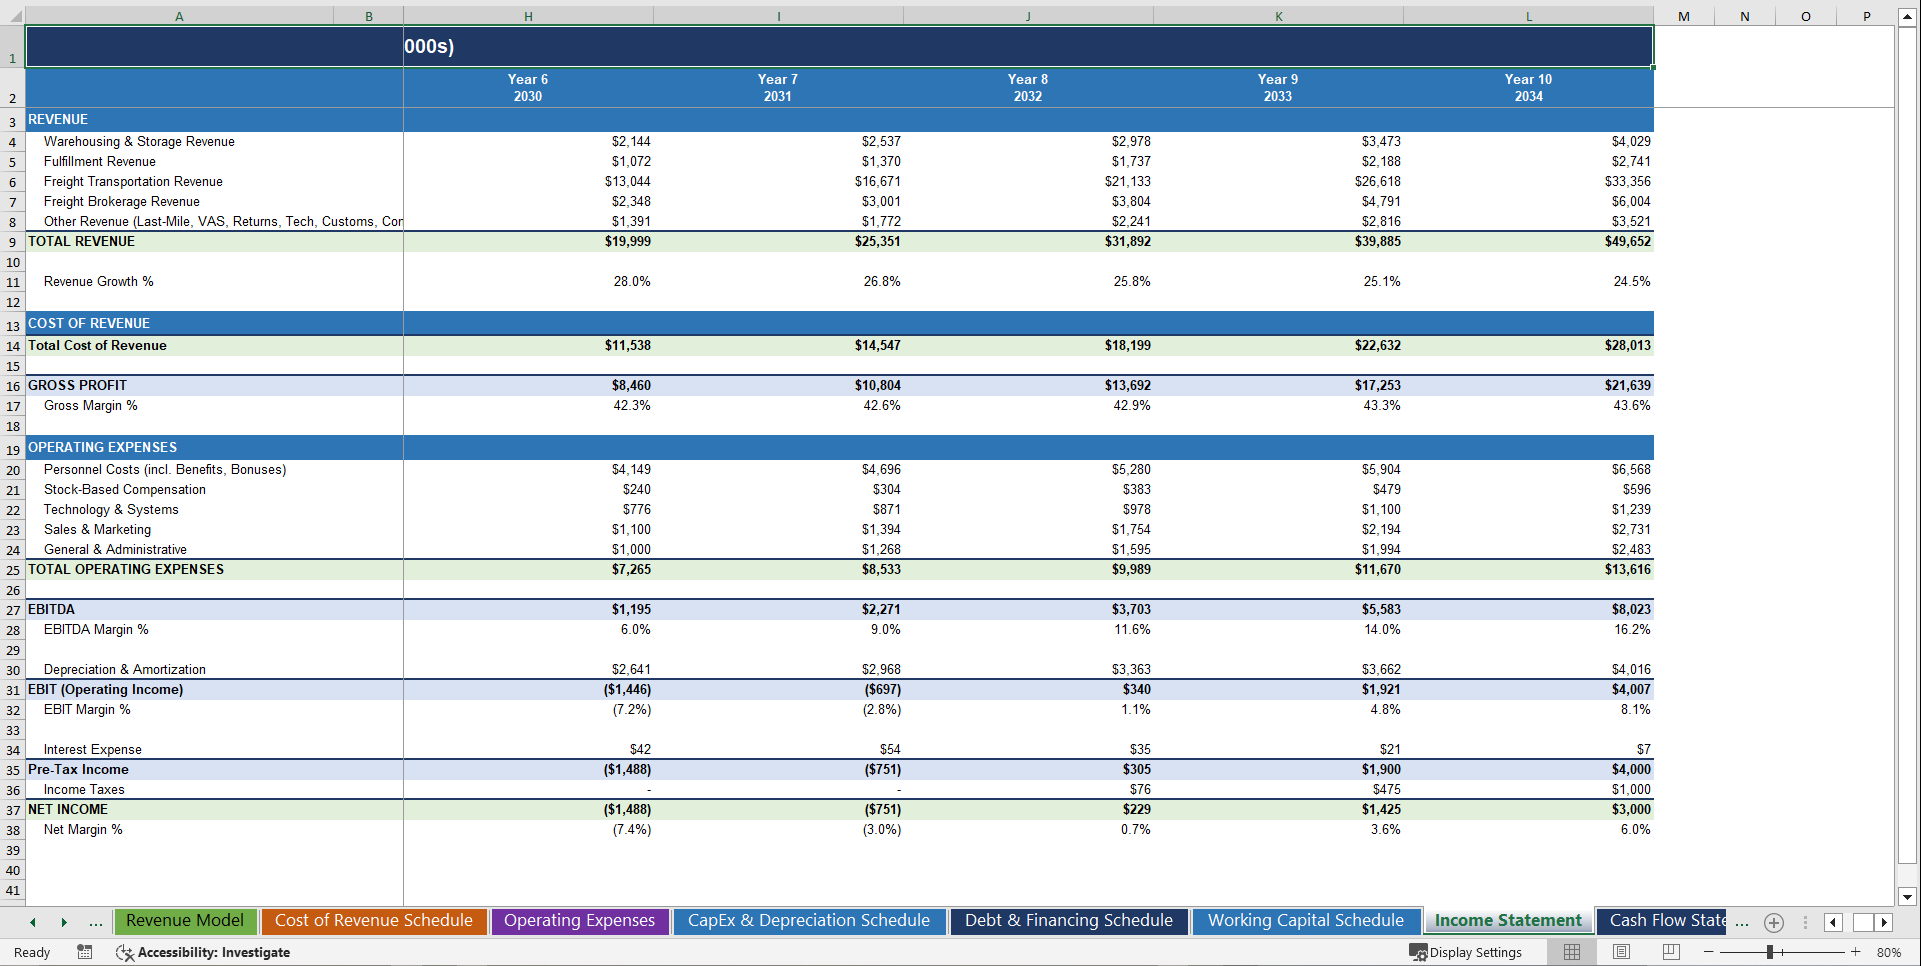
📑 Income Statement
Tracks:
• Total logistics revenue
• Cost of revenue
• Gross profit
• Operating expenses
• EBITDA
• Depreciation
• Interest expense
• Taxes
• Net income
💵 Cash Flow Statement
The cash flow statement tracks:
• Operating cash flow
• Capital expenditures
• Debt financing
• Equity financing
• Changes in working capital
🧾 Balance Sheet
The balance sheet tracks the company's financial position including:
Assets
• Cash
• Accounts receivable
• Inventory
• Property, plant & equipment
Liabilities
• Accounts payable
• Debt balances
Equity
• Equity financing
• Retained earnings
📊 Scenario & Sensitivity Analysis
The Sensitivity & Scenario Analysis sheet allows users to test different operating environments.
Scenarios included in the model:
• Base Case
• High Growth
• Recession
• Fuel Price Shock
• Labor Shortage
• Automation Efficiency
Each scenario shows the resulting impact on financial performance.
EBITDA Sensitivity Analysis
The model also includes a sensitivity table showing EBITDA margin under different operational conditions.
The sensitivity table evaluates EBITDA performance based on:
• Freight revenue per mile
• Warehouse utilization levels
📈 Executive Dashboard
The Executive Dashboard sheet provides a visual overview of the logistics business.
The dashboard displays key metrics including:
• Total revenue
• Client growth
• operational metrics
• financial performance indicators
Charts automatically update when assumptions change.
⚙️ Simple, Professional Input Structure
The model uses a clear and professional Excel input system.
All major assumptions are centralized in the Assumptions sheet, including:
• Client growth drivers
• Logistics activity assumptions
• Pricing inputs
• Cost drivers
• CapEx investments
• Financing assumptions
Changing an input automatically updates the entire model.
📊 Complete Workbook Structure
The model includes 15 structured worksheets:
1. Cover Slide
2. Disclaimer
3. Assumptions
4. Client & Volume Model
5. Revenue Model
6. Cost of Revenue Schedule
7. Operating Expenses
8. CapEx & Depreciation Schedule
9. Debt & Financing Schedule
10. Working Capital Schedule
11. Income Statement
12. Cash Flow Statement
13. Balance Sheet
14. Sensitivity & Scenario Analysis
15. Executive Dashboard
🎯 Who This Model Is For
This financial model is designed for:
✔ Third-party logistics companies
✔ eCommerce fulfillment businesses
✔ freight brokerage firms
✔ warehouse operators
✔ supply chain platforms
✔ founders planning logistics startups
✔ investors evaluating logistics companies
✔ consultants and financial analysts modeling logistics operations
If your business stores goods, processes orders, moves freight, and manages supply chains, this model provides a structured financial forecasting framework.
🚀 Plan the Growth of Your Logistics Business
The 3PL Logistics Financial Model connects clients, logistics activity, revenue streams, operational costs, infrastructure investment, and financing into a single integrated financial system.
Everything flows into clear financial projections, operational metrics, and full financial statements.
A complete financial planning framework for building and scaling a modern third-party logistics platform. 📦📈
Key Words:
Strategy & Transformation, Growth Strategy, Strategic Planning, Strategy Frameworks, Innovation Management, Pricing Strategy, Core Competencies, Strategy Development, Business Transformation, Marketing Plan Development, Product Strategy, Breakout Strategy, Competitive Advantage, Mission, Vision, Values, Strategy Deployment & Execution, Innovation, Vision Statement, Core Competencies Analysis, Corporate Strategy, Product Launch Strategy, BMI, Blue Ocean Strategy, Breakthrough Strategy, Business Model Innovation, Business Strategy Example, Corporate Transformation, Critical Success Factors, Customer Segmentation, Customer Value Proposition, Distinctive Capabilities, Enterprise Performance Management, KPI, Key Performance Indicators, Market Analysis, Market Entry Example, Market Entry Plan, Market Intelligence, Market Research, Market Segmentation, Market Sizing, Marketing, Michael Porter's Value Chain, Organizational Transformation, Performance Management, Performance Measurement, Platform Strategy, Product Go-to-Market Strategy, Reorganization, Restructuring, SWOT, SWOT Analysis, Service 4.0, Service Strategy, Service Transformation, Strategic Analysis, Strategic Plan Example, Strategy Deployment, Strategy Execution, Strategy Frameworks Compilation, Strategy Methodologies, Strategy Report Example, Value Chain, Value Chain Analysis, Value Innovation, Value Proposition, Vision Statement, Corporate Strategy, Business Development, Business plan pdf, business plan, PDF, Business Plan DOC, Business Plan Template, PPT, Market strategy playbook, strategic market planning, competitive analysis tools, market segmentation frameworks, growth strategy templates, product positioning strategy, market execution toolkit, strategic alignment playbook, KPI and OKR frameworks, business growth strategy guide, cross-functional strategy templates, market risk management, market strategy PowerPoint doc, guide, ebook, e-book ,McKinsey Change Playbook, Organizational change management toolkit, Change management frameworks 2025, Influence model for change, Change leadership strategies, Behavioral change in organizations, Change management PowerPoint templates, Transformational leadership in change, supply chain KPIs, supply chain KPI toolkit, supply chain PowerPoint template, logistics KPIs, procurement KPIs, inventory management KPIs, supply chain performance metrics, manufacturing KPIs, supply chain dashboard, supply chain strategy KPIs, reverse logistics KPIs, sustainability KPIs in supply chain, financial supply chain KPIs, warehouse KPIs, digital supply chain KPIs, 1200 KPIs, supply chain scorecard, KPI examples, supply chain templates, Corporate Finance SOPs, Finance SOP Excel Template, CFO Toolkit, Finance Department Procedures, Financial Planning SOPs, Treasury SOPs, Accounts Payable SOPs, Accounts Receivable SOPs, General Ledger SOPs, Accounting Policies Template, Internal Controls SOPs, Finance Process Standardization, Finance Operating Procedures, Finance Department Excel Template, FP&A Process Documentation, Corporate Finance Template, Finance SOP Toolkit, CFO Process Templates, Accounting SOP Package, Tax Compliance SOPs, Financial Risk Management Procedures.
NOTE: Our digital products are sold on an "as is" basis, making returns and refunds unavailable post-download. Please preview and inquire before purchasing. Please contact us before purchasing if you have any questions! This policy aligns with the standard Flevy Terms of Usage.
Got a question about the product? Email us at support@flevy.com or ask the author directly by using the "Ask the Author a Question" form. If you cannot view the preview above this document description, go here to view the large preview instead.
Source: Best Practices in 3PL, Integrated Financial Model Excel: Third-Party Logistics (3PL) Company – 10 Year Financial Model Excel (XLSX) Spreadsheet, SB Consulting
ABOUT THE AUTHOR
SB Consulting is dedicated to empowering businesses to communicate their ideas with impact. This consulting firm specializes in teaching organizations how to create effective corporate and management presentations. With training from top-tier global consulting firms, including McKinsey, BCG, and Porsche Consulting, extensive expertise in presentation design and ... [read more]
Ask the Author a Question
You must be logged in to contact the author.
