
 Click main image to view in full screen. Unlock all 17 preview images:
Synthetic Biology and Biofoundry Financial Model – Excel XLSX
Excel (XLSX) + supplemental PDF


BENEFITS OF THIS DOWNLOADABLE EXCEL DOCUMENT
- Connects DBTL, strain, fermentation, DSP, and COGS assumptions directly to a long-range financial and investment case.
- Evaluates Platform, Vertical, and Hybrid commercialization strategies through linked financial statements, funding, valuation, scenarios, and sensitivities.
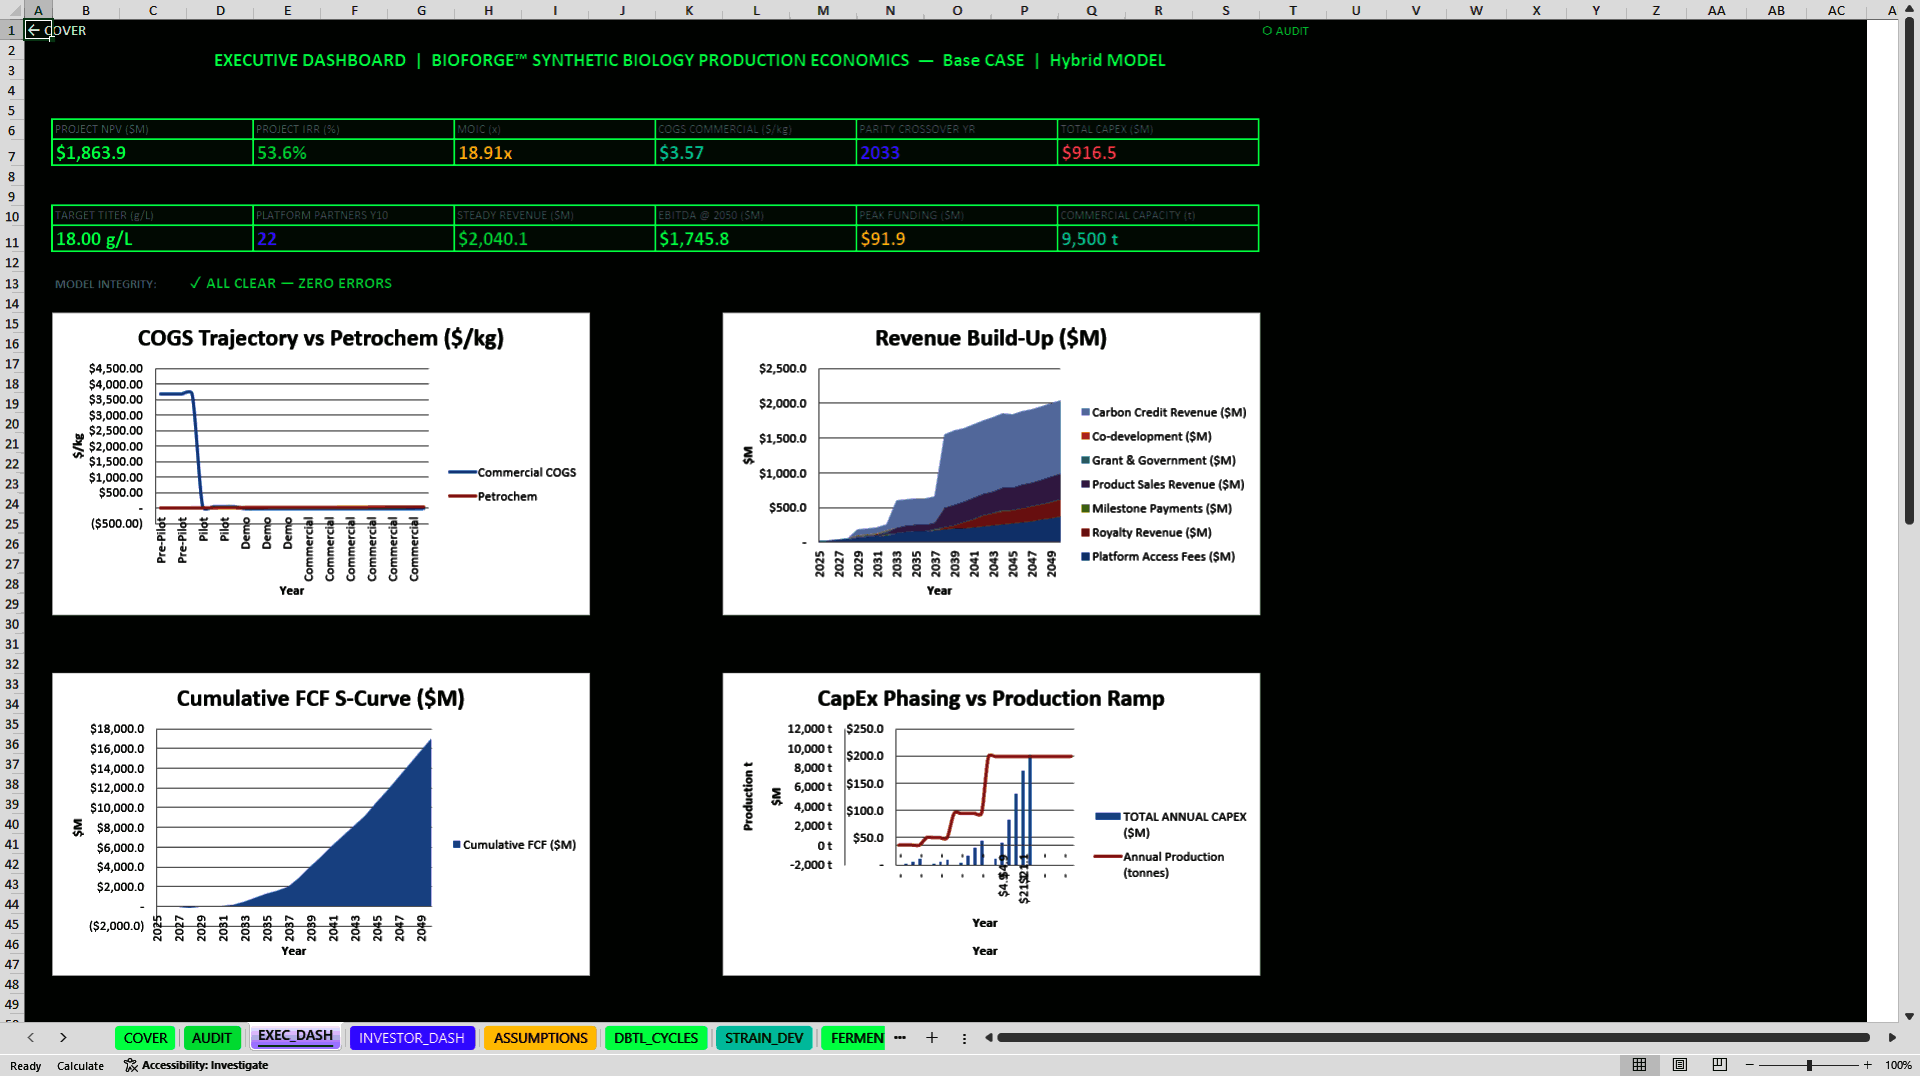
- Accelerates decision-ready analysis with centralized inputs, executive and investor dashboards, 38 native charts, and 38 built-in integrity checks.
BIOTECH EXCEL DESCRIPTION
🧬 OVERVIEW
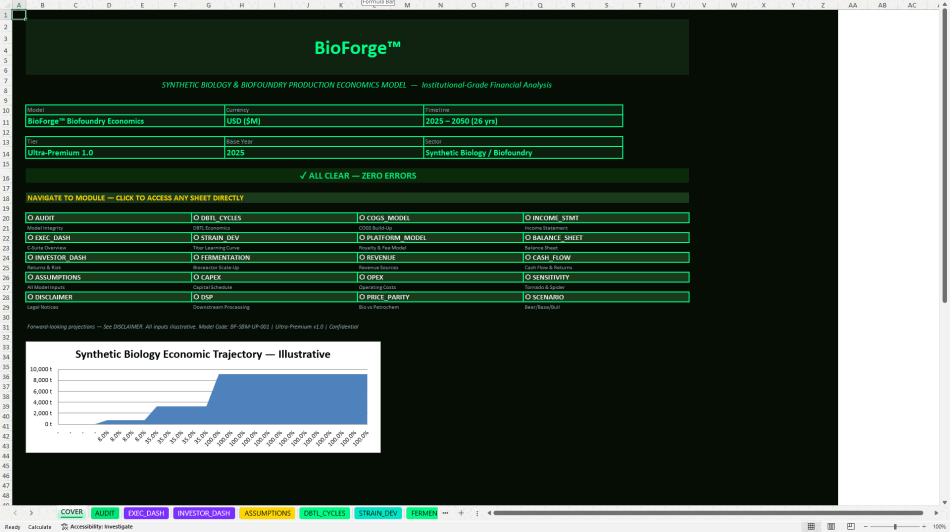
BioForge™ is a fully editable, formula-driven financial and production-economics model for synthetic-biology platforms, biofoundries, precision-fermentation businesses, and bio-based product manufacturers. It connects DBTL cycles, strain titer, scale-up efficiency, recovery, purity, reactor configuration, and cost per kilogram to revenue, capital requirements, three-statement forecasts, cash flow, and investment returns. The annual timeline runs from 2025 through 2050 and supports Platform, Vertical, and Hybrid business models.
🎯 DECISIONS THE MODEL SUPPORTS
• Development economics: estimate Design-Build-Test-Learn cycle cost, timing, titer progression, cumulative investment, and phase-gate achievement. • Scale-up economics: compare pilot, demonstration, and commercial reactor volumes, batch output, cycle time, annual capacity, raw materials, utilities, labor, and fermentation COGS. • Commercial strategy: evaluate platform fees, royalties, milestones, product sales, grants, co-development, and optional carbon-credit revenue. • Investment analysis: examine funding needs, three financial statements, free cash flow, NPV, IRR, MOIC, terminal value, price parity, scenarios, and sensitivities.
⚙️ CENTRAL ASSUMPTION ENGINE
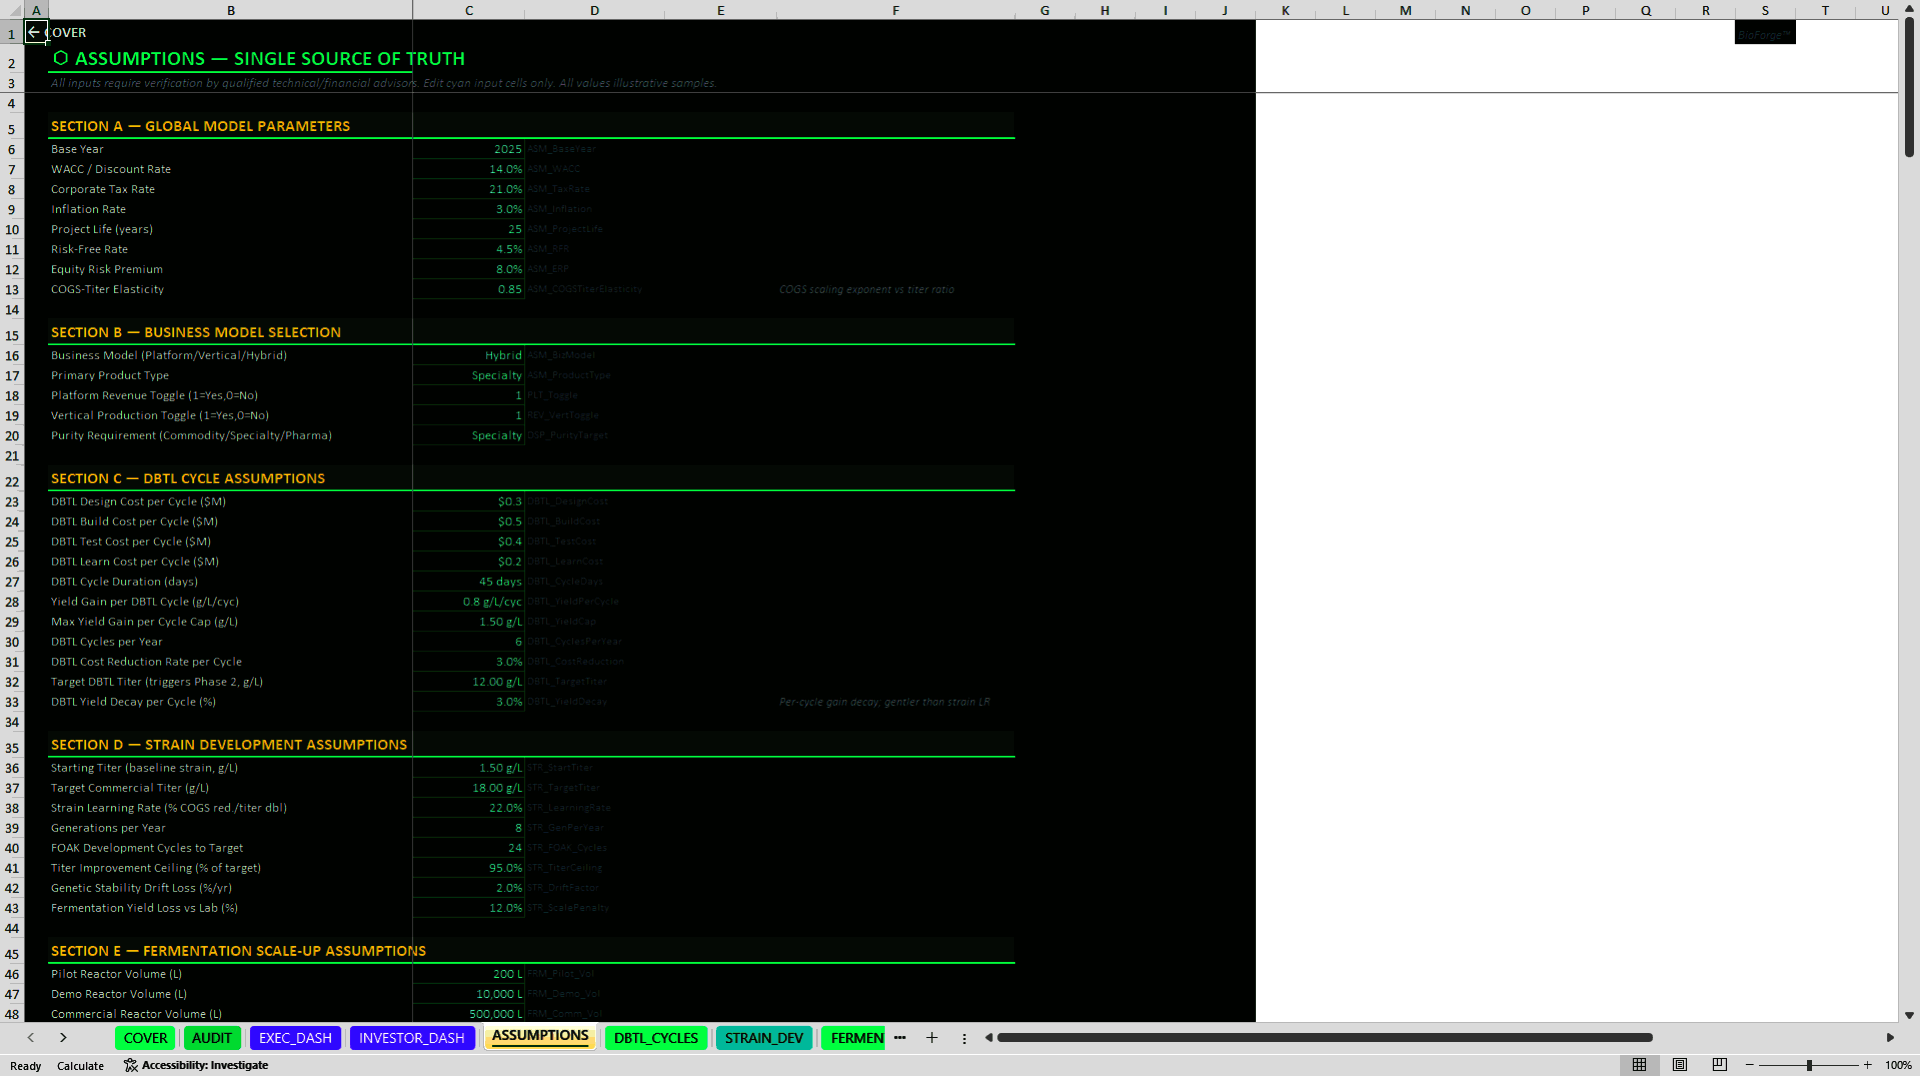
The ASSUMPTIONS sheet acts as the workbook's single source of truth. Editable inputs cover discount rates and taxes, business-model selection, product type, purity tier, DBTL cost and cadence, strain learning, titer targets, scale-up penalties, reactor configuration, feedstock and utility costs, CapEx, DSP recovery, platform partner economics, product pricing, scenarios, operating expenses, financing, and working capital. Users can replace the illustrative inputs with project-specific evidence while preserving the linked calculations.
🔬 DBTL AND STRAIN DEVELOPMENT
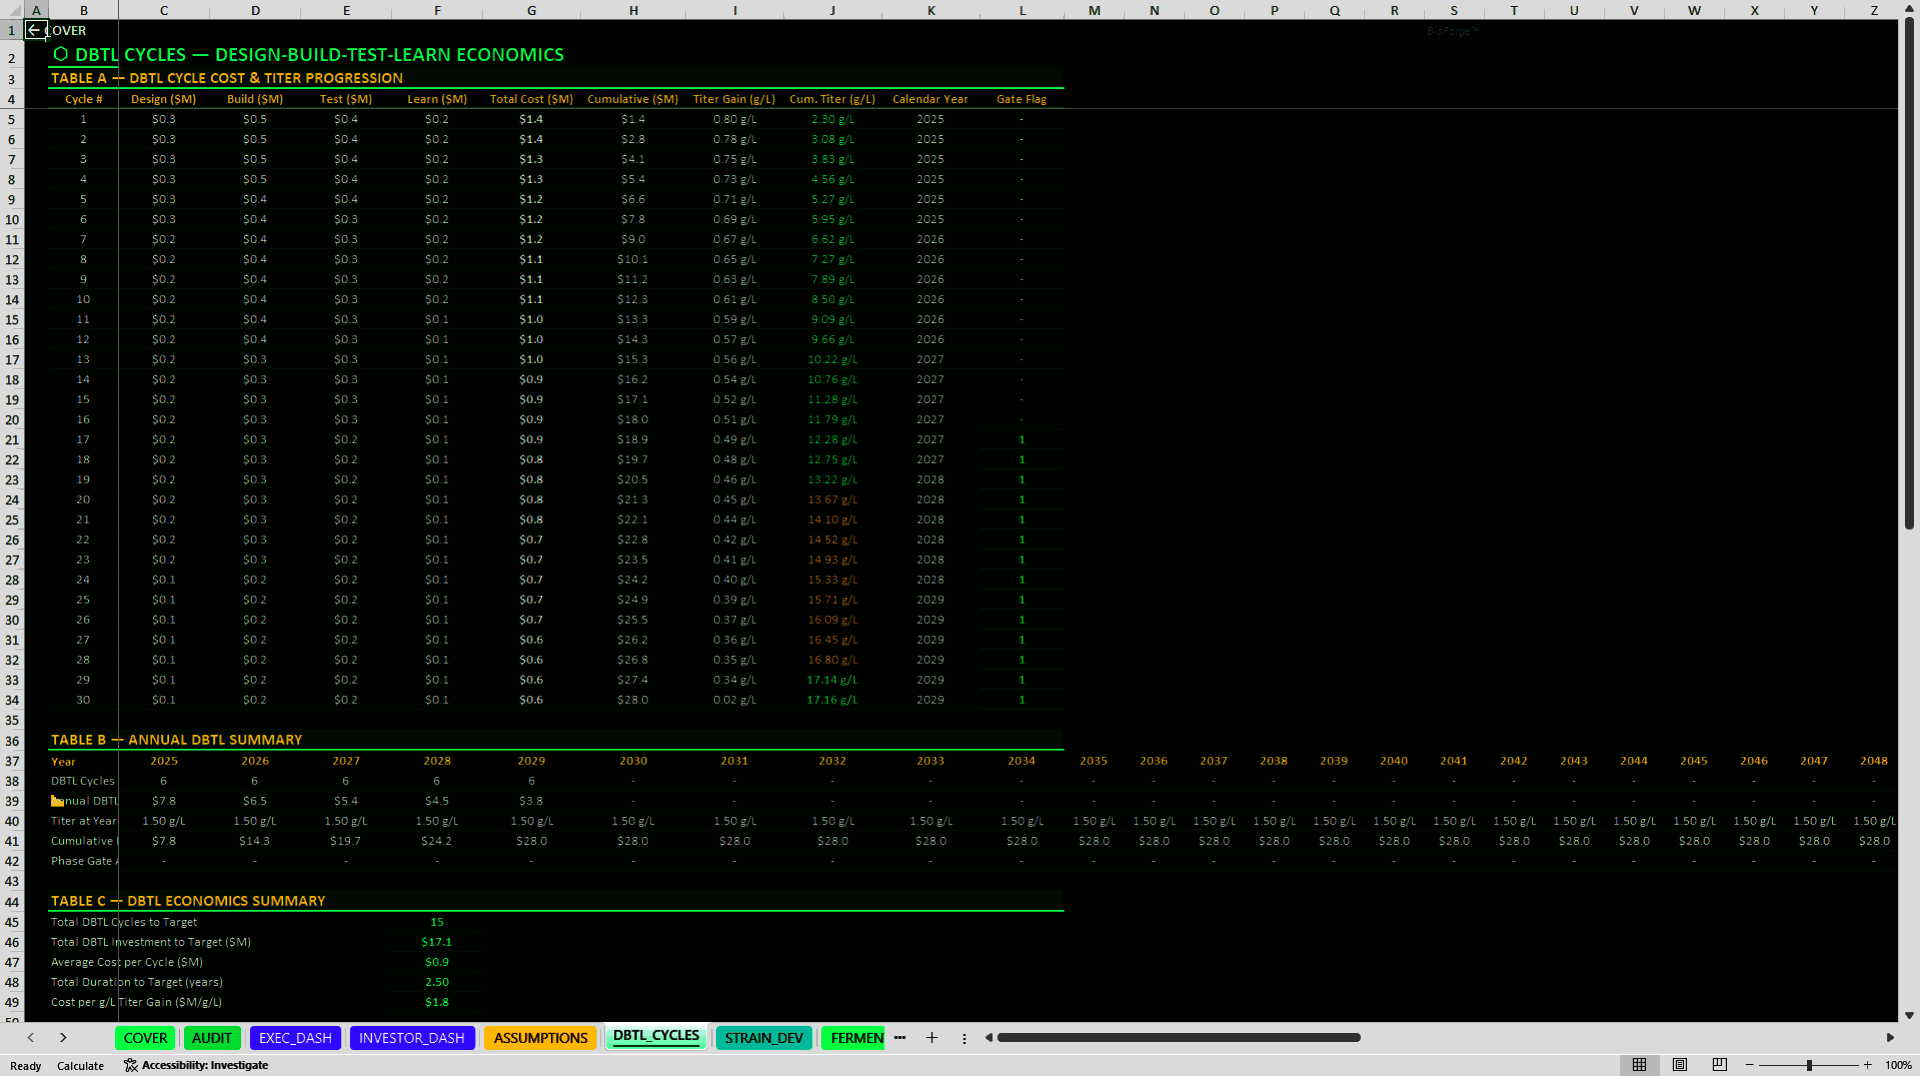
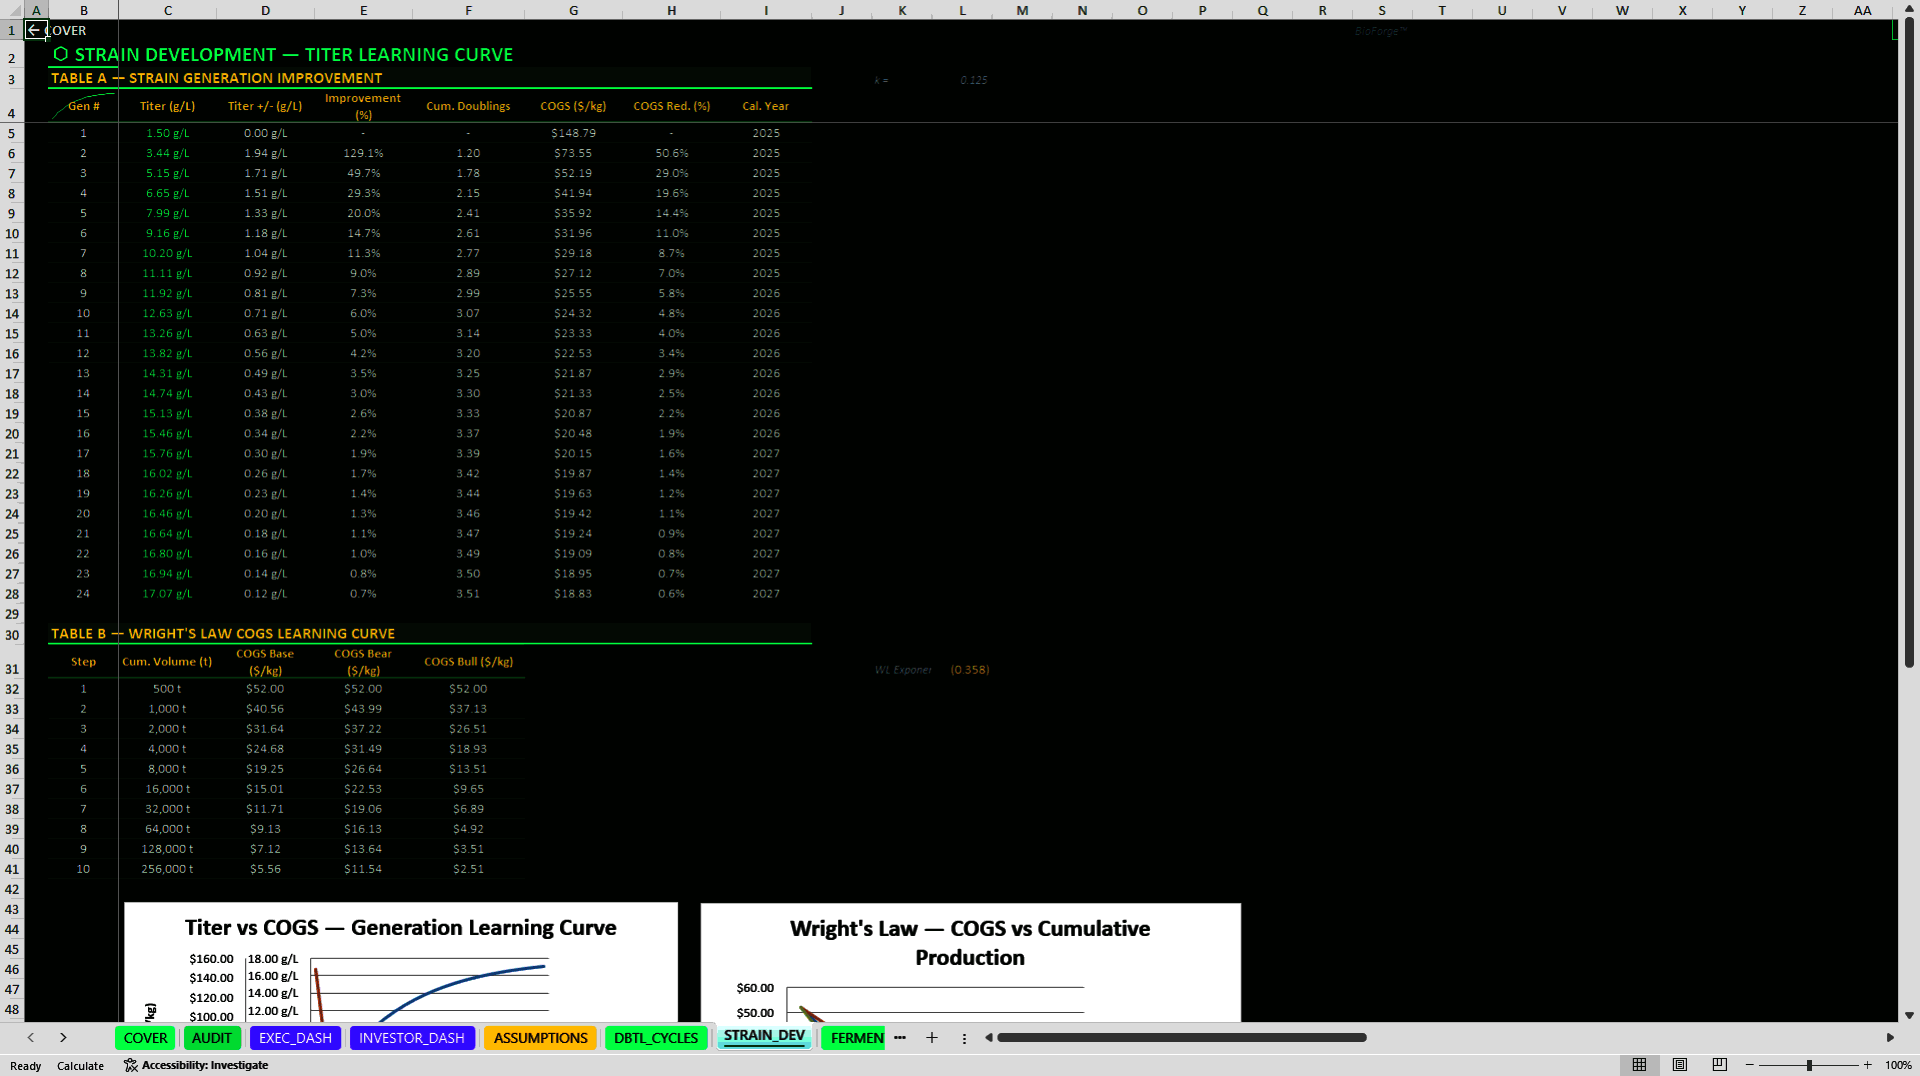
The DBTL_CYCLES module separates Design, Build, Test, and Learn costs by cycle, maps cycles to calendar years, calculates cumulative spend, and tracks titer against the phase-gate target. Annual summaries show completed cycles, year-end titer, DBTL spend, and cumulative investment. STRAIN_DEV models generation-by-generation titer improvement, cumulative doublings, implied COGS reduction, genetic stability considerations, and a Wright's Law volume-learning table with Base, Bear, and Bull cases.
🏭 FERMENTATION AND CAPACITY
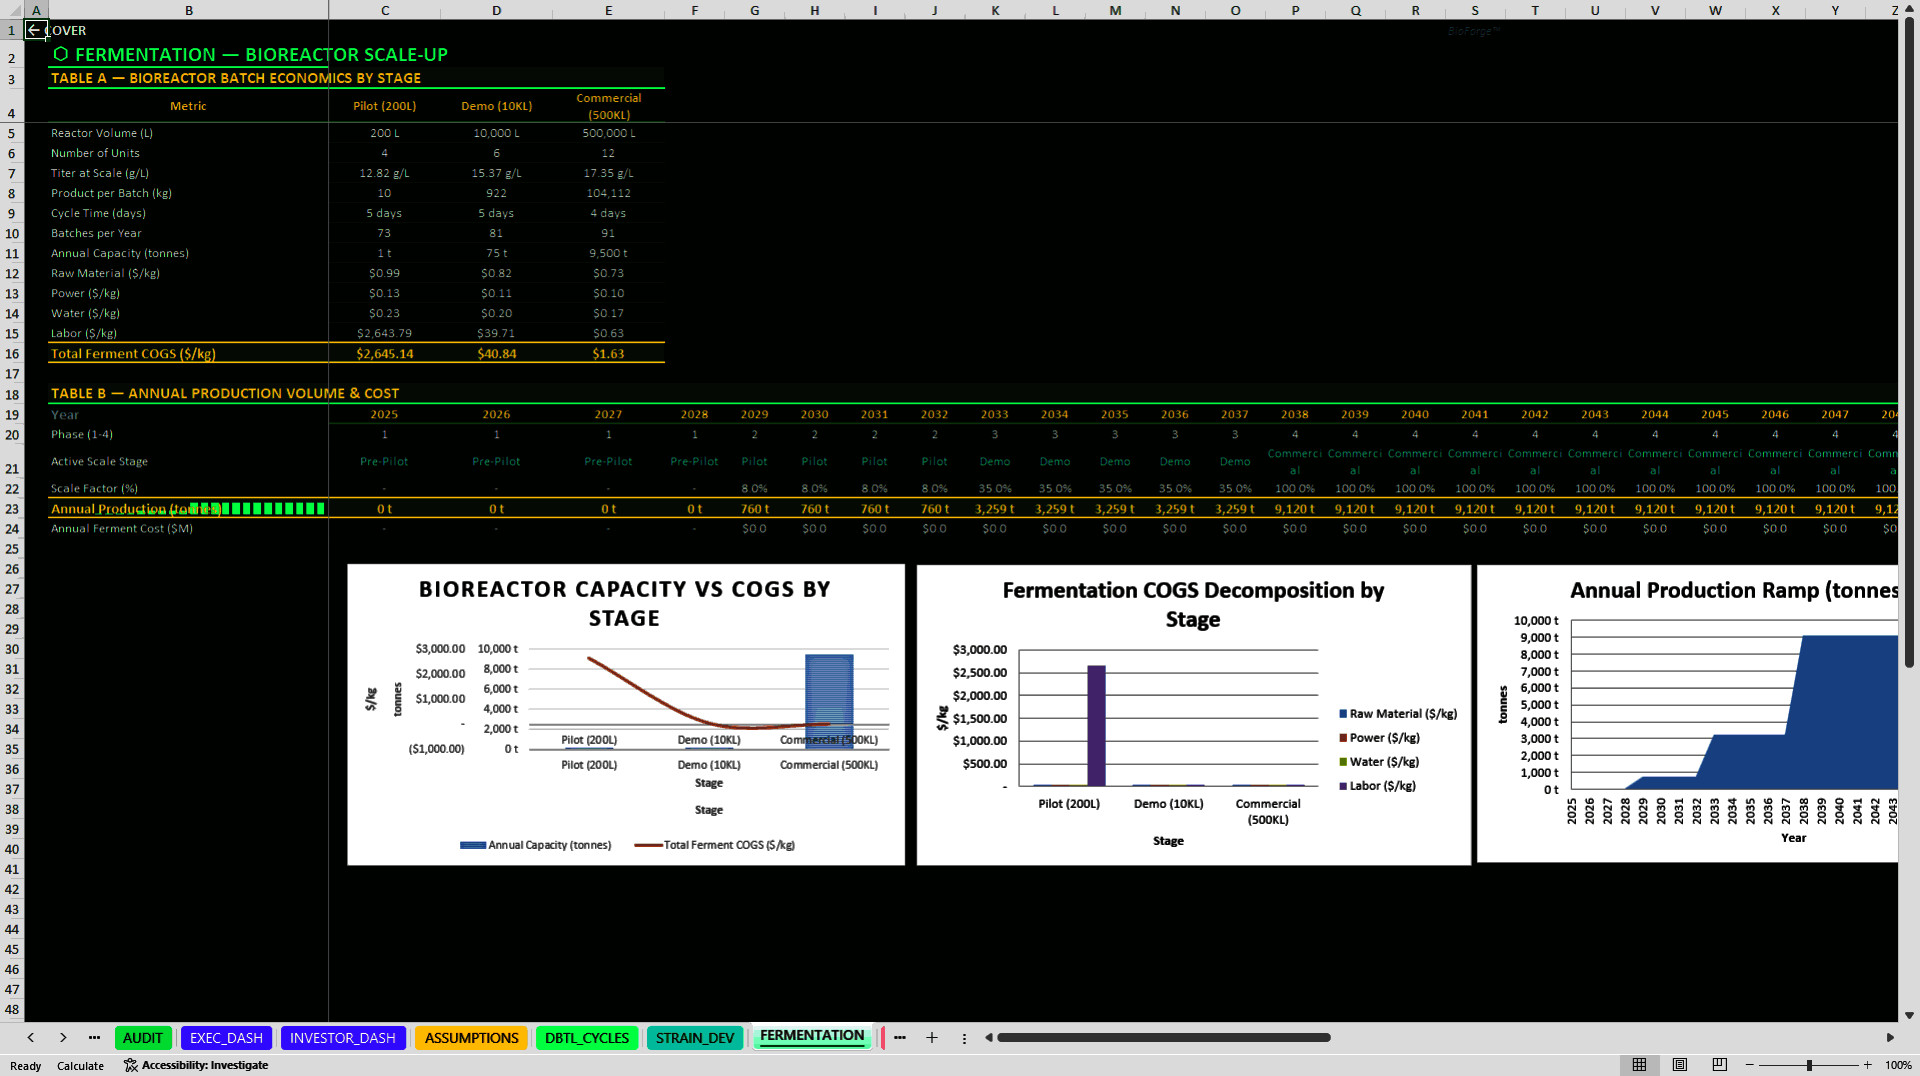
FERMENTATION models reactor volume, number of units, titer at scale, product per batch, cycle time, batches per year, annual capacity, raw-material cost, power, water, labor, and total fermentation cost for Pilot, Demo, and Commercial stages. Annual production is driven by development phase and scale factor. This creates a visible bridge from laboratory performance to manufacturable output and avoids treating commercial capacity as a simple multiple of lab results.
🏗️ CAPEX AND PROJECT PHASING
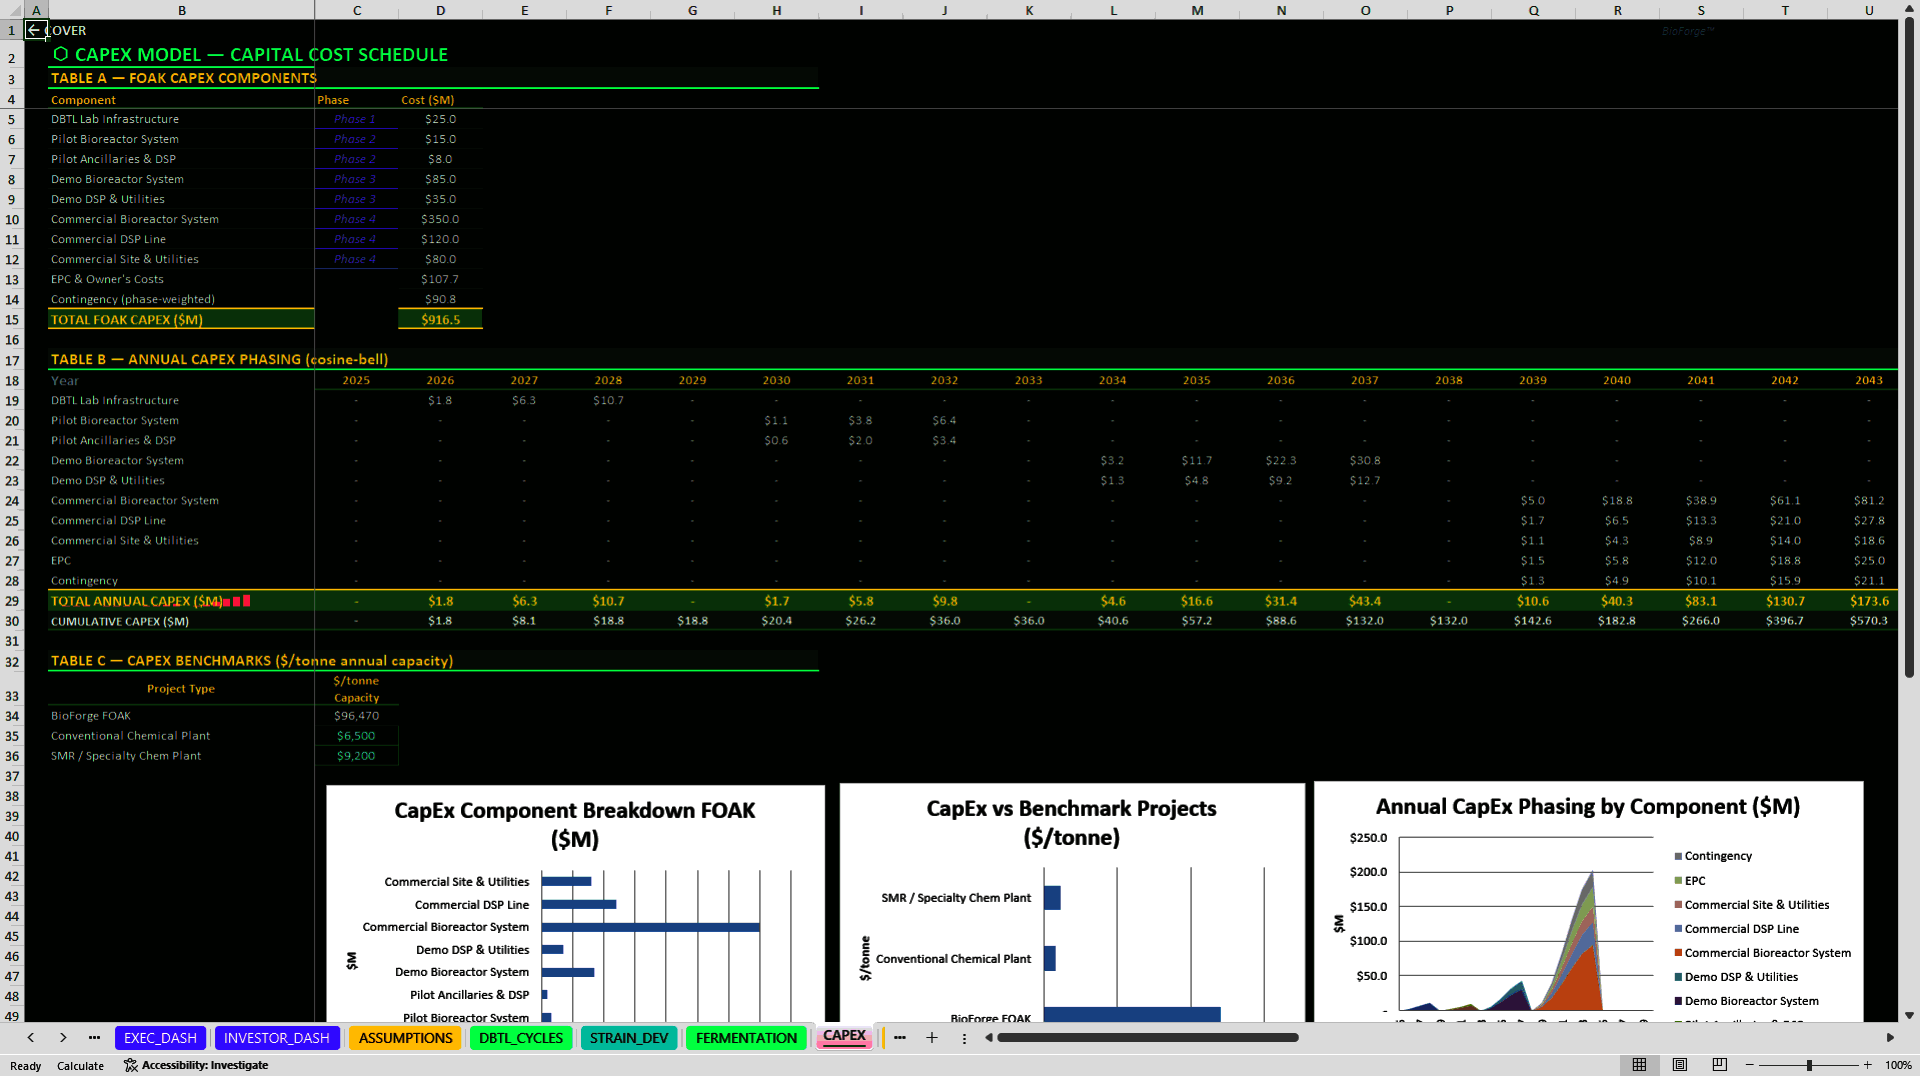
The CAPEX module builds first-of-a-kind requirements for the DBTL laboratory, pilot bioreactors, pilot ancillaries and DSP, demonstration bioreactors, demonstration DSP and utilities, commercial bioreactors, commercial DSP, site utilities, EPC and owner's costs, and contingency. Annual and cumulative phasing schedules support stage-gate planning, financing discussions, and facility-strategy review.
🧪 DSP AND COGS
The DSP module compares Commodity, Specialty, and Pharmaceutical purity tiers using editable purity targets, recovery rates, DSP cost percentages, annual cost reductions, and product-loss economics. A high-level method comparison covers membrane filtration, centrifugation, chromatography, and crystallization. The COGS_MODEL then creates a cost-per-kilogram waterfall for raw materials, fermentation labor, power, water, DSP, quality control, packaging and logistics, overhead, and waste treatment across Pilot, Demo, and Commercial stages.
💰 REVENUE AND BUSINESS-MODEL FLEXIBILITY
Platform economics include partner additions, commercialization timing, access fees, milestones, royalties, partner revenue, and ramp periods. Vertical economics include product sales, grants and government revenue, co-development, and optional carbon credits. Separate platform and vertical toggles allow the user to isolate each strategy or combine them in a Hybrid model. The REVENUE sheet consolidates enabled sources, calculates annual growth, and shows the changing platform-versus-vertical mix.
👥 OPEX, FINANCING, AND WORKING CAPITAL
OPEX includes scientists and engineers, process development, manufacturing operations, quality and regulatory personnel, business development, and G&A headcount. It also models salaries and benefits, laboratory consumables, DBTL spend, utilities, IP and legal costs, regulatory and compliance costs, marketing, G&A, insurance, and fermentation operating costs. FINANCING models annual equity raises, cumulative equity, debt draws, debt balances, and interest, while receivable, payable, biological-inventory, and minimum-cash assumptions feed the financial statements.
📊 FINANCIAL STATEMENTS AND RETURNS
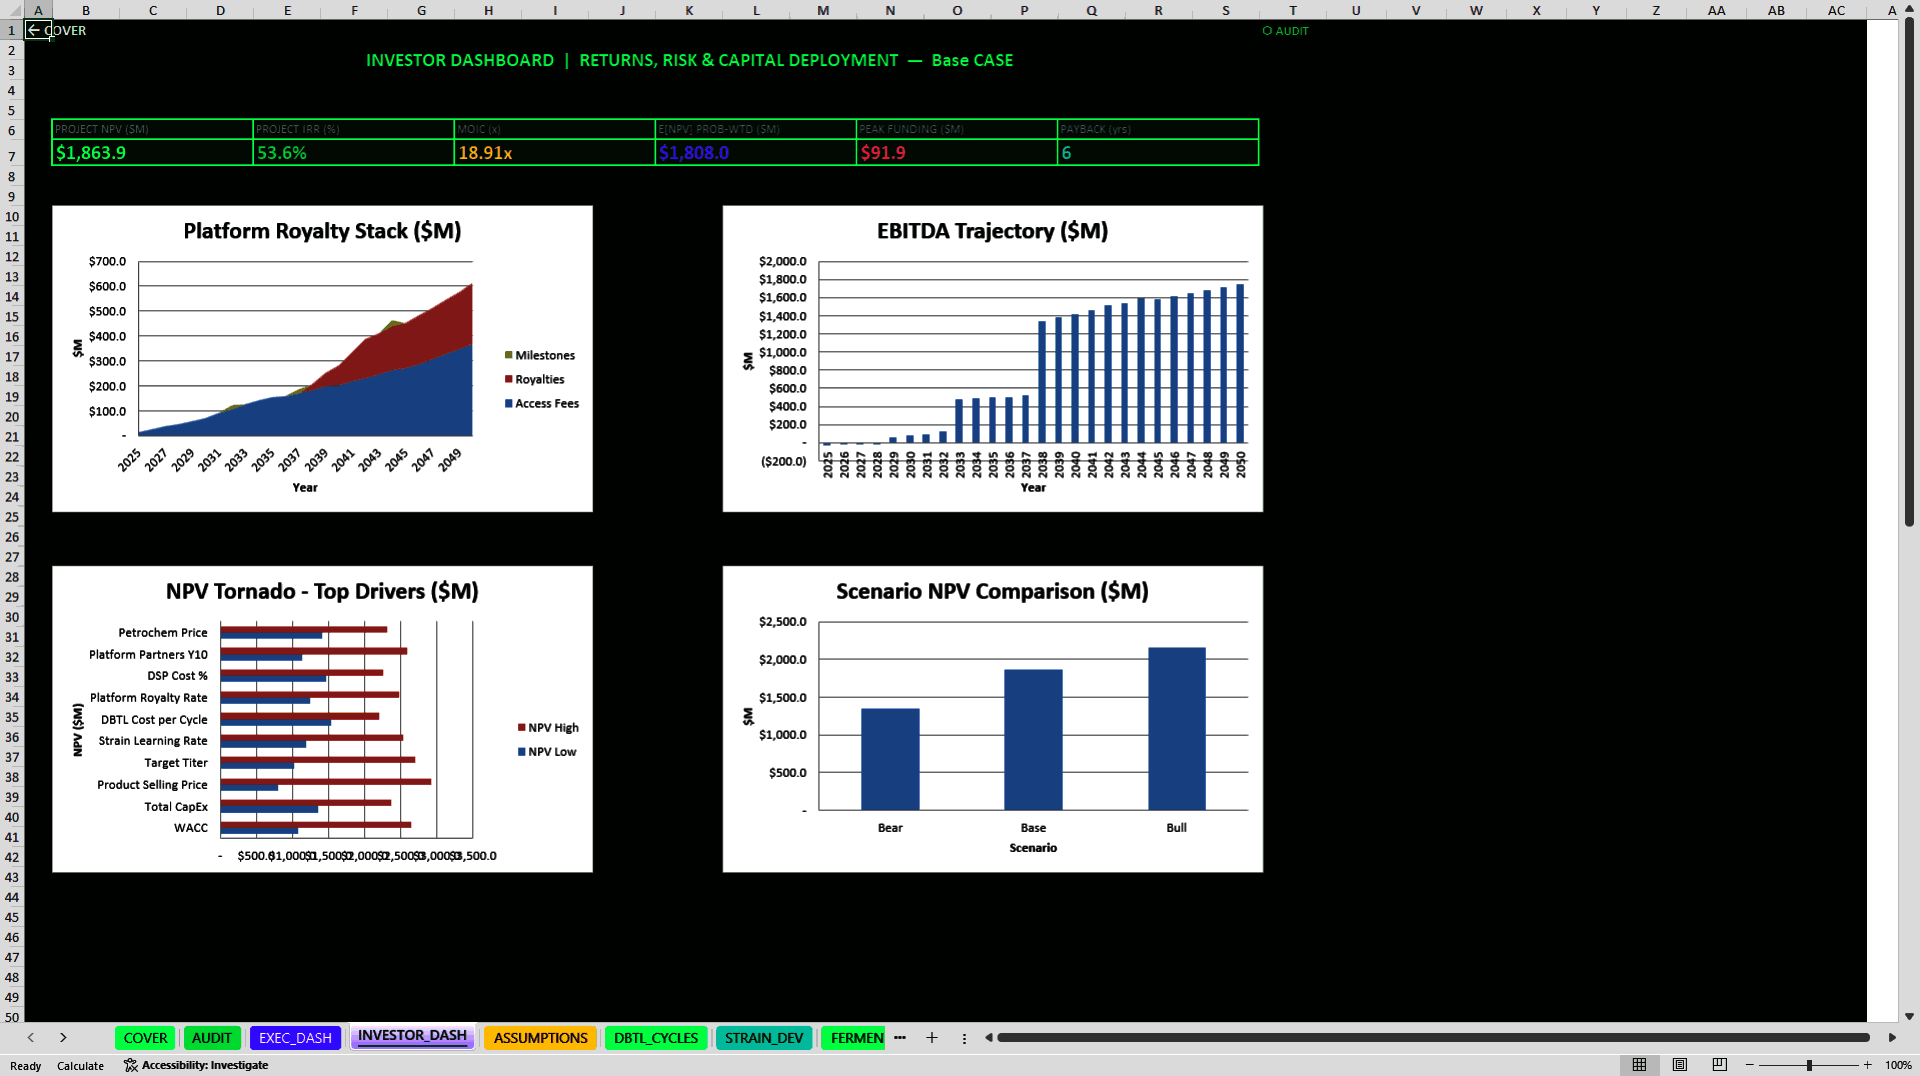
Linked Income Statement, Balance Sheet, and Cash Flow modules run through 2050. The model calculates revenue, COGS, gross profit, EBITDA, EBIT, taxes, net income, cash, receivables, inventory, PP&E, payables, debt, contributed capital, retained earnings, CFO, CFI, CFF, free cash flow, and closing cash. Investment outputs include project NPV, IRR, MOIC, payback status, peak funding need, present value of cash flow, and terminal value. Executive and investor dashboards highlight the most decision-relevant outputs.
📈 SCENARIOS, SENSITIVITIES, AND PRICE PARITY
Bear, Base, and Bull cases adjust technical timing, CapEx, and pricing factors. The comparison page shows NPV, IRR, MOIC, steady-state COGS, platform revenue, payback, scenario probabilities, and probability-weighted expected NPV. One-way coefficient-based tornado and spider analyses cover WACC, CapEx, product price, target titer, strain learning, DBTL cost, royalty rate, DSP cost, platform partners, and petrochemical price. The price-parity module compares bio-based COGS with petrochemical and specialty-chemical benchmarks and includes crossover-year sensitivity by learning rate and starting titer.
✅ WORKBOOK STRUCTURE AND CONTROLS
• Architecture: 22 purpose-built worksheets and a 26-year annual model. • Navigation: Cover, Executive Dashboard, Investor Dashboard, and linked analytical modules. • Auditability: centralized inputs, 148 workbook-level defined names, and 38 built-in checks for accounting ties, roll-forwards, input bounds, technical relationships, scenario probabilities, and return outputs. • Presentation: 38 native charts across dashboards and analytical sheets. • File design: no macros and no external-workbook links identified.
🚀 RECOMMENDED WORKFLOW
1. Preserve an untouched original copy. • 2. Replace the illustrative assumptions with verified project data. • 3. Select the business model, product profile, purity requirement, and scenario. • 4. Review DBTL, strain, fermentation, DSP, COGS, CapEx, revenue, OPEX, and financing outputs. • 5. Validate the three financial statements and funding profile. • 6. Examine valuation, price parity, scenario, and sensitivity results. • 7. Confirm the AUDIT sheet is clear before presenting conclusions.
👤 INTENDED USERS
• Synthetic-biology and precision-fermentation founders, CFOs, and strategy teams. • Biofoundry and industrial-biotechnology operators. • Venture capital, growth equity, corporate venture, and project-finance investors. • Consultants, transaction advisers, and feasibility professionals. • Licensing, business-development, and strategic-partnership teams. • Technical leaders translating laboratory and scale-up assumptions into financial consequences.
Got a question about the product? Email us at support@flevy.com or ask the author directly by using the "Ask the Author a Question" form. If you cannot view the preview above this document description, go here to view the large preview instead.
Source: Best Practices in Biotech, Integrated Financial Model Excel: Synthetic Biology and Biofoundry Financial Model Excel (XLSX) Spreadsheet, PDMM Financial Models
ABOUT THE AUTHOR

PDMM Financial Models develops professional, decision-ready Excel models for business owners, entrepreneurs, investors, consultants, analysts, and finance teams. Our objective is to transform complex business assumptions into clear, structured analysis that supports better planning and investment decisions.
Our models cover business planning, forecasting, budgeting, feasibility analysis,
... [read more]
Ask the Author a Question
You must be logged in to contact the author.




























