
 Click main image to view in full screen. Unlock all 17 preview images:
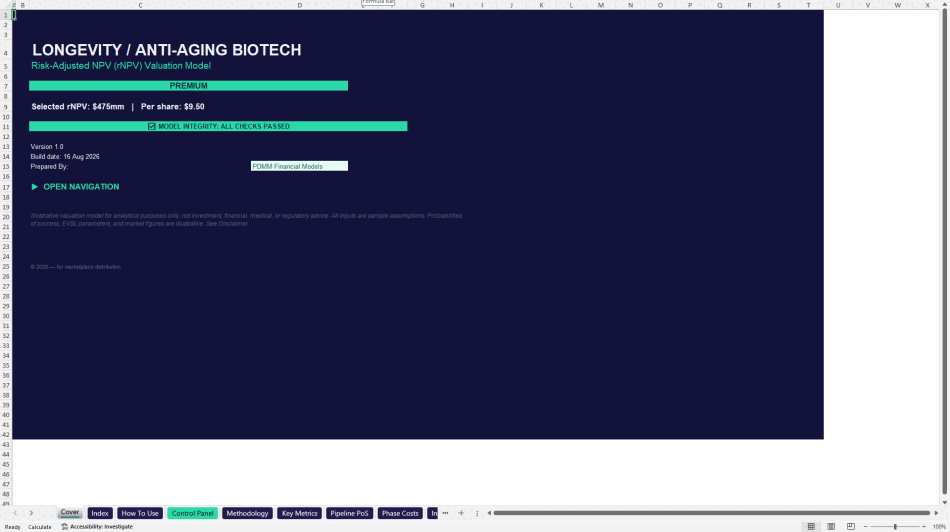
Longevity Biotech rNPV Valuation Model – Excel XLSX
Excel (XLSX) + supplemental PDF


BENEFITS OF THIS DOWNLOADABLE EXCEL DOCUMENT
- Evaluate a longevity biotech program using a linked phase-probability, commercial, development-cost, and 20-year risk-adjusted NPV framework.
- Compare full development with licensing or partnering economics while testing Bear, Base, and Bull assumptions across the model.
- Present key valuation, pipeline, commercial, sensitivity, and strategy outputs through structured summaries, audit checks, and dashboards.
BIOTECH EXCEL DESCRIPTION
🧬 LONGEVITY / ANTI-AGING BIOTECH rNPV MODEL
PURPOSE OF THE MODEL
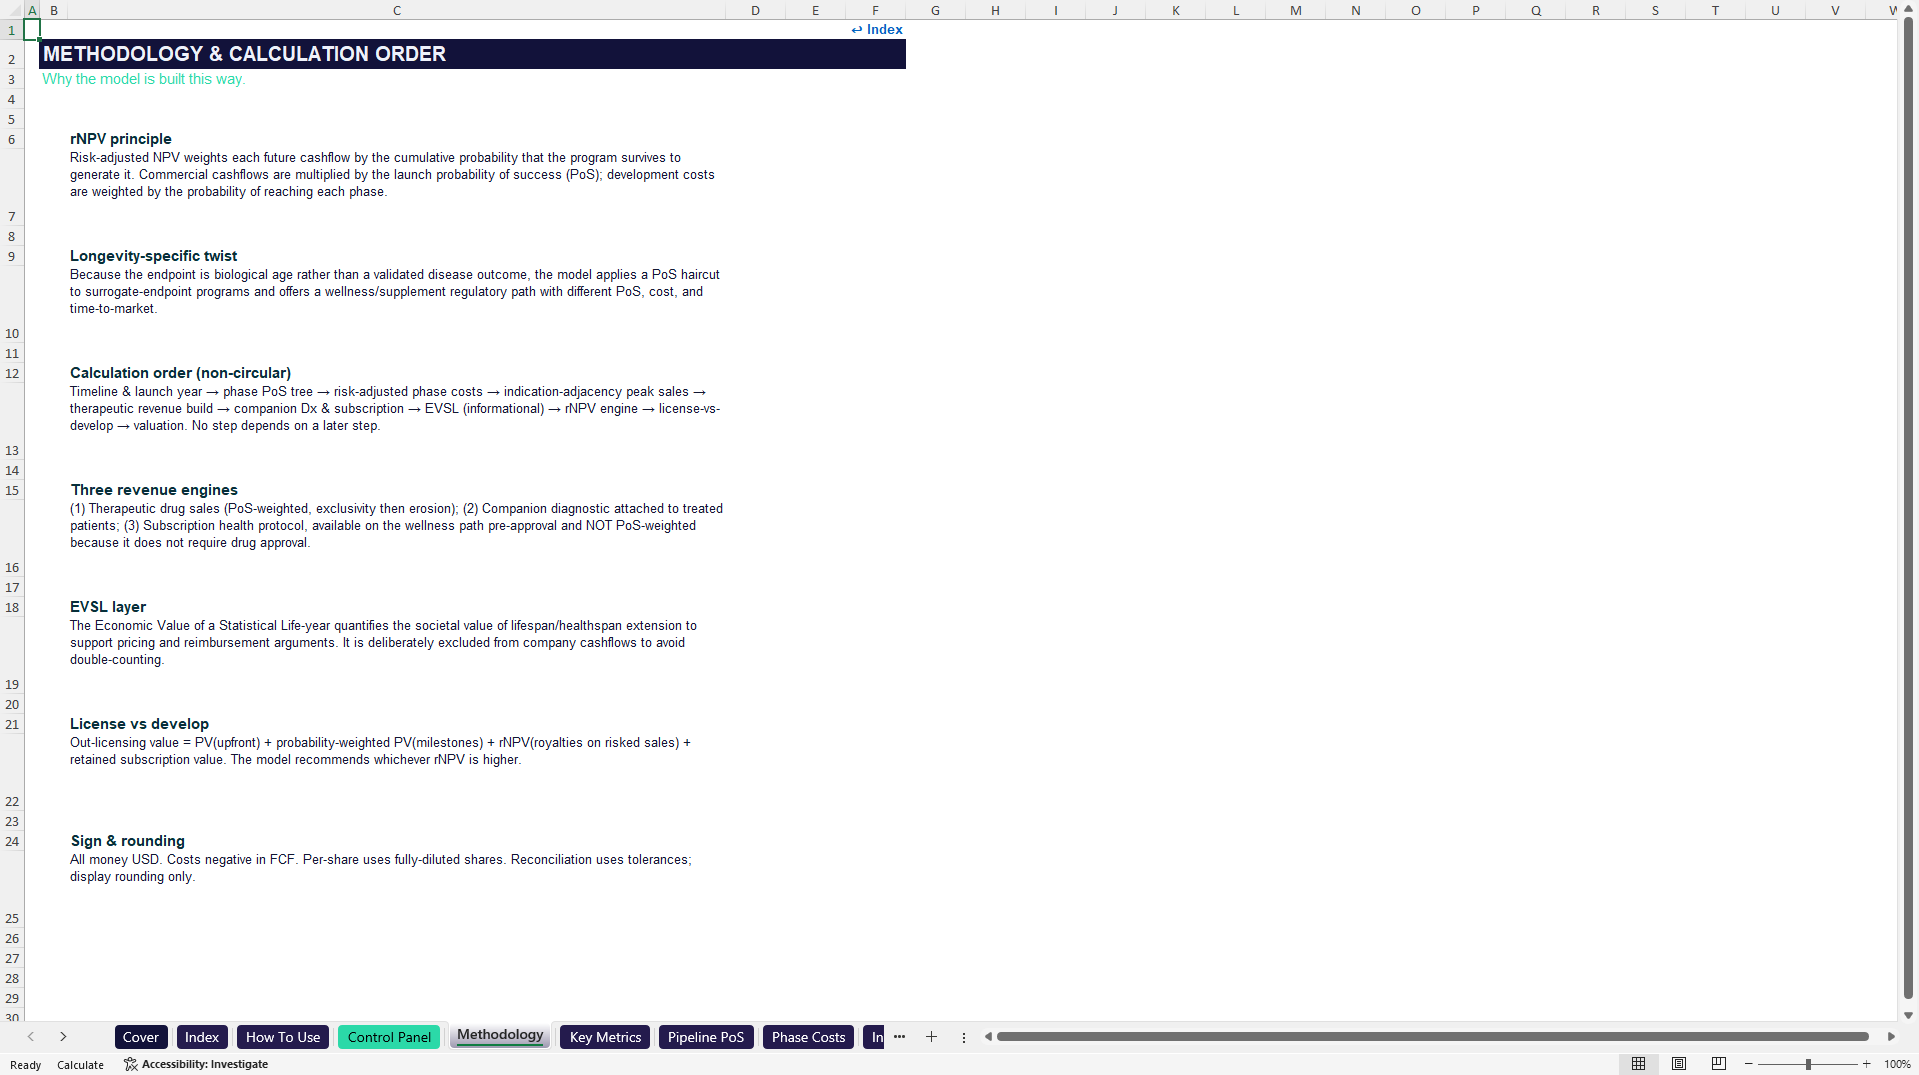
This Excel workbook is built for risk-adjusted valuation and strategic analysis of a longevity or anti-aging biotechnology program. It combines clinical probability of success, development timing and cost, therapeutic revenue, companion diagnostics, a recurring subscription protocol, licensing economics, scenario analysis, and a 20-year annual rNPV engine in one linked model.
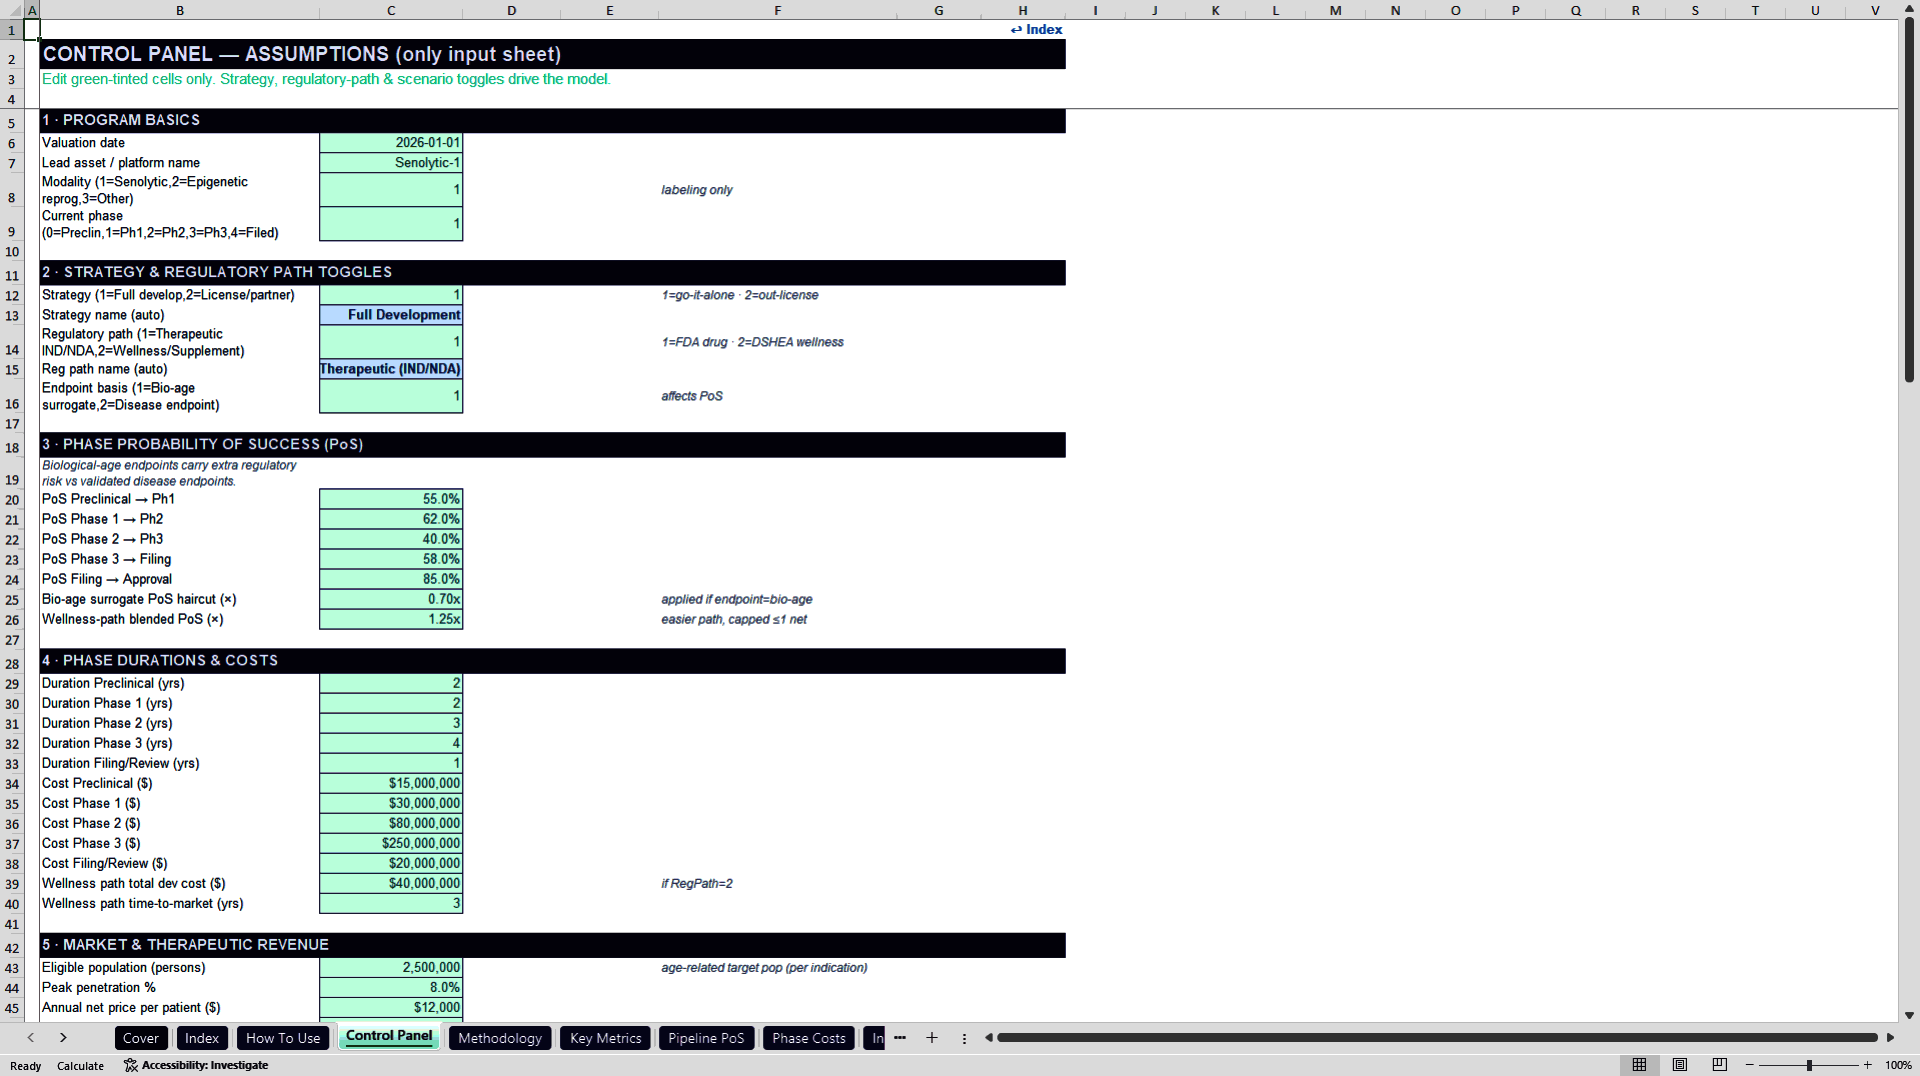
⚙️ CENTRALIZED INPUT CONTROL
The Control Panel is the main input sheet and contains the assumptions that drive the workbook. Users can set the development strategy, regulatory path, endpoint basis, current phase, phase probabilities, development durations and costs, market assumptions, indication adjacencies, diagnostic economics, subscription assumptions, licensing terms, WACC, tax, shares, and Bear/Base/Bull scenario.
🧪 DEVELOPMENT RISK AND PIPELINE ECONOMICS
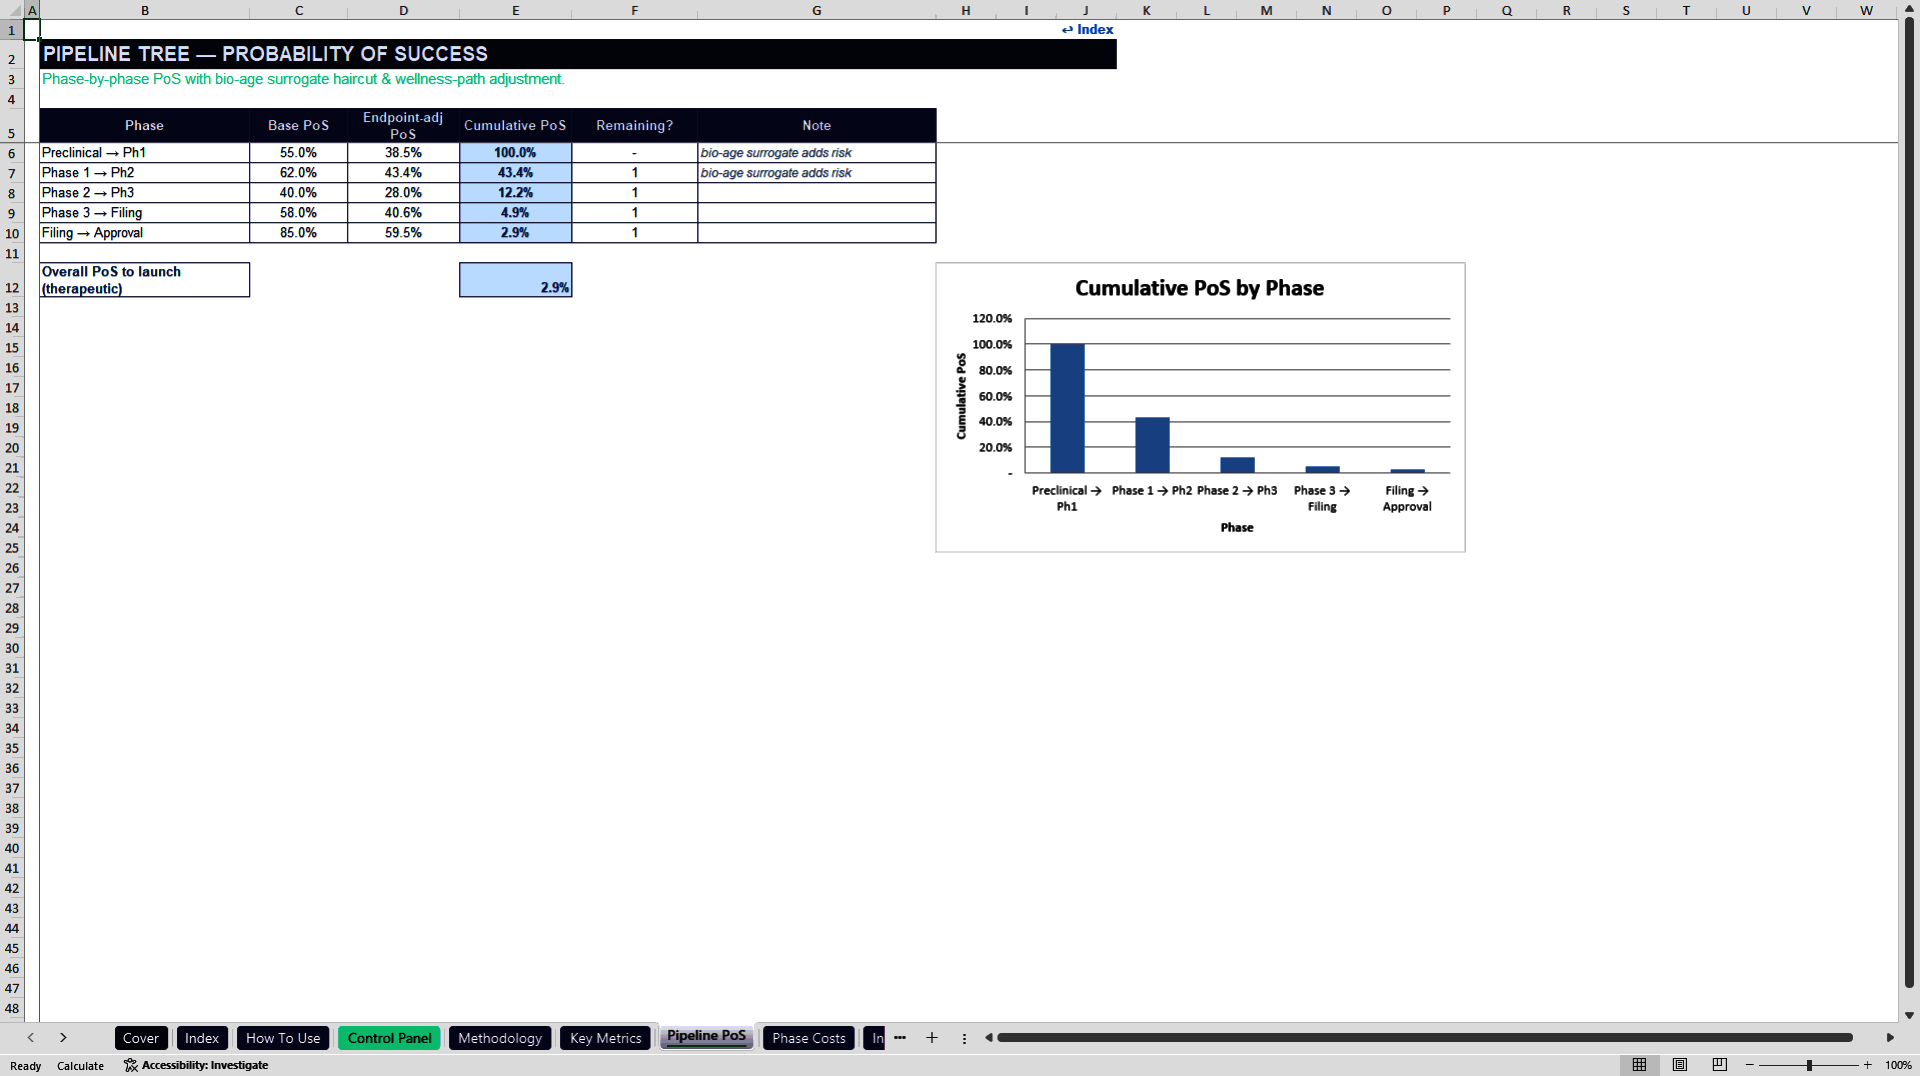
The Pipeline PoS module calculates phase-by-phase and cumulative probability of launch. A biological-age surrogate endpoint can receive a user-defined probability haircut, while the wellness/supplement path uses a separate blended probability multiplier. Remaining development spending is placed across the annual timeline according to the selected phase and path.
📈 COMMERCIAL MODEL
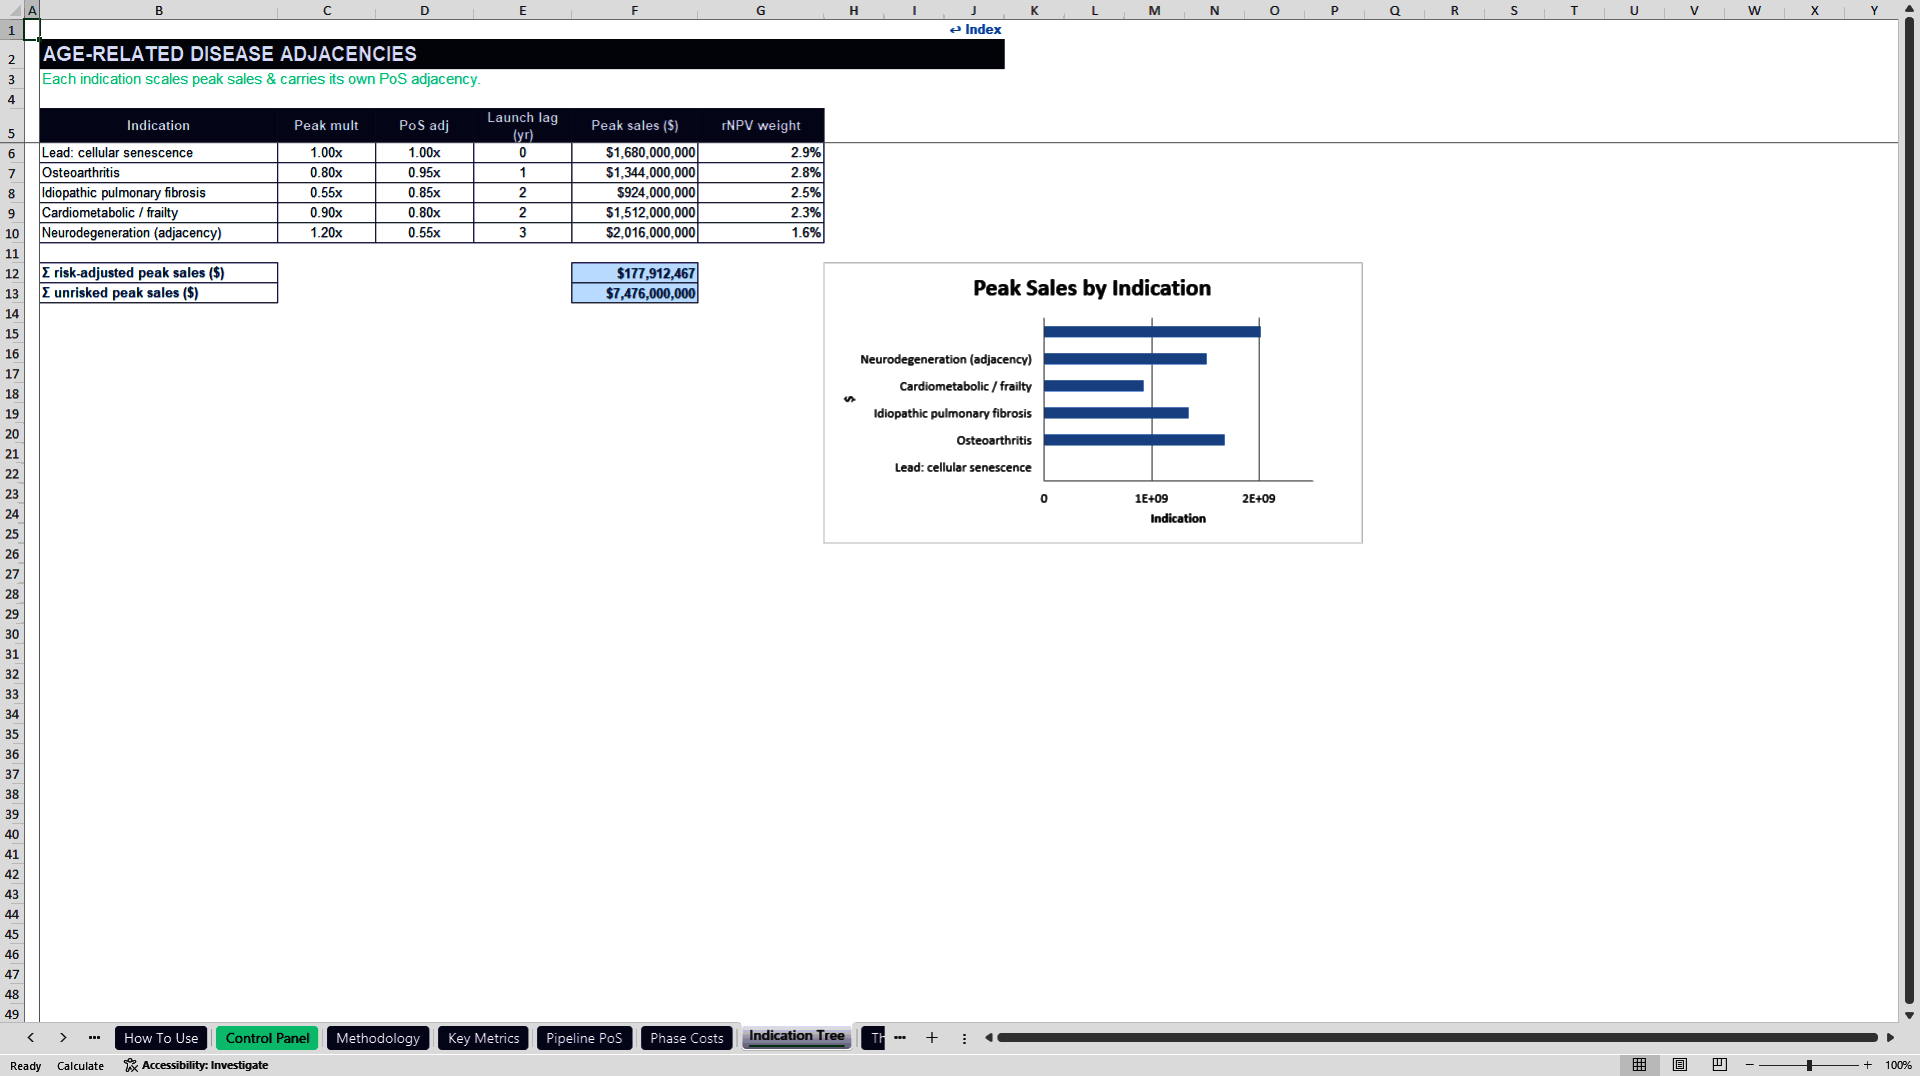
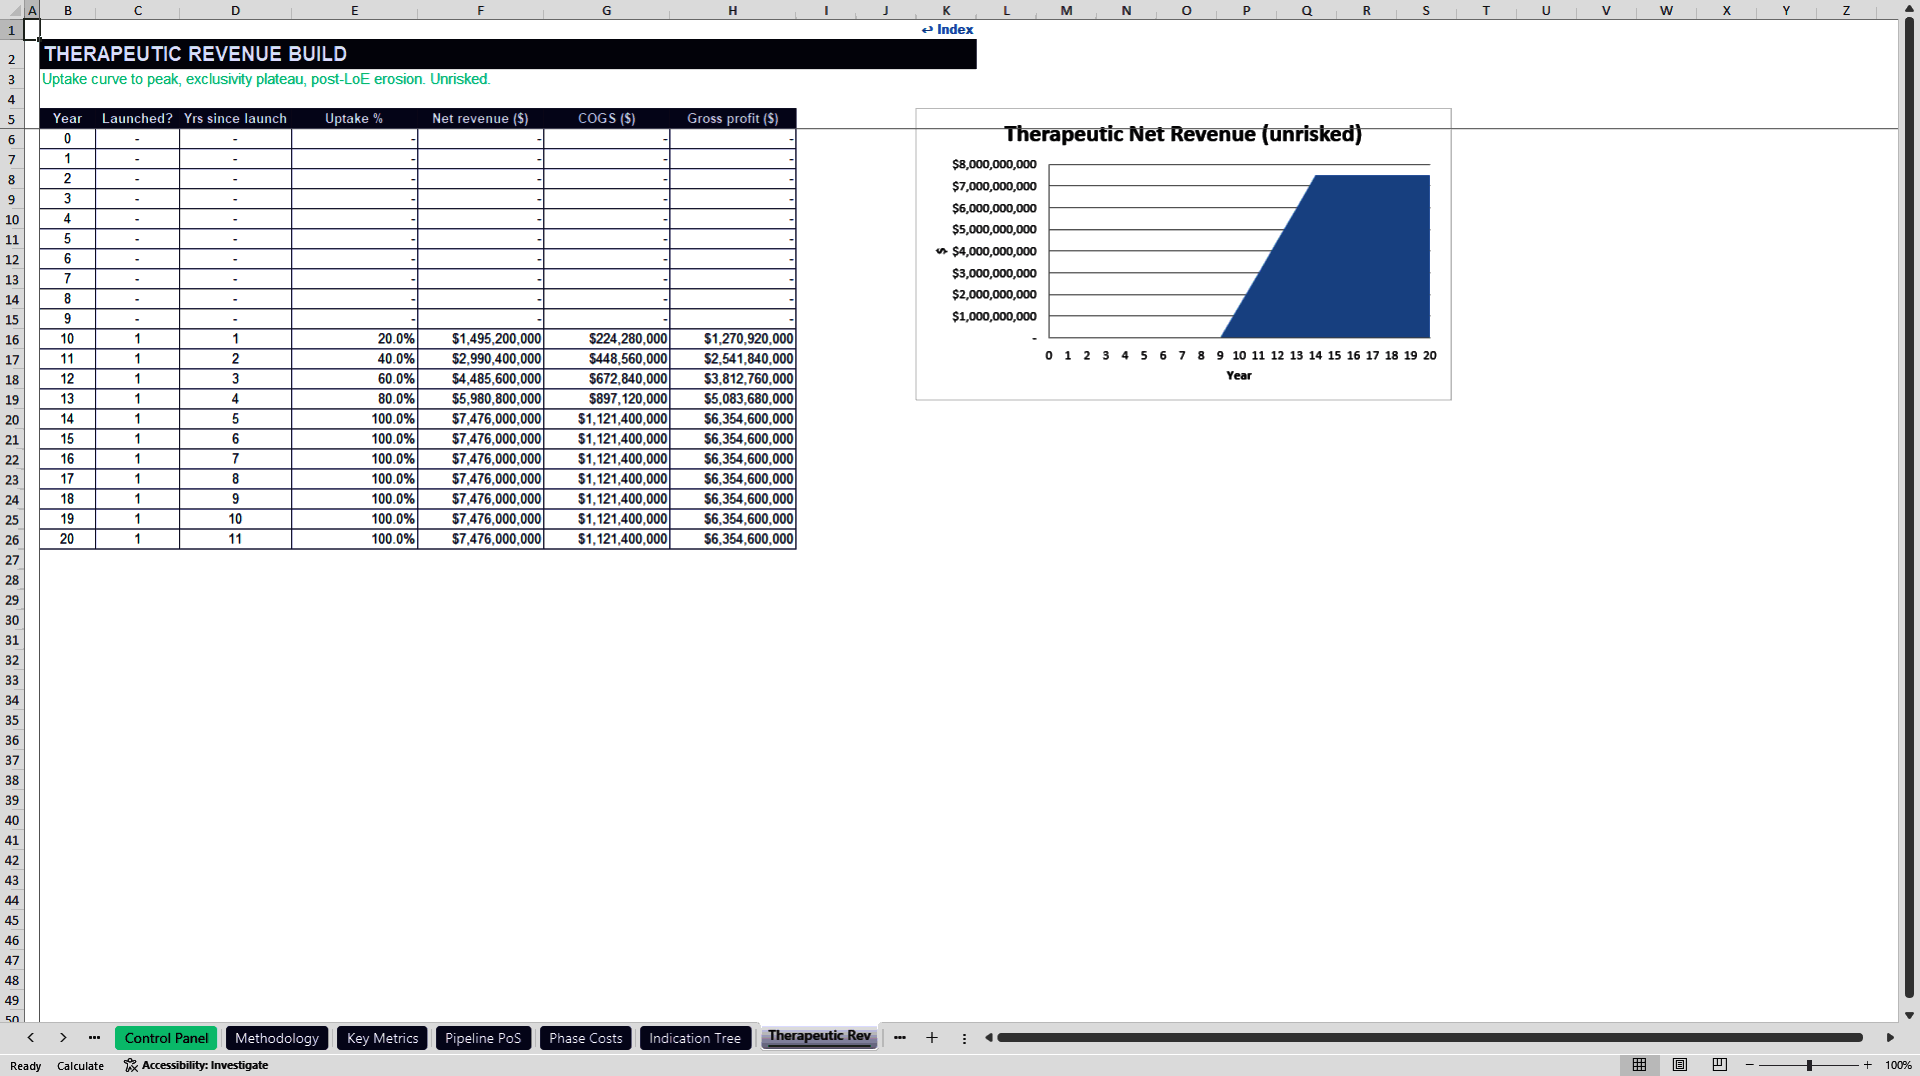
The therapeutic revenue build models five age-related indication opportunities, each with its own peak-sales multiplier, probability adjustment, and launch lag. Revenue ramps to peak using the selected uptake period, then reflects exclusivity and post-loss-of-exclusivity erosion. COGS and commercial SG&A are included in the linked valuation logic.
Additional optional modules include:
• Companion diagnostic revenue, testing frequency, attach rate, and gross margin.
• Subscription health-protocol members, pricing, growth, churn, saturation cap, timing, and gross margin.
• EVSL / lifespan-extension societal-value analysis for pricing and policy context.
• Out-licensing value from upfront, probability-weighted milestones, royalties, retained subscription value, and retained development cost.
💰 rNPV AND STRATEGY COMPARISON
The rNPV Engine calculates annual risk-adjusted free cash flow and present value using launch probability, risk-adjusted development cost, tax, and WACC. The Valuation sheet reports full-development rNPV, license/partner rNPV, selected rNPV, per-share value, risk-adjusted peak sales, and an unrisked NPV reference.
The License vs Develop module compares the two strategic routes and identifies which produces the higher modeled value under the current assumptions. The strategy selector determines which valuation is presented as the selected rNPV.
🌡️ SCENARIOS AND SENSITIVITY
Bear, Base, and Bull scenarios flow through probability of success, peak sales, price, subscription growth, and development cost multipliers. Dedicated sensitivity views include a launch-PoS-versus-peak-sales grid and a price-versus-penetration grid with a tornado-style driver ranking. These sensitivity tables are indicative scaling analyses around the base full-development rNPV rather than full Excel Data Table re-runs.
📊 DASHBOARDS AND CONTROLS
The workbook includes a KPI Summary, an executive dashboard, a pipeline dashboard, and 17 embedded charts across the model. A dedicated Audit sheet checks important relationships and input ranges. In the supplied workbook, all audit checks pass and the scan shows no common Excel formula errors.
👥 BEST SUITED FOR
• Biotech founders, finance leaders, and corporate-development teams.
• Venture funds, investors, analysts, and consultants evaluating longevity biotech assets.
• Licensing and partnering discussions where full development must be compared with an out-licensing strategy.
• Decision-makers who need a structured risk-adjusted valuation with optional diagnostic and recurring-revenue layers.
📦 FILE PROVIDED
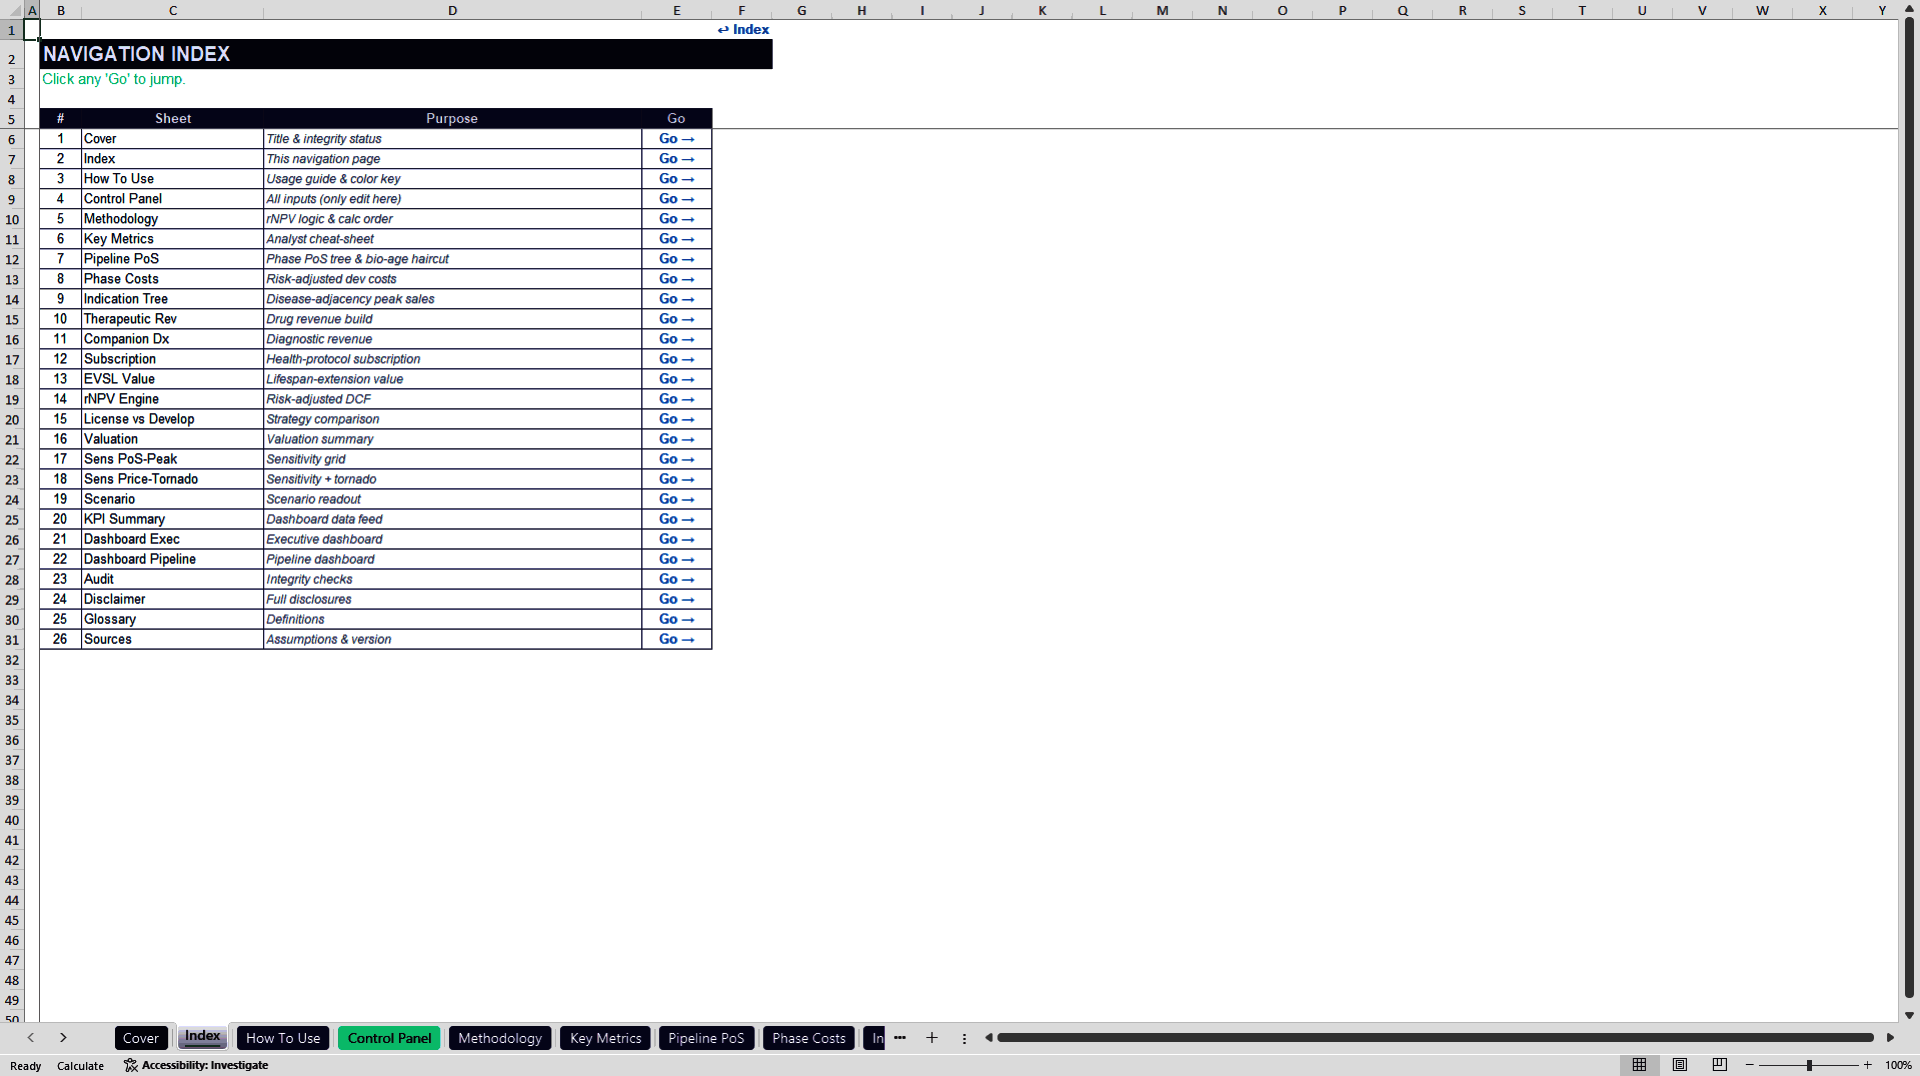
One editable Excel workbook with 27 sheets, a fixed annual Y0–Y20 timeline, centralized assumptions, linked rNPV calculations, strategy comparison, scenarios, sensitivity views, integrity checks, and dashboards. Screenshots and PDF preview are not included because the seller will create them separately.
Got a question about the product? Email us at support@flevy.com or ask the author directly by using the "Ask the Author a Question" form. If you cannot view the preview above this document description, go here to view the large preview instead.
Source: Best Practices in Biotech, Integrated Financial Model Excel: Longevity Biotech rNPV Valuation Model Excel (XLSX) Spreadsheet, PDMM Financial Models
ABOUT THE AUTHOR

PDMM Financial Models develops professional, decision-ready Excel models for business owners, entrepreneurs, investors, consultants, analysts, and finance teams. Our objective is to transform complex business assumptions into clear, structured analysis that supports better planning and investment decisions.
Our models cover business planning, forecasting, budgeting, feasibility analysis,
... [read more]
Ask the Author a Question
You must be logged in to contact the author.




























