
Store Expansion: 5 Year DCF Fin. Model with Impact Analysis – Excel XLSX
Excel (XLSX) + supplemental PDF
BENEFITS OF THIS DOWNLOADABLE EXCEL DOCUMENT
- The first strategy consists of a gradual expansion by using debt and equity financing, as well as cash generated from operations.
- The second strategy consist of a faster expansion of the business by getting financed from a Fund and repaying this liability with a percentage of the revenues of the expanded business, additionally to optimize cash flows the business sells and lease back
- For each of these entities: the business with organic growth, the business with revenue-based financing, and the Fund, the model generates the three financial statements, calculates the relevant metrics, and performs a valuation for all entities. All this
RETAIL STRATEGY EXCEL DESCRIPTION
This DCF model presents the impact of store expansion strategies of a business over a 5-year period.
The first strategy consists of a gradual expansion by using debt and equity financing, as well as cash generated from operations.
The second strategy consist of a faster expansion of the business by getting financed from a Fund and repaying this liability with a percentage of the revenues of the expanded business, additionally to optimize cash flows the business sells and lease back its current assets and repurchase them at the end of the deal with the Fund.
For each of these entities: the business with organic growth, the business with revenue-based financing, and the Fund, the model generates the three financial statements, calculates the relevant metrics, and performs a valuation for all entities. All this is supplemented with graphs, KPIs and a summary.
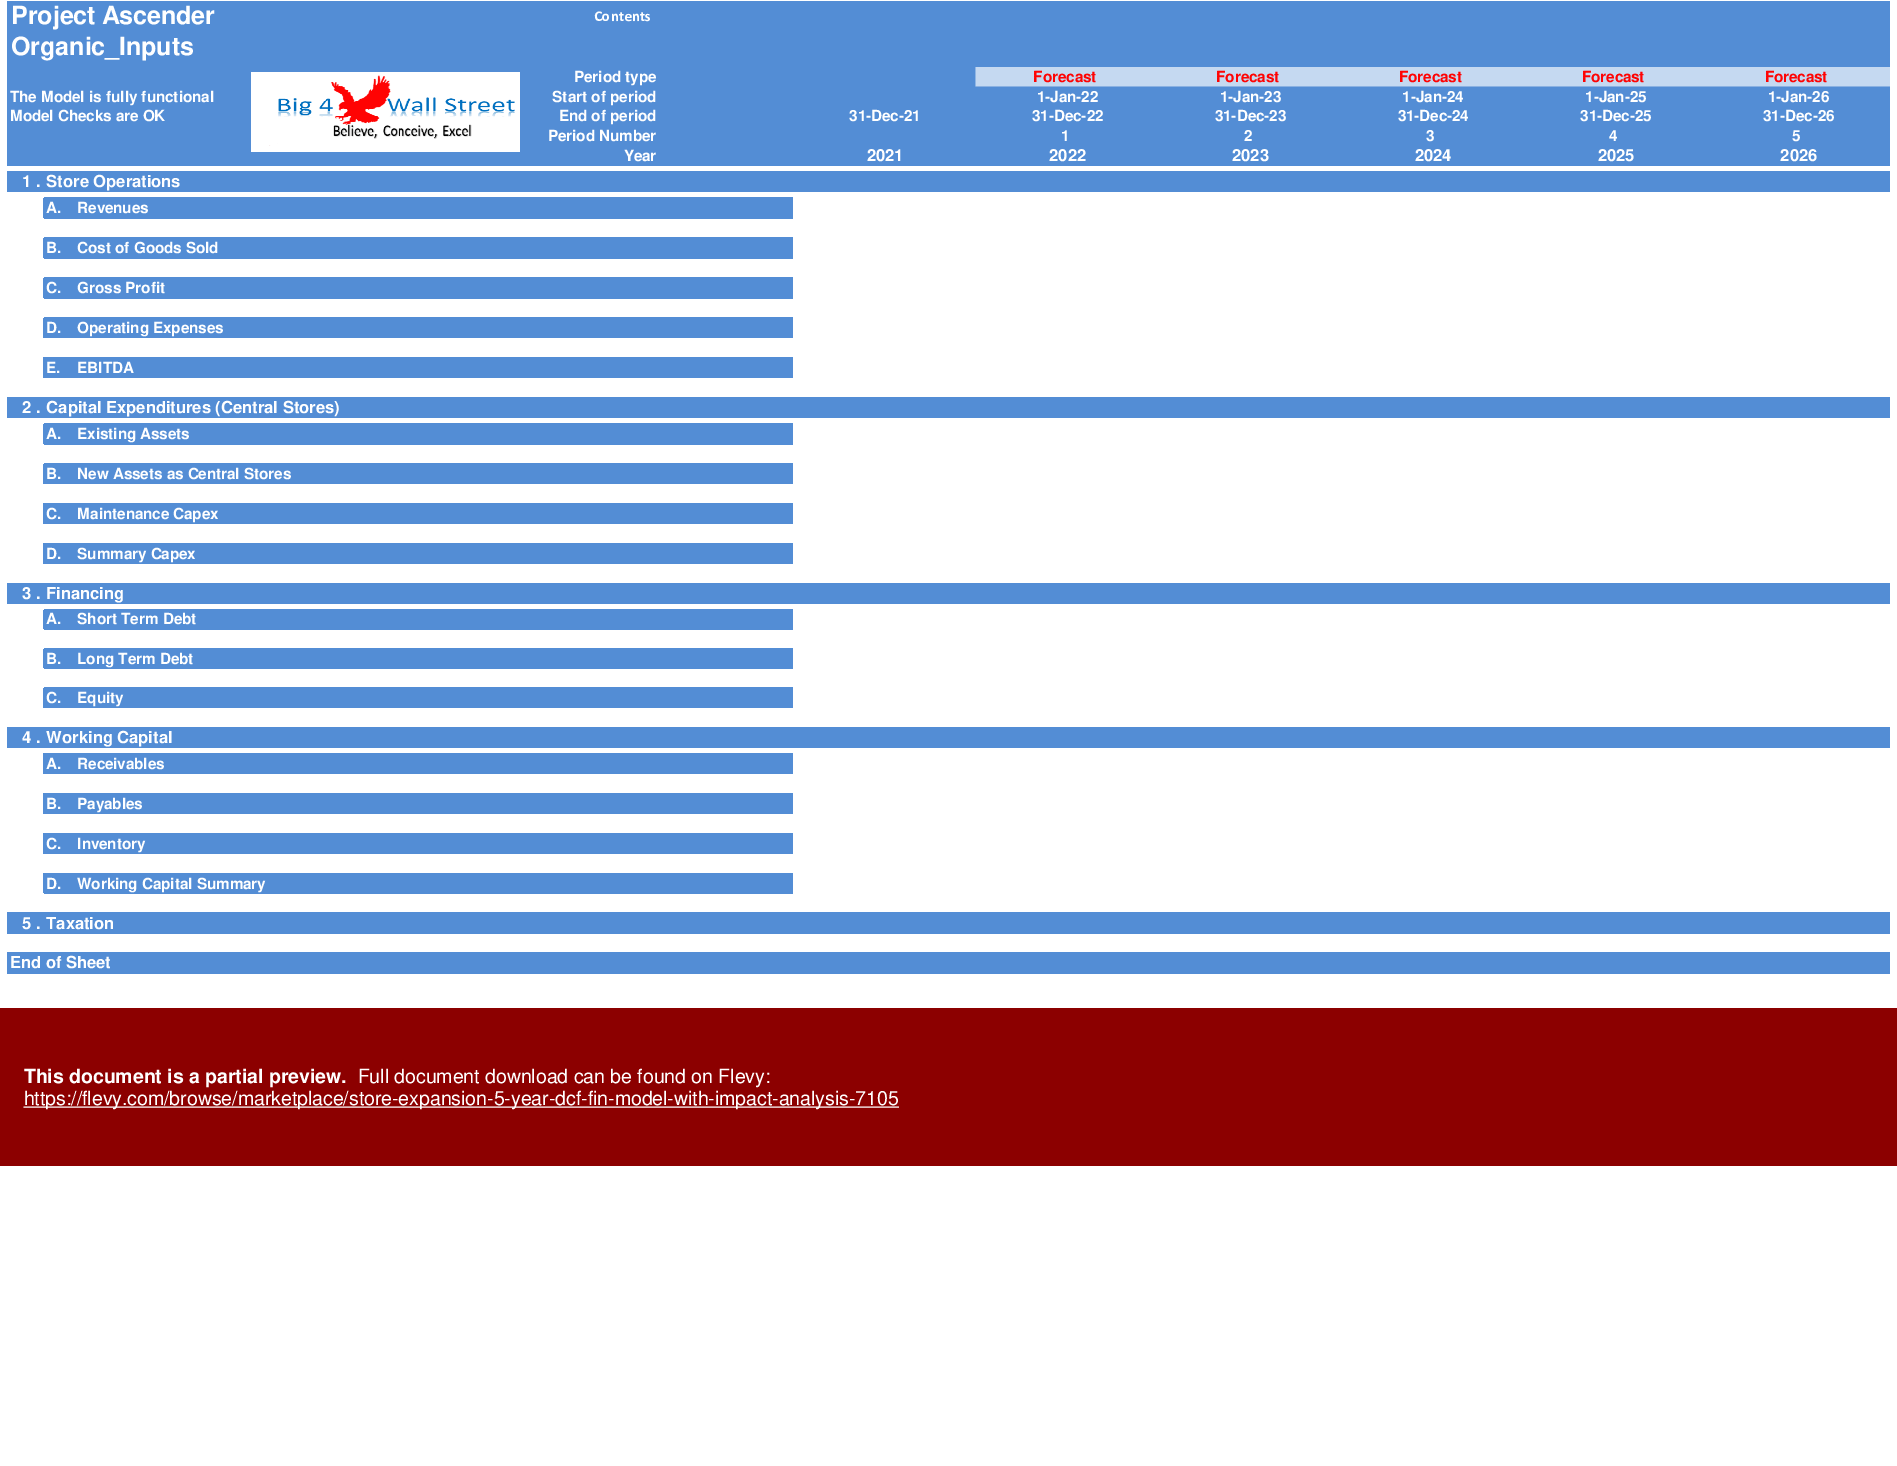
So, a quick overview of the model, in the contents tab you can see the structure of the model and by clicking on any of the headlines to be redirected to the relevant worksheet.
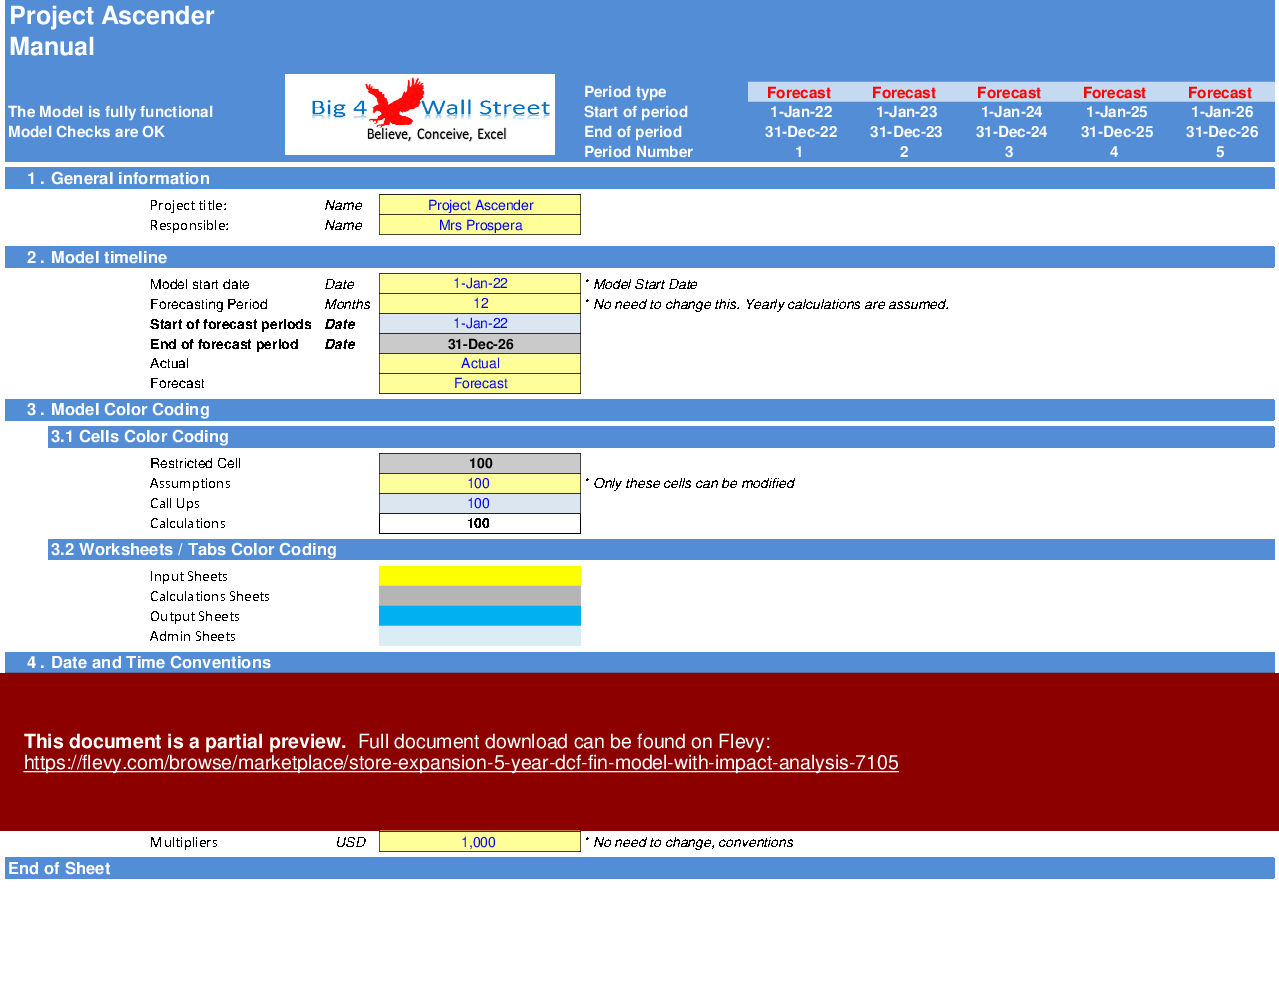
On the manual tab you can feed the general information for the model such as: project title, responsible, timeline of the model and date and currency conventions.
Additionally, there is a description of the color coding of the model in the same tab. Inputs are always depicted with a yellow fill and blue letters, call ups (that is direct links from other cells) are filled in light blue with blue letters while calculations are depicted with white fill and black characters.
There is also color coding for the various tabs of the model. Yellow tabs are mostly assumptions tabs, grey tabs are calculations tabs, blue tabs are outputs tabs (that is effectively results or graphs) and finally light blue tabs are admin tabs (for example: the cover page, contents, and checks).
There are 2 main assumptions tabs for each strategy. The assumptions for the organic growth of the business are located in the tab "Organic_Inputs", while the assumptions for the revenue-based financing of the business are located in the tab. "".
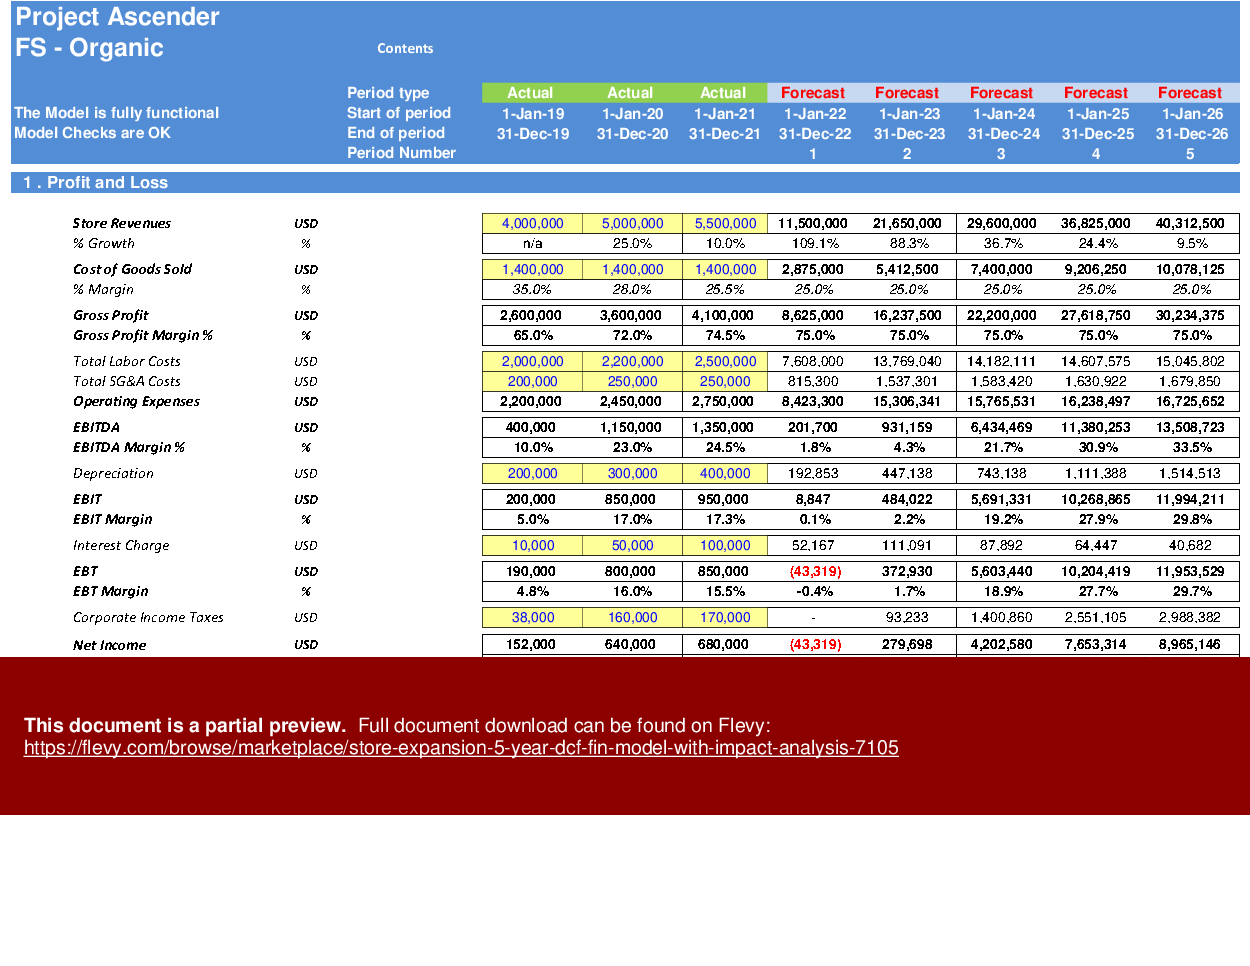
Let's start by populating the tab related to the organic growth of the business. The first section consists of the business operations and more precisely to the revenues sub section. There the user needs to fill the items sold per location, and the price per item sold, so that the revenues are calculated.
Then the user must set the cost of goods sold as a percentage margin on revenues.
Afterwards, we move to the Operating Expenses, which is split into 2 parts:
• Labor Costs: the user must set the labor costs (headcount & salary) for the main store (the already existing store before the expansion), after that for each new location the user must set the percentage labor cost versus the initial location. So, if the initial store labor cost is 100, and the user sets for location 1 to be 90%, the labor costs for location 1 would be 90. Also note that the CEO and CFO costs are split between venues equally.
• Sales, General, & Administrative Costs (SG&A): the user must set SG&A for the main store (the already existing store before the expansion), after that for each new location the user must set the percentage SG&A cost versus the initial location.
• So, if the initial store SG&A cost is 100, and the user sets for location 1 to be 90%, the SG&A costs for location 1 would be 90.
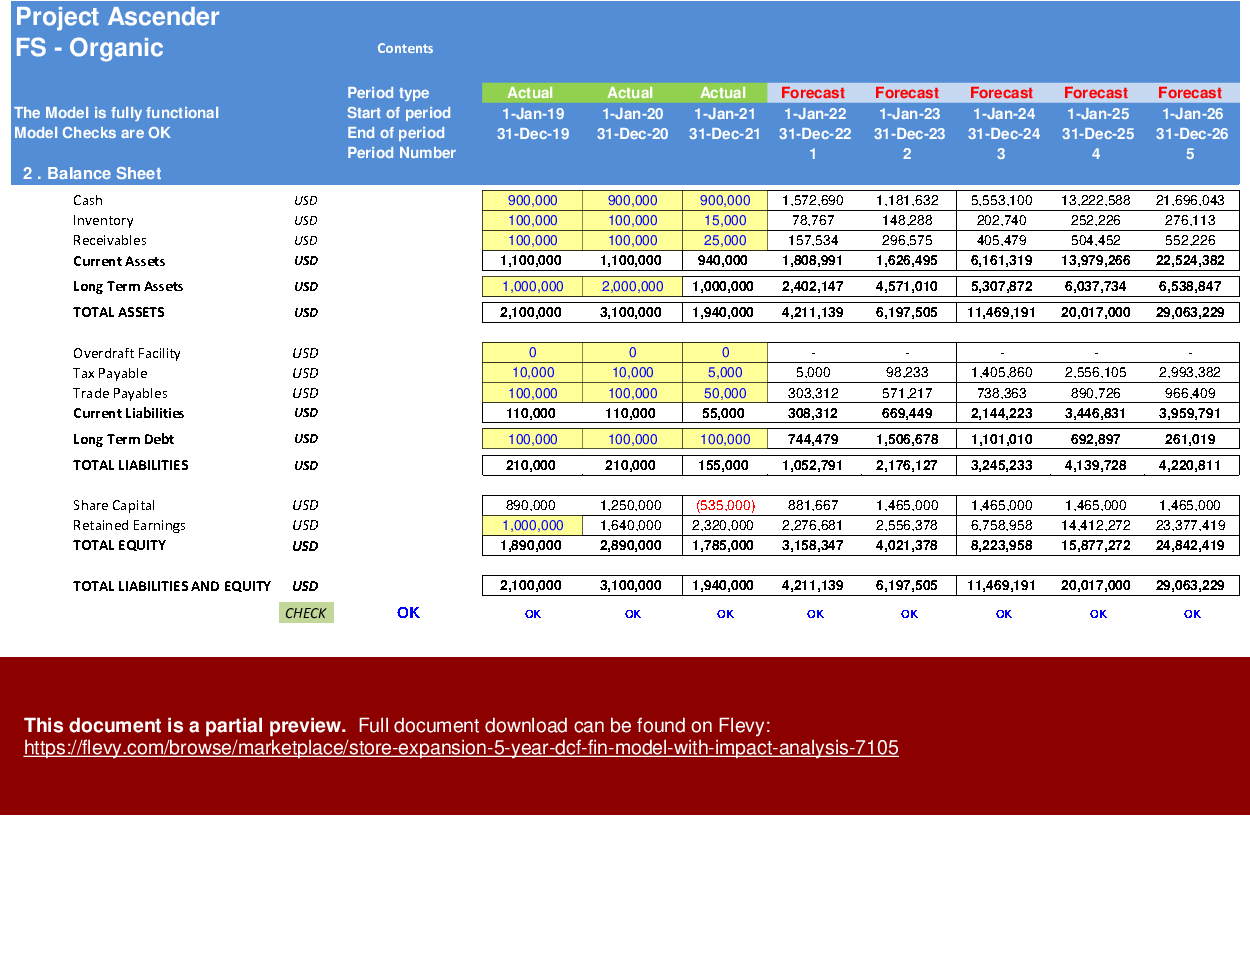
The next sections ("Existing Assets" & "New Assets") allows the user to set the total existing assets and new assets (acquisition costs less depreciation), and the depreciation years. Additionally, the user can set the maintenance capex as a percentage of sales.
Moving to the "Financing" section, the user needs to set the following debt / equity schedules:
• Existing Debt Financing: the user sets the opening balance, the annual interest rate, and the repayments per year:
• New Assets – Central Stores Financing: the initial investment is called up from the Assets sections, and the user needs to set the annual interest rate, the maturity in years, and the debt gearing:
• Overdraft Financing: the user just sets the annual interest rate, and the beginning cash balance.
• Share Capital and Retained Earnings: the only input needed here from the user is any additional equity injection, the equity from the new assets' investment is brought up automatically.
• Finally in the Discount Rate section the user needs to set the cost of equity and any premiums to calculate the Weighted Average Cost of Capital.
Moving to the working capital section, the user needs to set the receivables, inventory, and payables' days, as well as the opening balance of each item.
In the tax section, the user just needs to set the tax rate for corporate income. Additionally, the user can also set any tax payable from previous periods.
Now moving to "" tab, few assumptions need to be changed. The user first needs to set the faster expansion of the business by adjusting the year when the new stores are expected to be opened.
Another input that needs to be changed is the date when the existing assets are sold, and leaseback occurs. The user also sets the year of asset buyback from the business.
Finally, regarding the revenue-based financing, the user needs to set in the relevant section the percentage of revenues to be shared with the fund, and the maximum revenues that will be shared with the fund across all years (Revenue Based Repayment Capped).
All other assumptions have been directly retrieved as called up links from the organic growth assumptions' tab, so that the 2 cases can be compared with each other. Of course, since in this tab we are focusing on the revenue-based financing, the debt and equity financing have been deactivated.
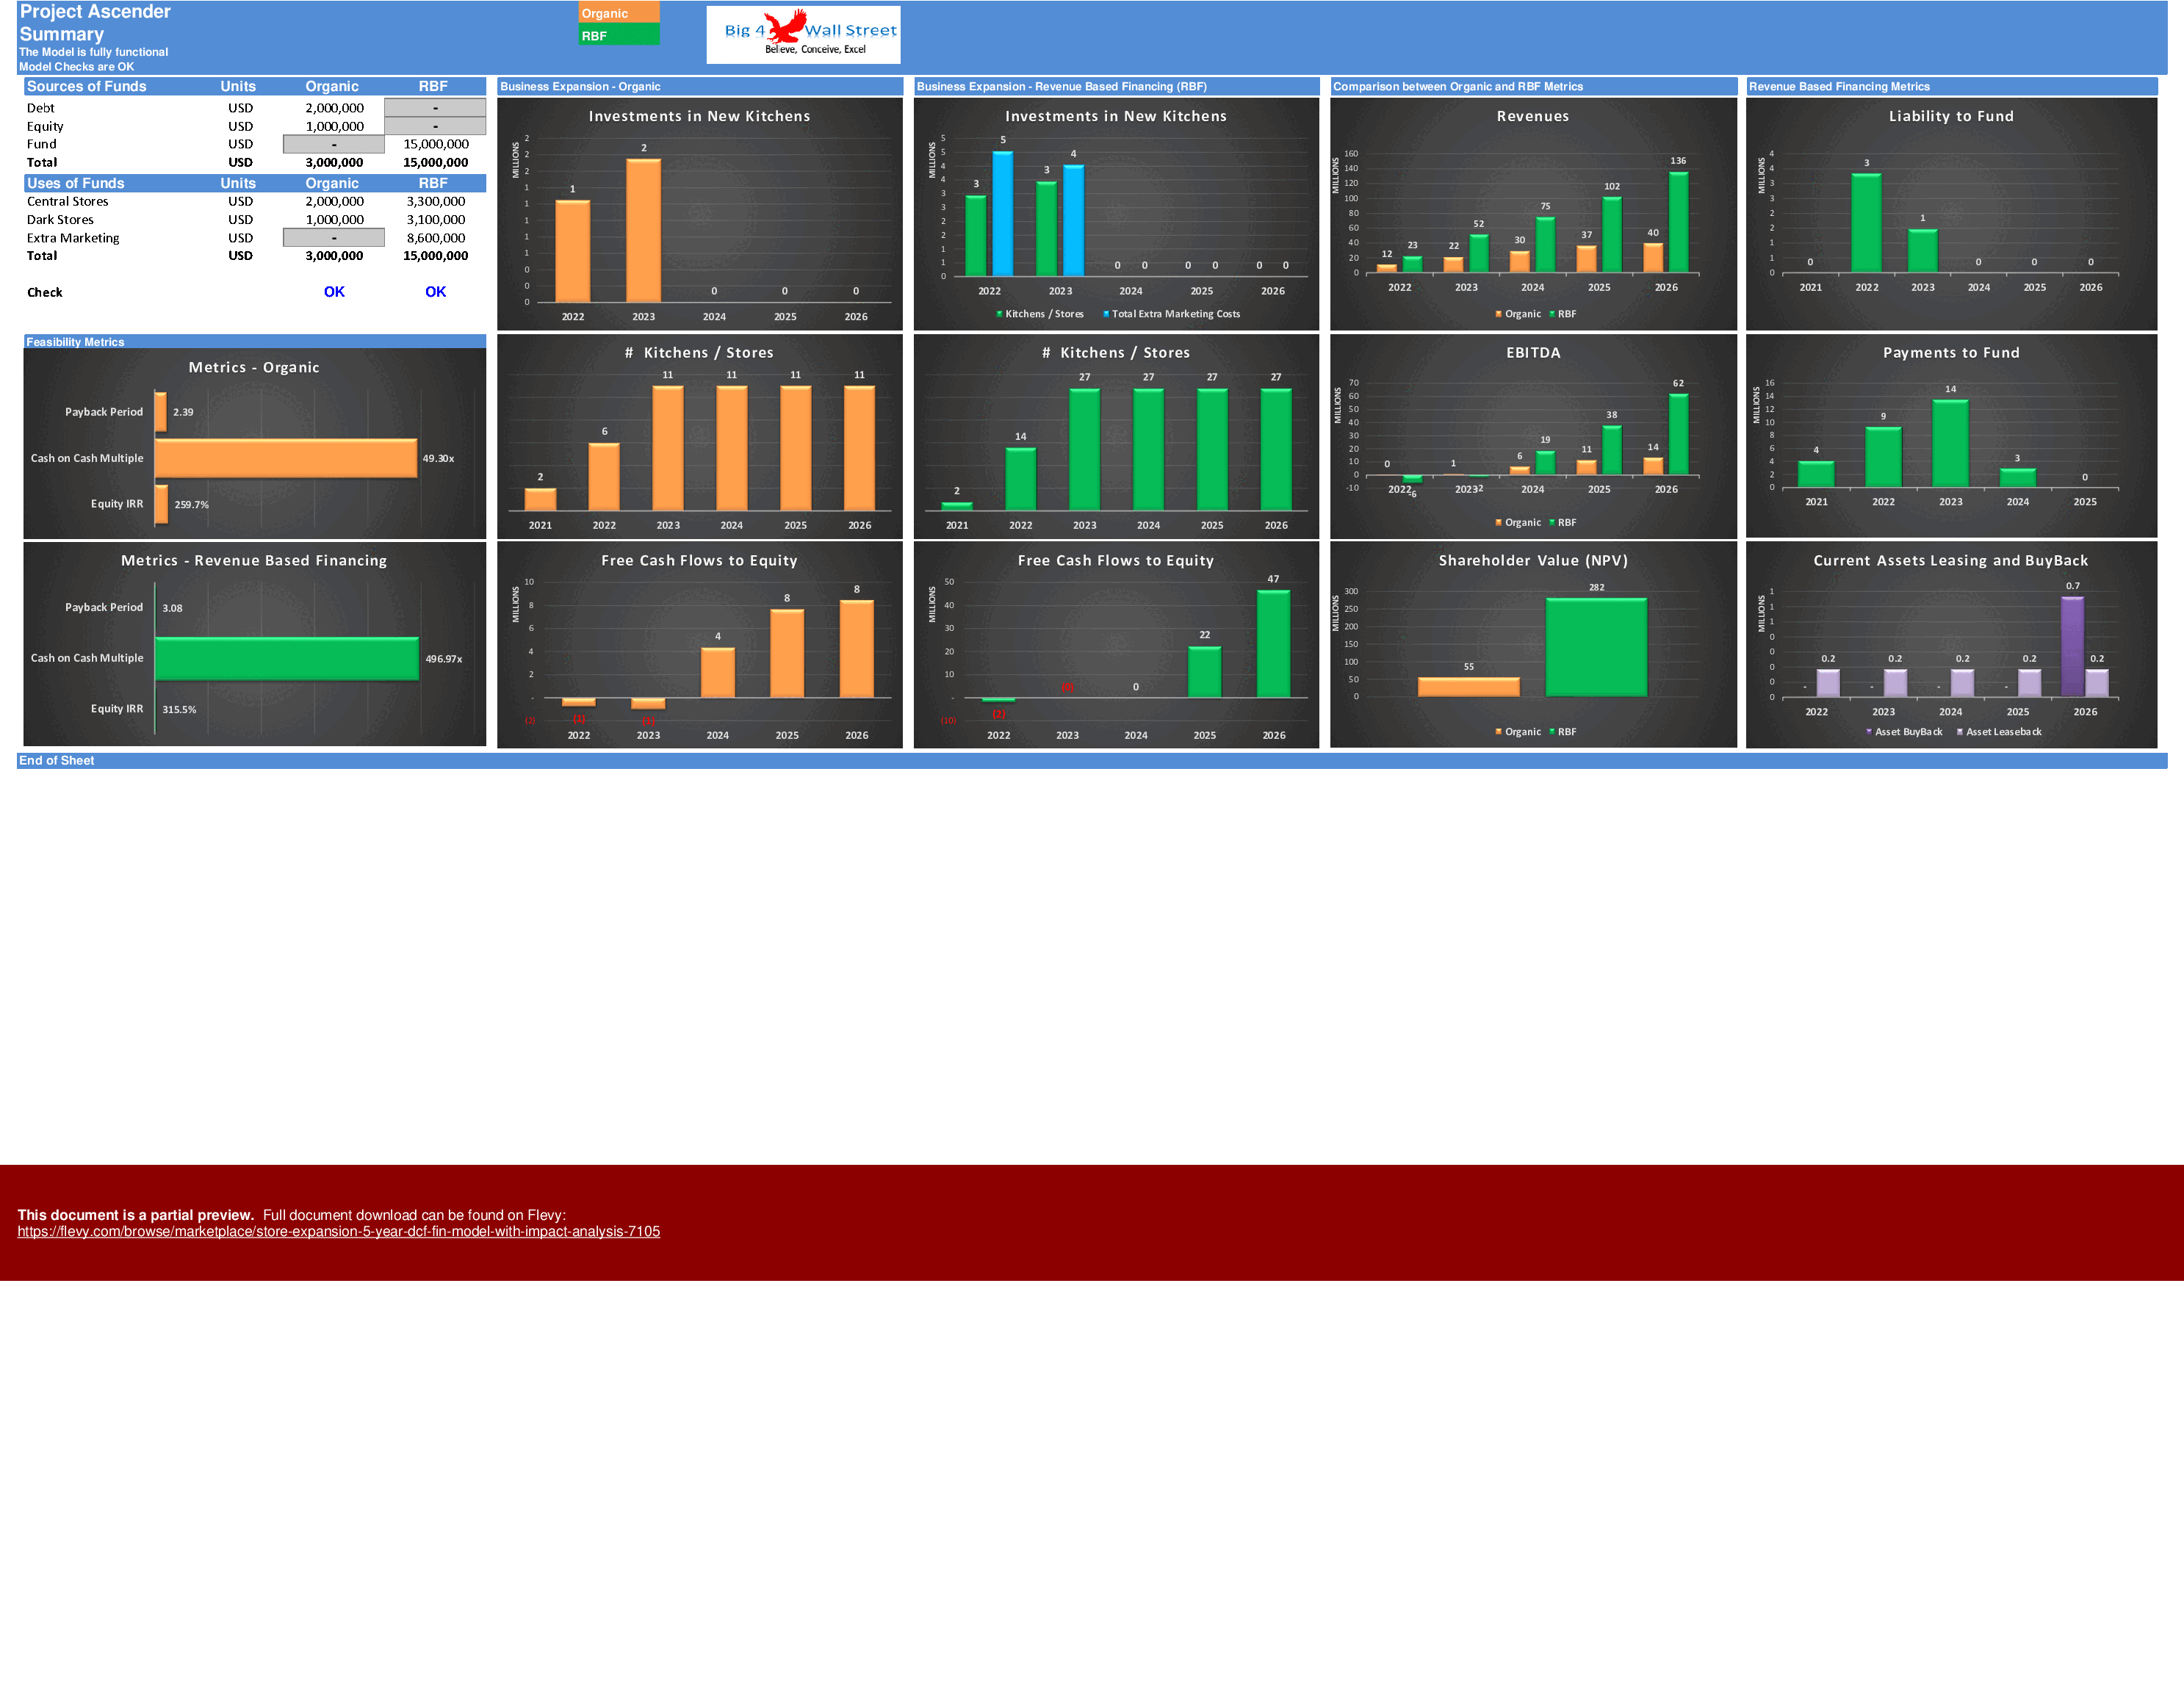
Now based on the assumptions we have detailed earlier, the financial statements are produced for the Organic Growth, the Revenue-Based Financing, and the Fund, as presented below.
In the Fund Financial Statements, the user must set some minor assumptions such as cost of equity, cost of sales as a percentage of sales, various operating expenses charges, and a corporate tax income rate.
Moving to the valuations tabs ("Val – Organic", "Val – ", "Fund FS & Metrics"), a valuation is performed along with investment metrics such as enterprise value, equity value, net present value, internal rate of return, cash on cash multiple, and payback period.
Moving on to the next tab, a set of graphs that compares the main metrics from the organic growth and the revenue-based growth.
Finally, in the last tab, various checks are performed and, or are aggregated here from the various worksheets. This tab ensures that everything in this model is working as it should.
All the above are summarized in the "Executive Summary" which displays the most important parts of the model.
Got a question about the product? Email us at support@flevy.com or ask the author directly by using the "Ask the Author a Question" form. If you cannot view the preview above this document description, go here to view the large preview instead.
Source: Best Practices in Retail Strategy, Integrated Financial Model Excel: Store Expansion: 5 Year DCF Fin. Model with Impact Analysis Excel (XLSX) Spreadsheet, Big4WallStreet
ABOUT THE AUTHOR
We help small and midsize businesses' leaders with their strategic problems by creating or improving financial models, implementing tools to drive efficiency, performance, and better decision making.
With over 15 years of experience in Financial & Business Modeling / Planning, Performance & Analysis (Ernst & Young, Toyota, Viohalco and Upstream), we have developed strong business
... [read more]
Ask the Author a Question
You must be logged in to contact the author.
