

Distribution Startup/Existing Business Financial Projection 3 Statement Model – Excel XLSX
Excel (XLSX) + Excel (XLSX)
VIDEO DEMO
BENEFITS OF THIS DOWNLOADABLE EXCEL DOCUMENT
- Prepartion of a 5 year 3 statement (Income Statement, Balance Sheet, Cash Flow Statement) Financial Projection Model for a new or existing distribution business.
RETAIL STRATEGY EXCEL DESCRIPTION
A Business Financial Projection model is crucial as it offers a forward-looking view of a company's financial health. It enables informed decision-making, helping businesses plan for growth, allocate resources wisely, and secure funding. By forecasting revenues, expenses, and cash flows, it identifies potential financial challenges and opportunities. Investors and stakeholders gain confidence in the business's prospects, fostering trust and attracting capital. Overall, a well-constructed financial projection model is a strategic tool for achieving financial stability, efficient resource management, and sustainable success in a dynamic business environment.
PURPOSE OF TOOL
Highly versatile and user-friendly Excel model for the preparation a of 5-year rolling 3 statement (Income Statement, Balance Sheet and Cash flow Statement) financial projection with a monthly timeline for a startup or existing distribution business generating revenue through the sale of products to the target market and other ancillary income
The model allows the user to model the distribution of up to 10 product categories (can be extended) and 5 ancillary income streams. The model includes 5 cost of sale categories for each product categories (e.g. product cost, shipping cost, handling costs, duties etc.) with functionality to model inventories for each product category.
The model follows good practice financial modelling principles and includes instructions, line item explanations, checks and input validations and incorporates a discounted cash flow valuation calculation using the projected cash flows.
KEY OUTPUTS
The key outputs include:
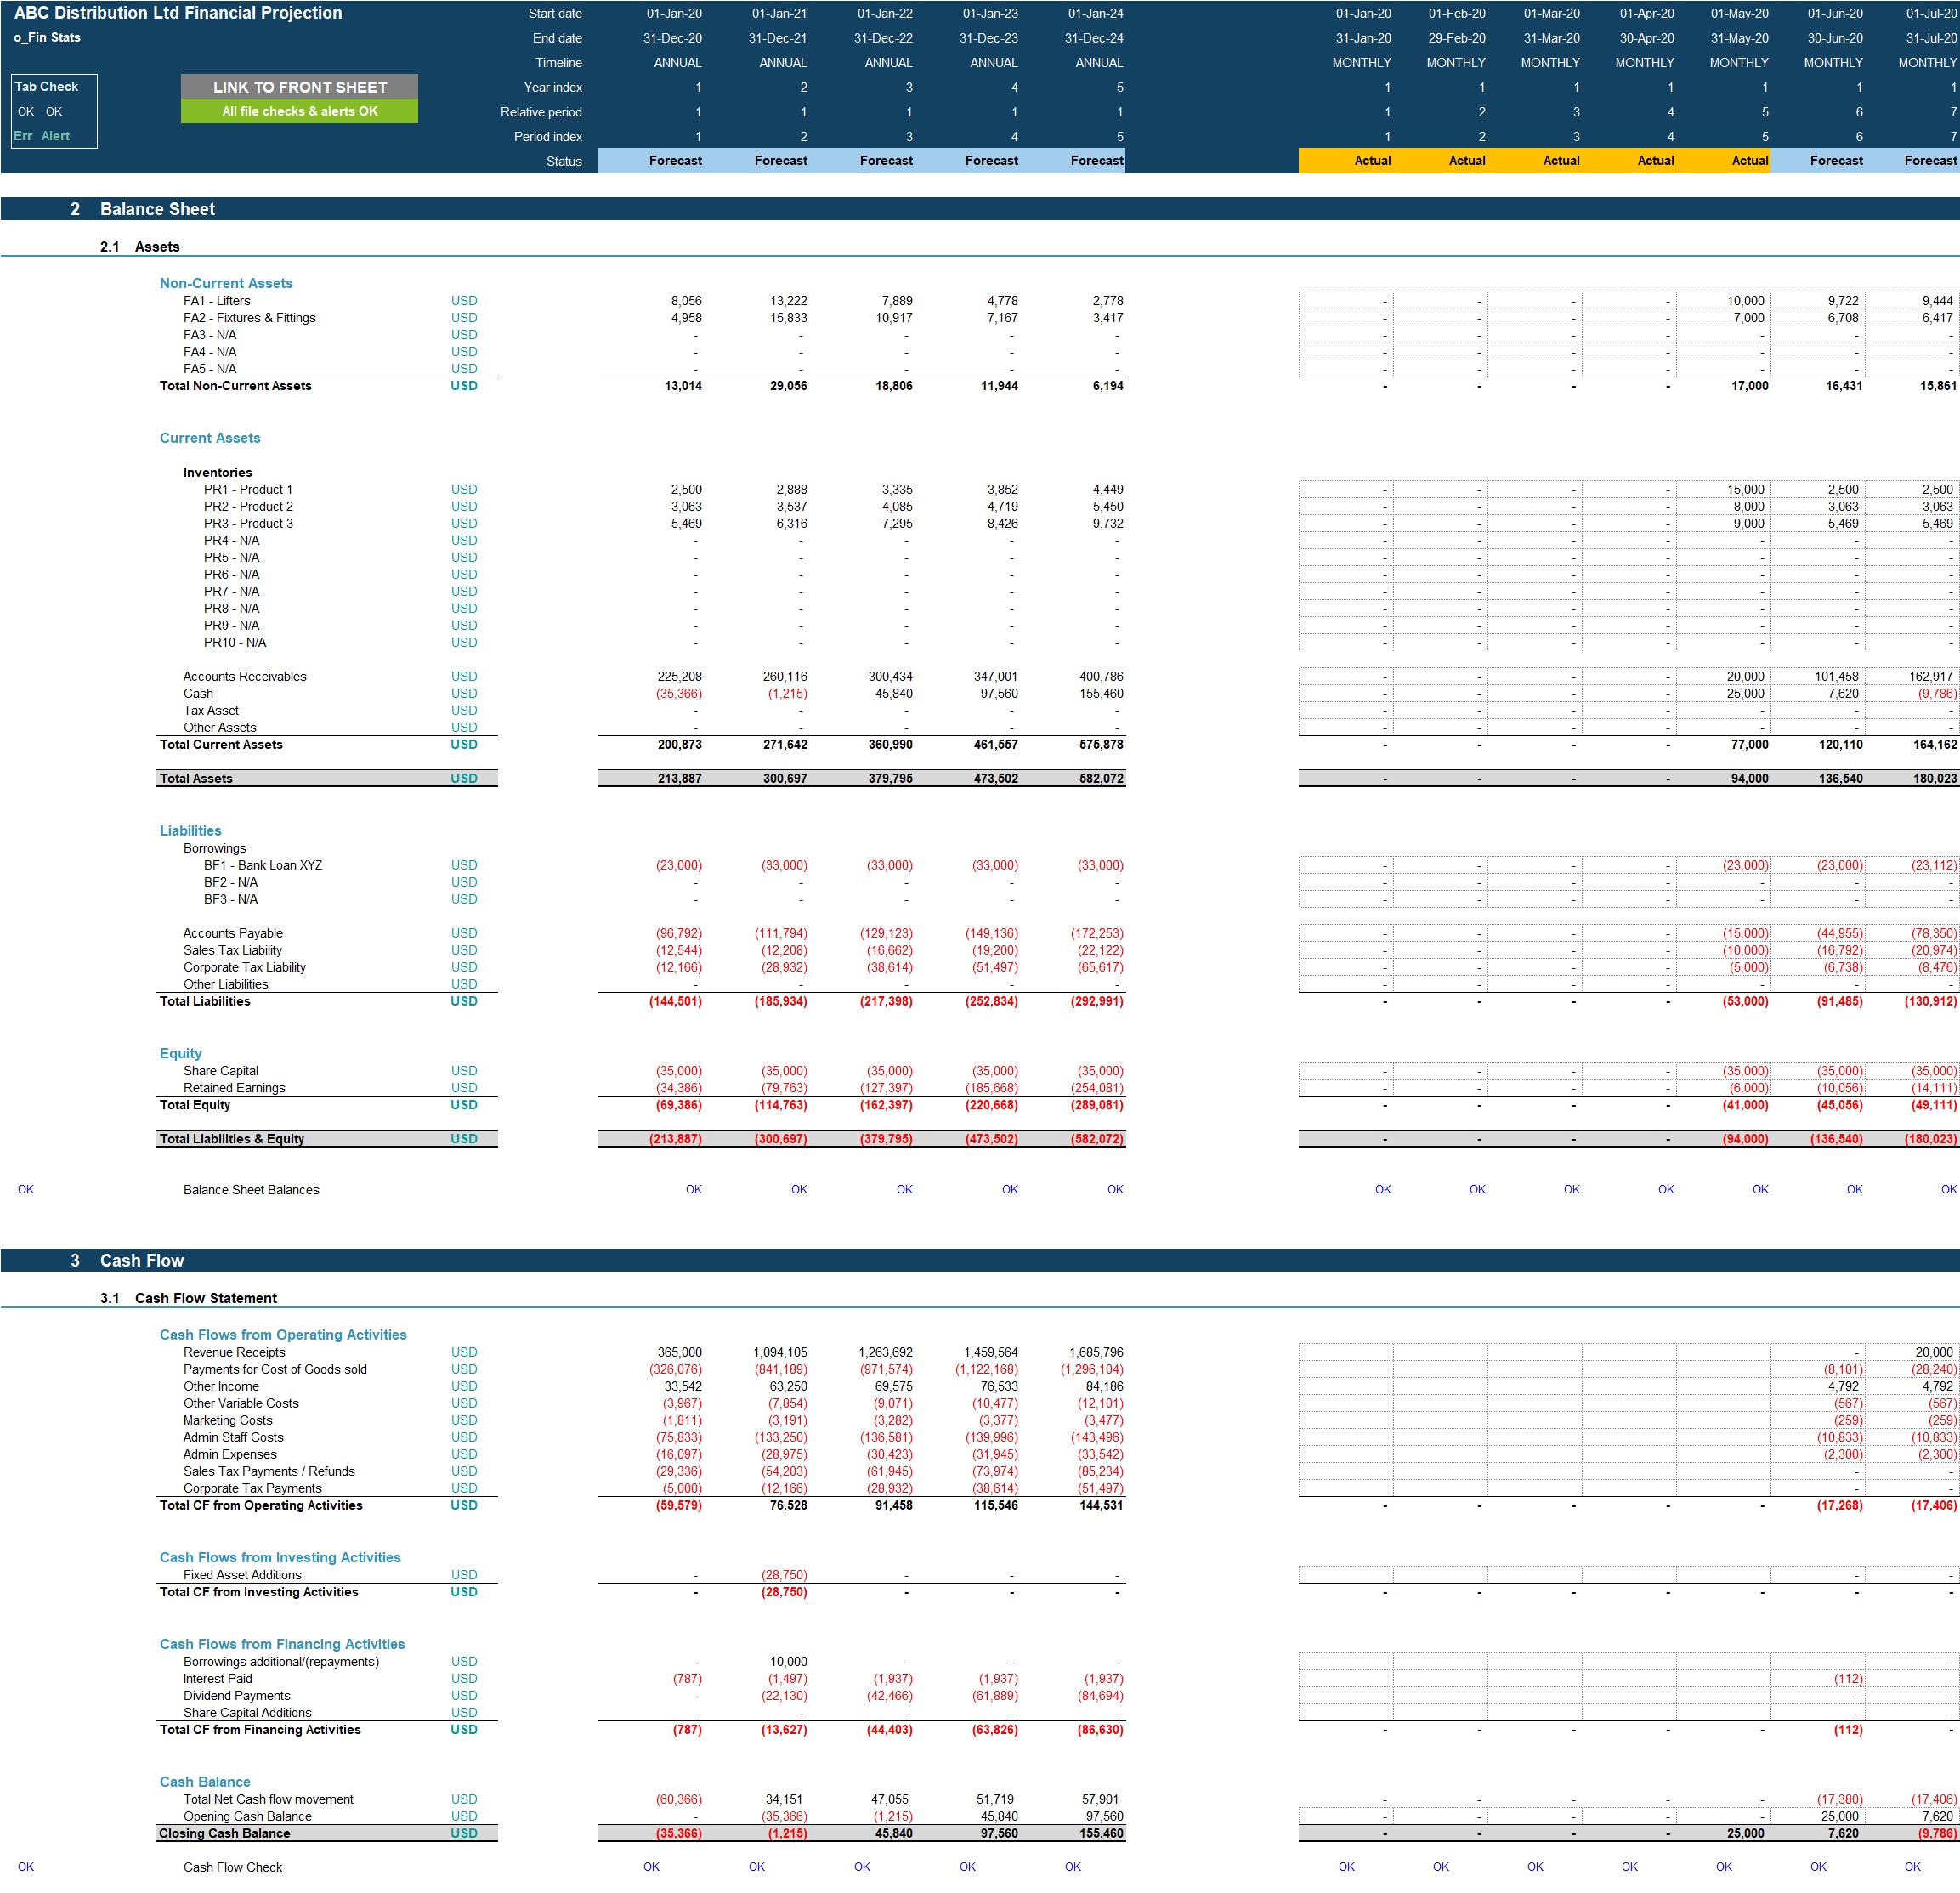
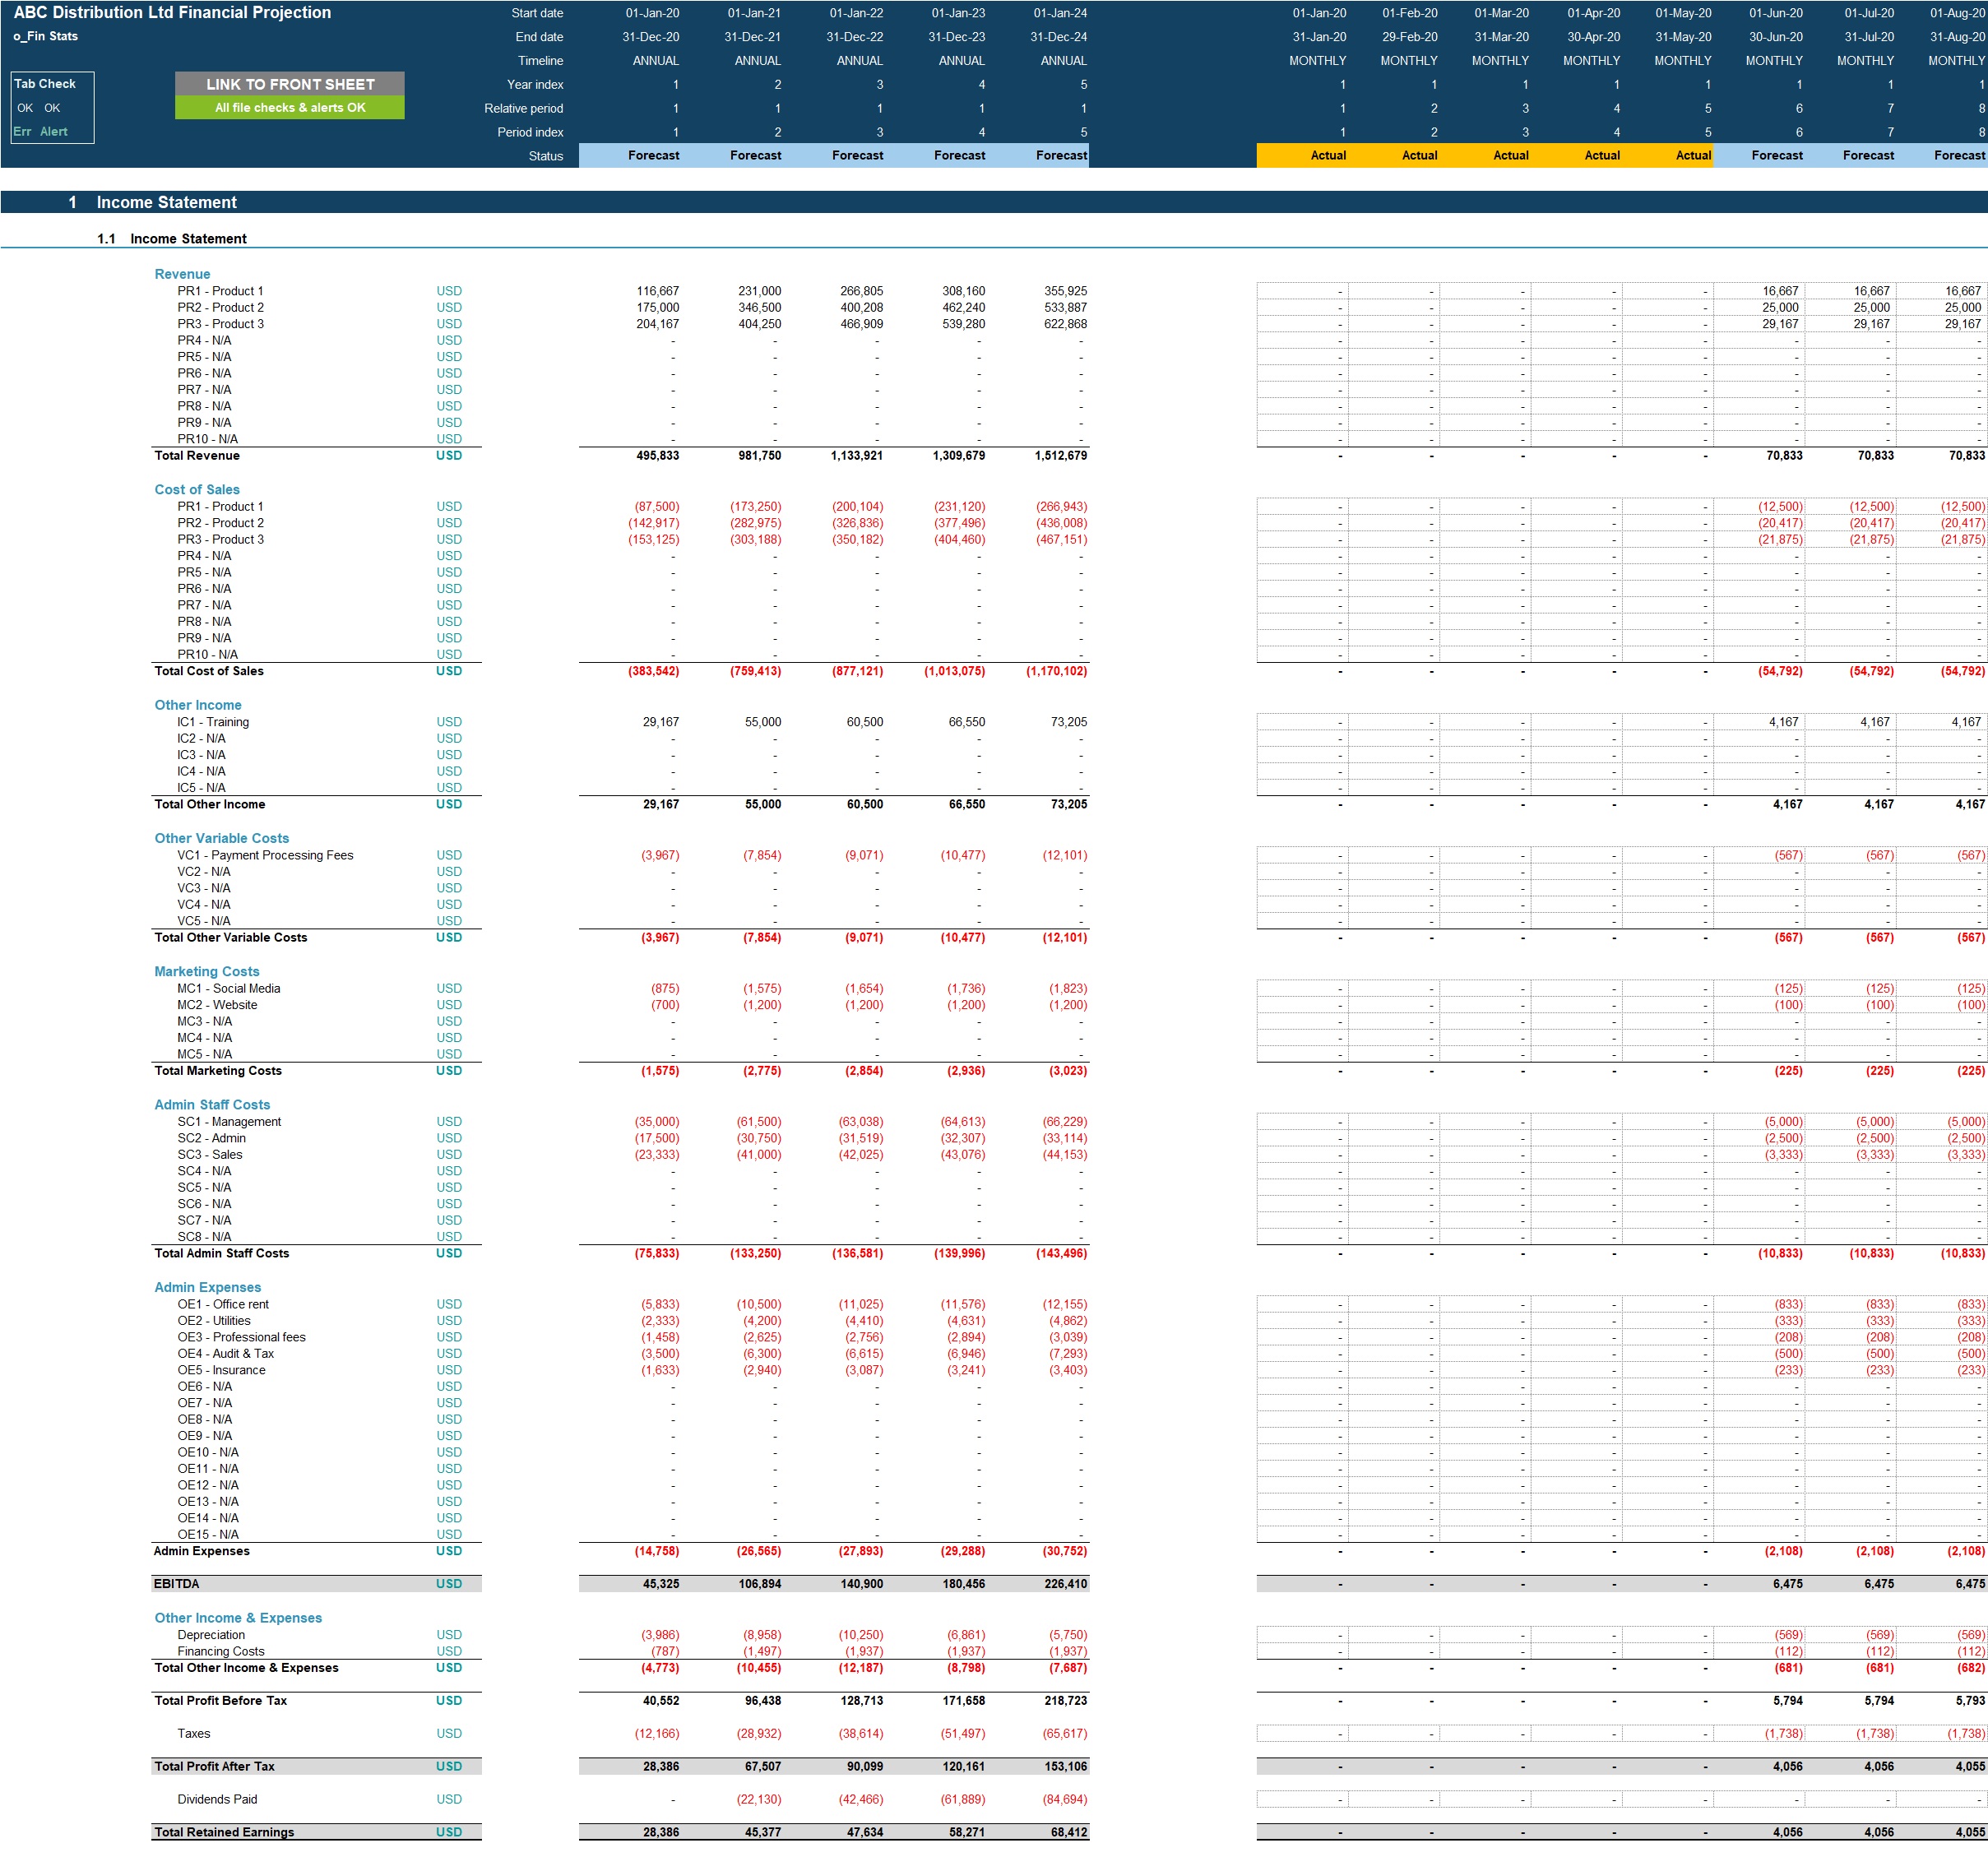
• Projected full financial statements (Income Statement, Balance Sheet and Cash flow Statement) presented on a monthly basis across up to 5 years and summarised on an annual basis.
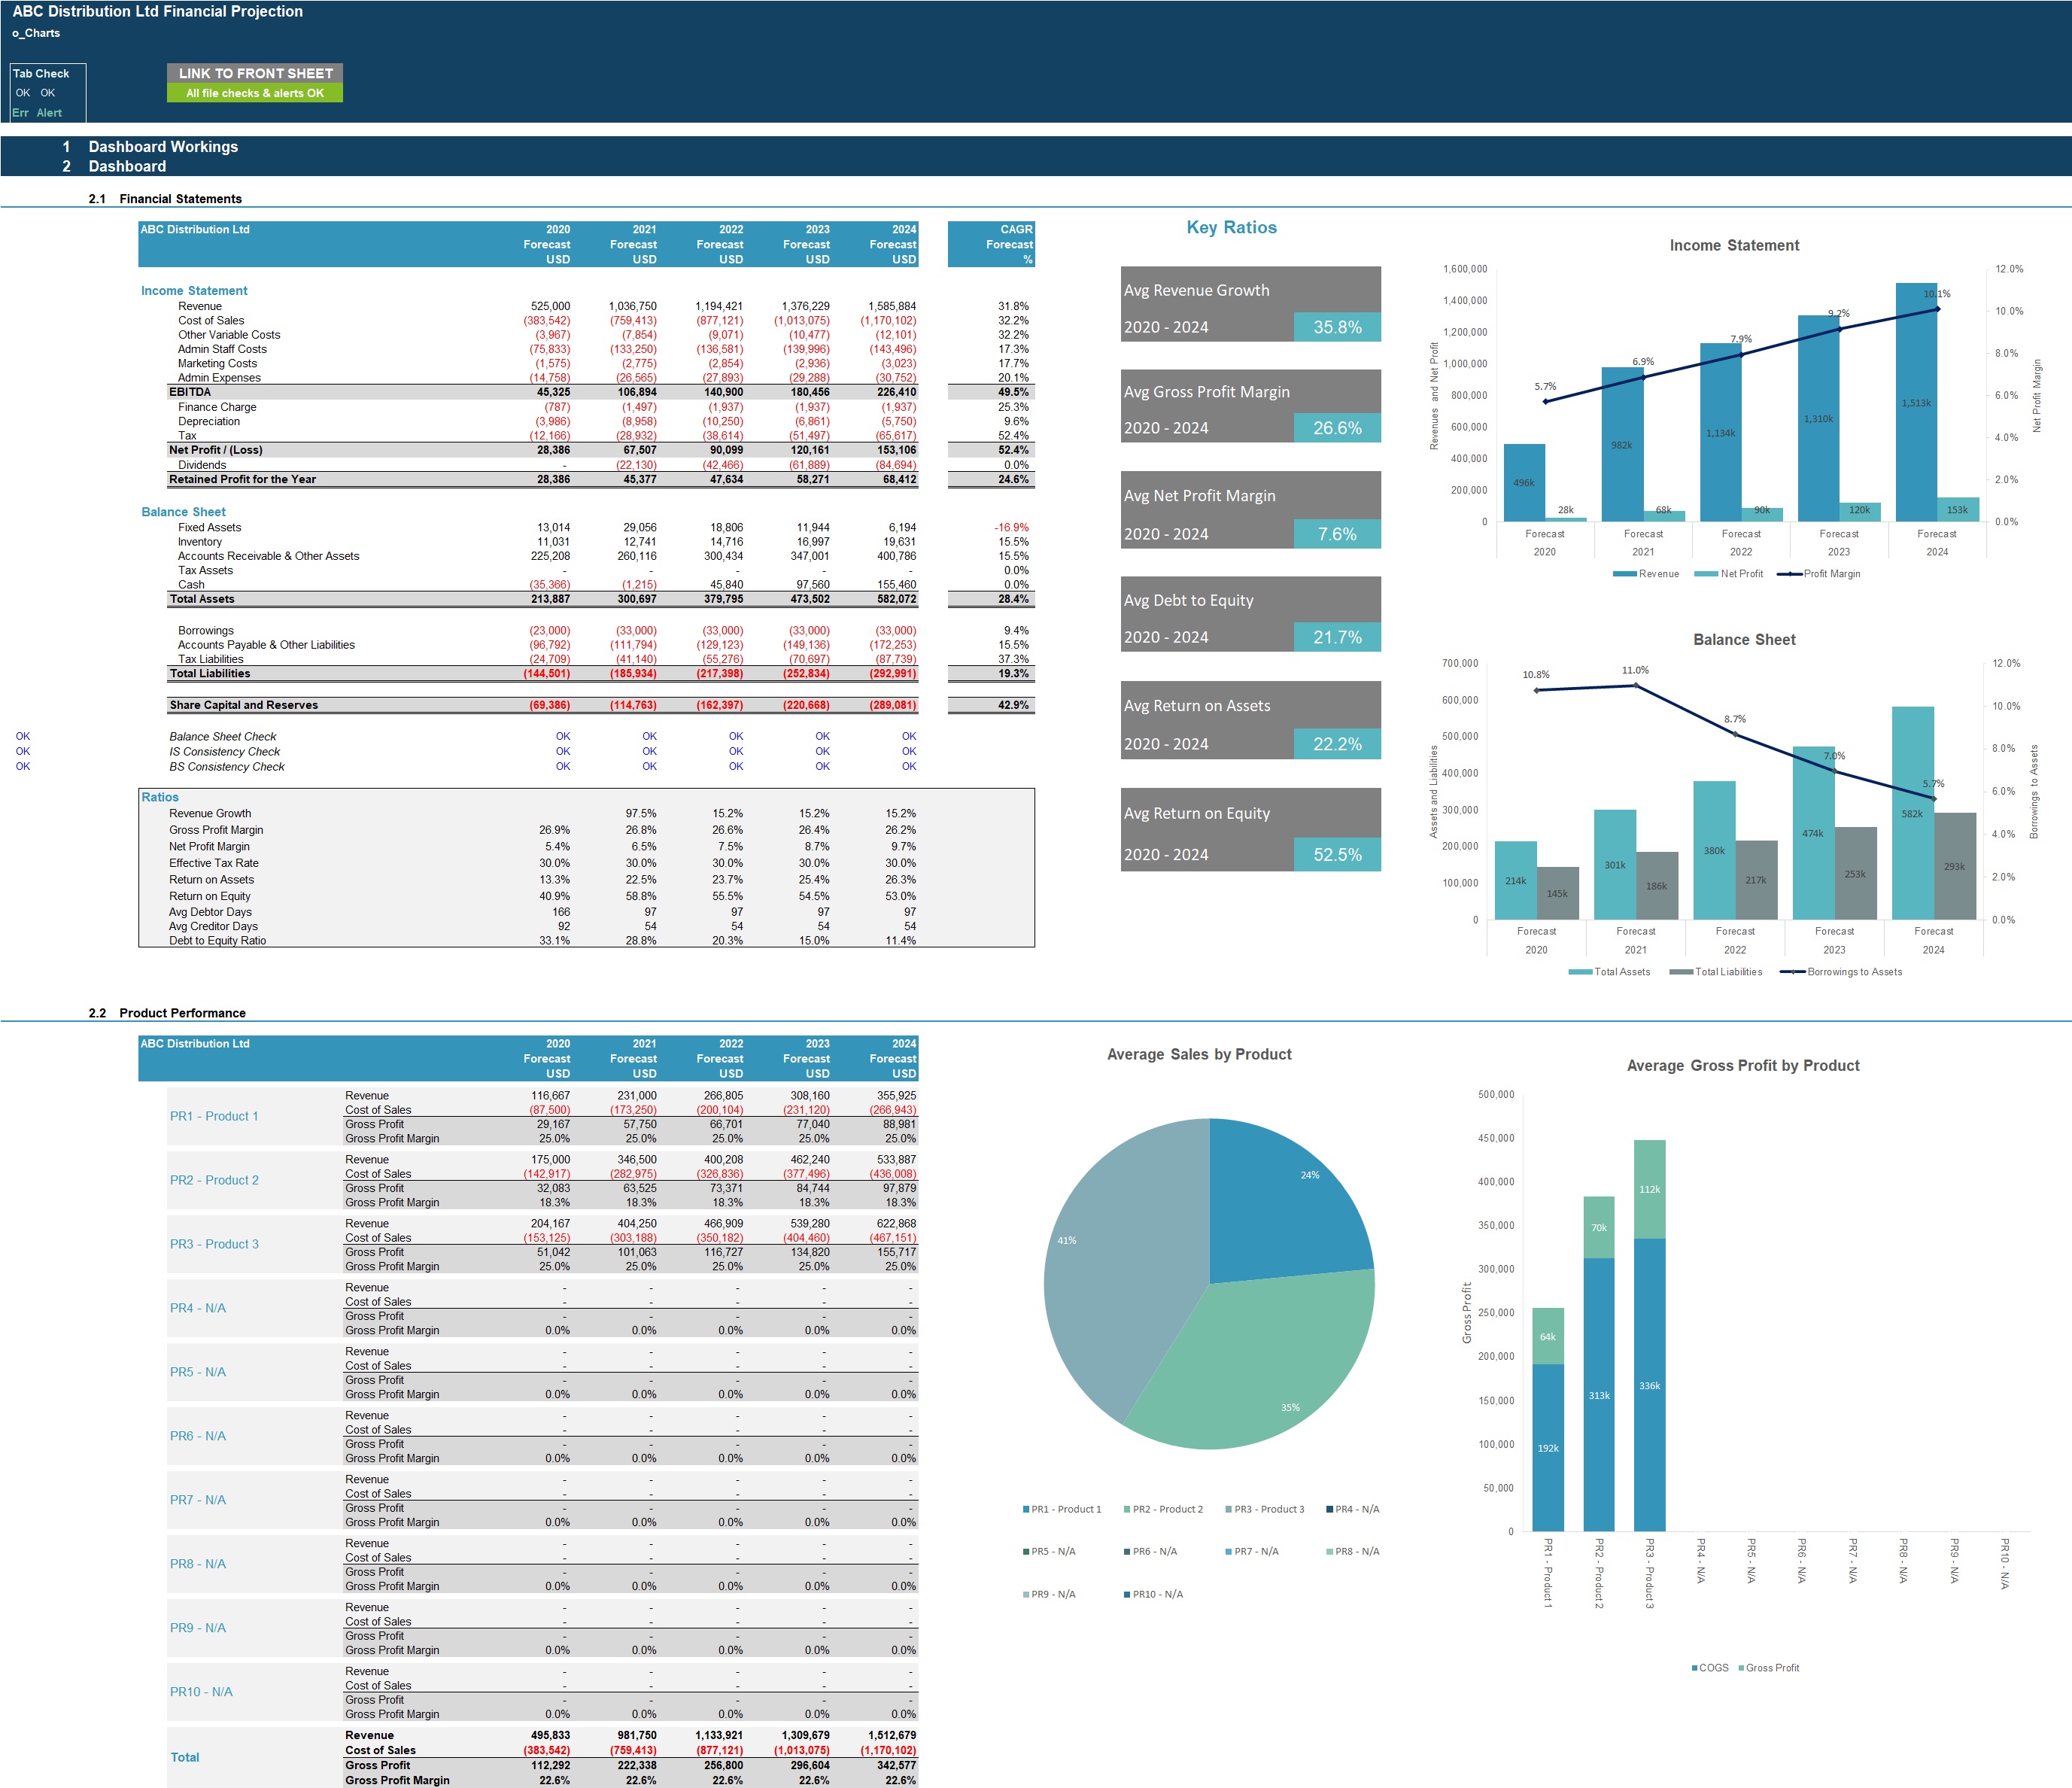
• Dashboard with:
Summarised projected Income Statement and Balance Sheet
Compounded Annual Growth Rate (CAGR) for each summarised income statement and balance sheet line item
List of key ratios including average revenue growth, average profit margins, average return on assets and equity and average Debt to Equity ratio.
Bar charts summarising income statement and balance sheet projections
Gross Profit margin by product in table and bar-chart format
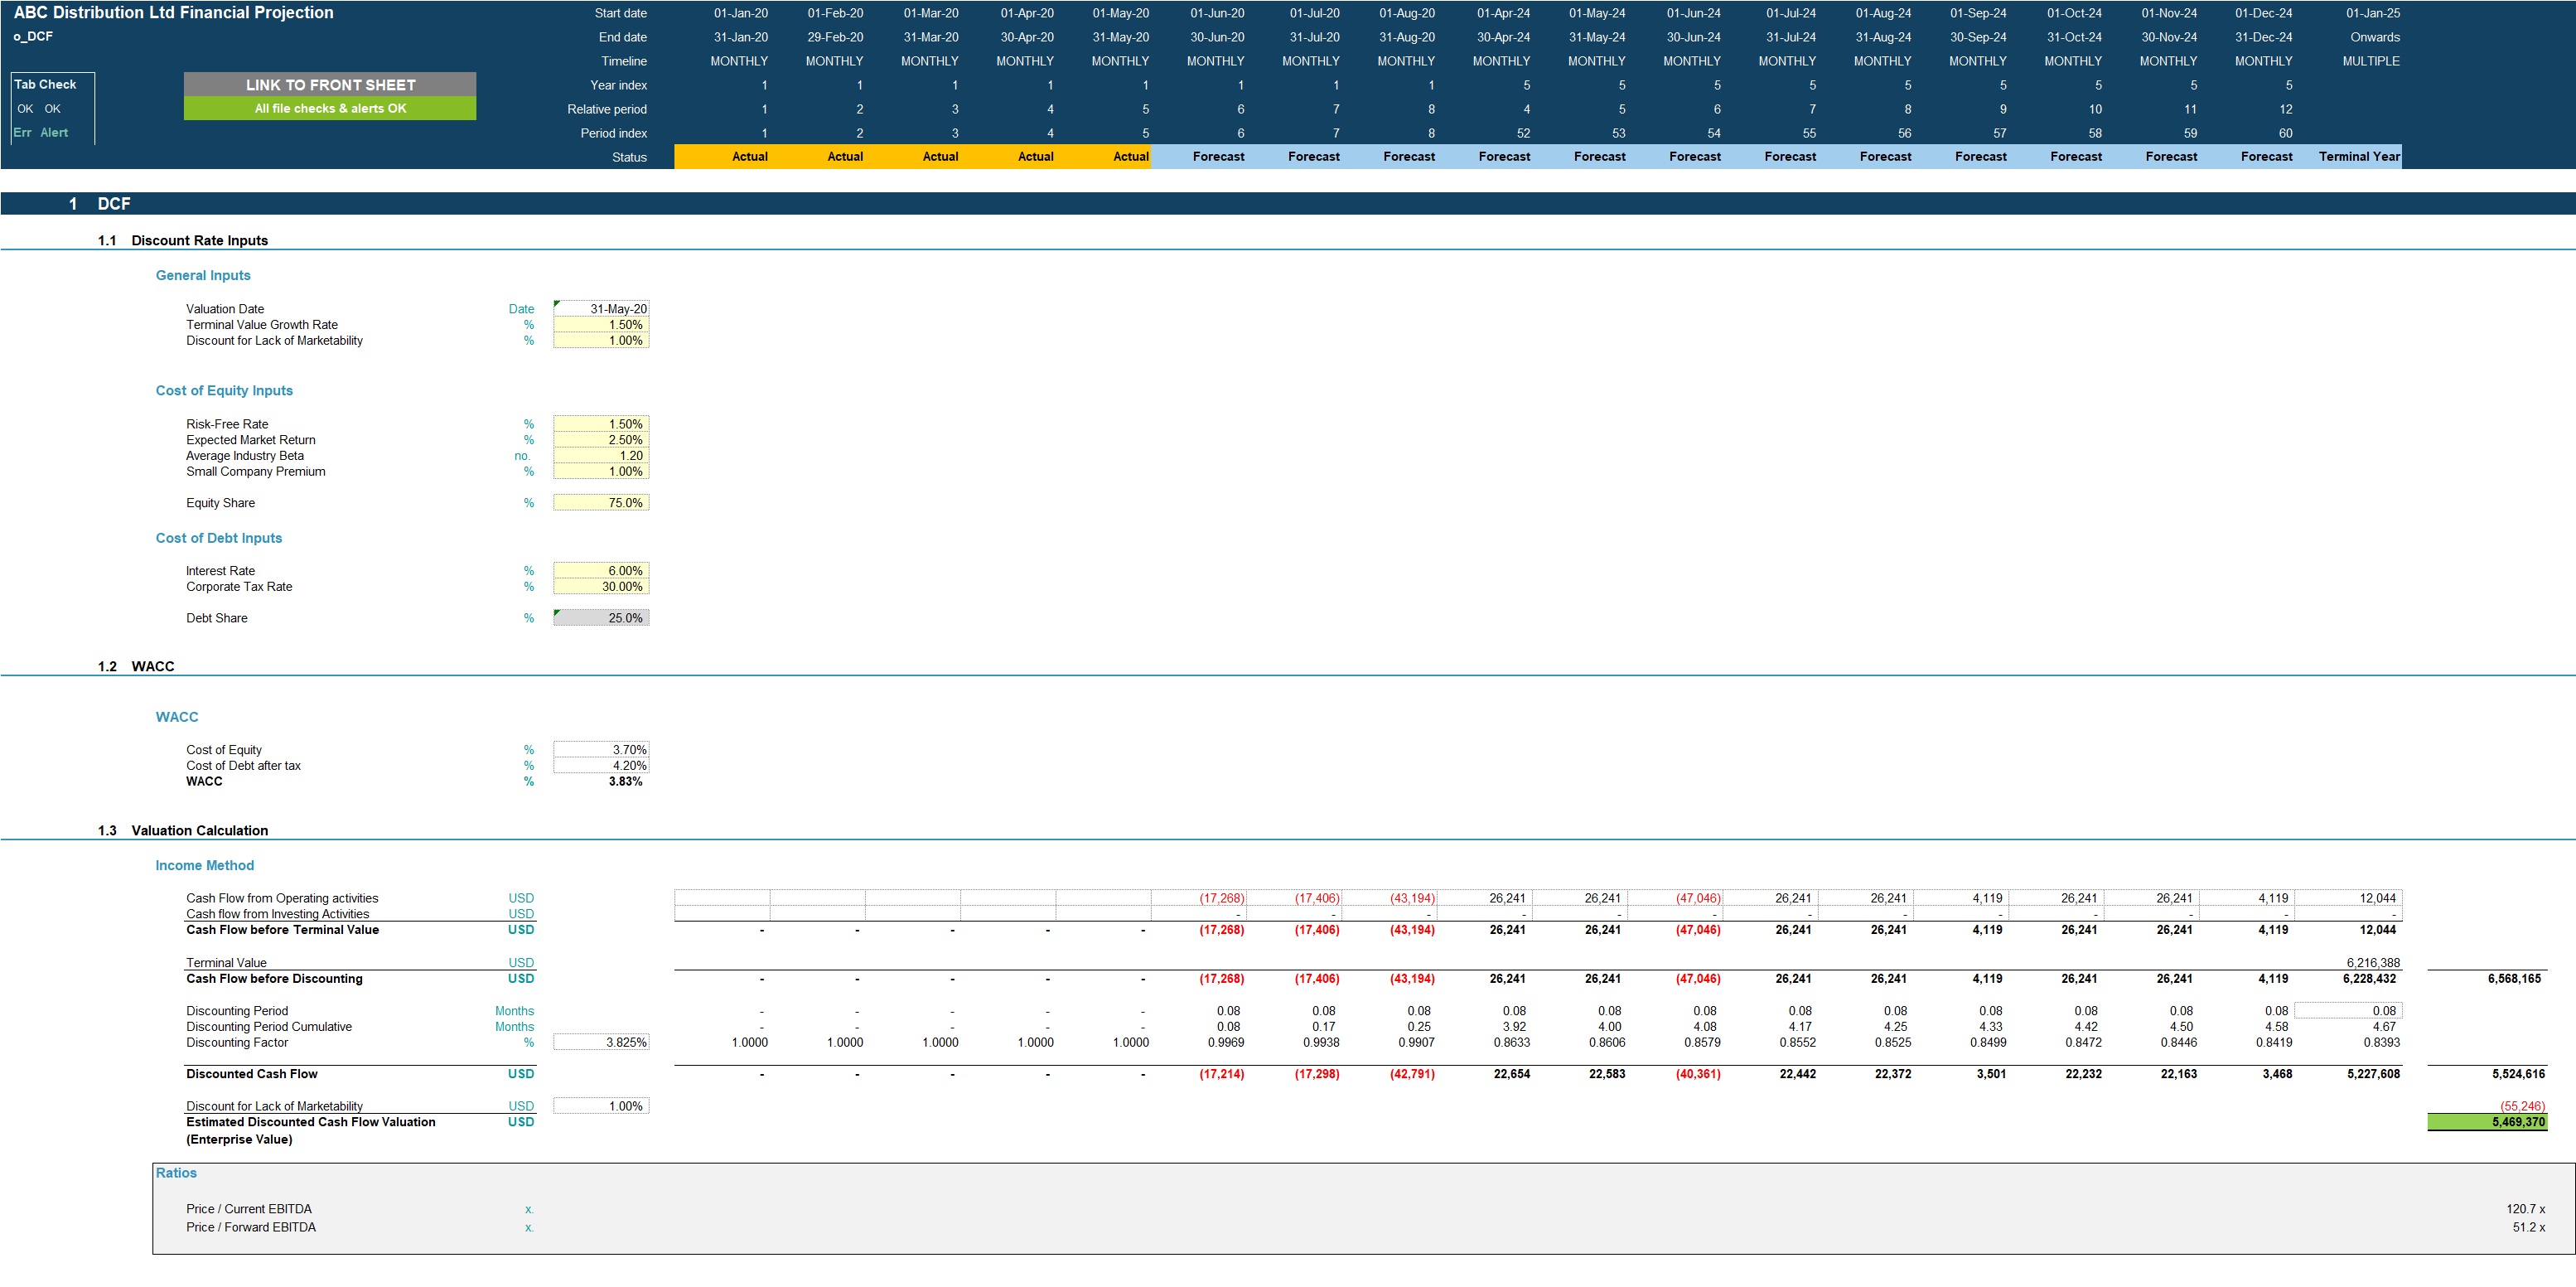
• Discounted cash flow valuation using the projected cash flow output.
KEY INPUTS
Inputs are split into income statement and balance sheet Inputs. Most inputs include user-friendly line item explanations and input validations to help users understand what the input is for and populate correctly.
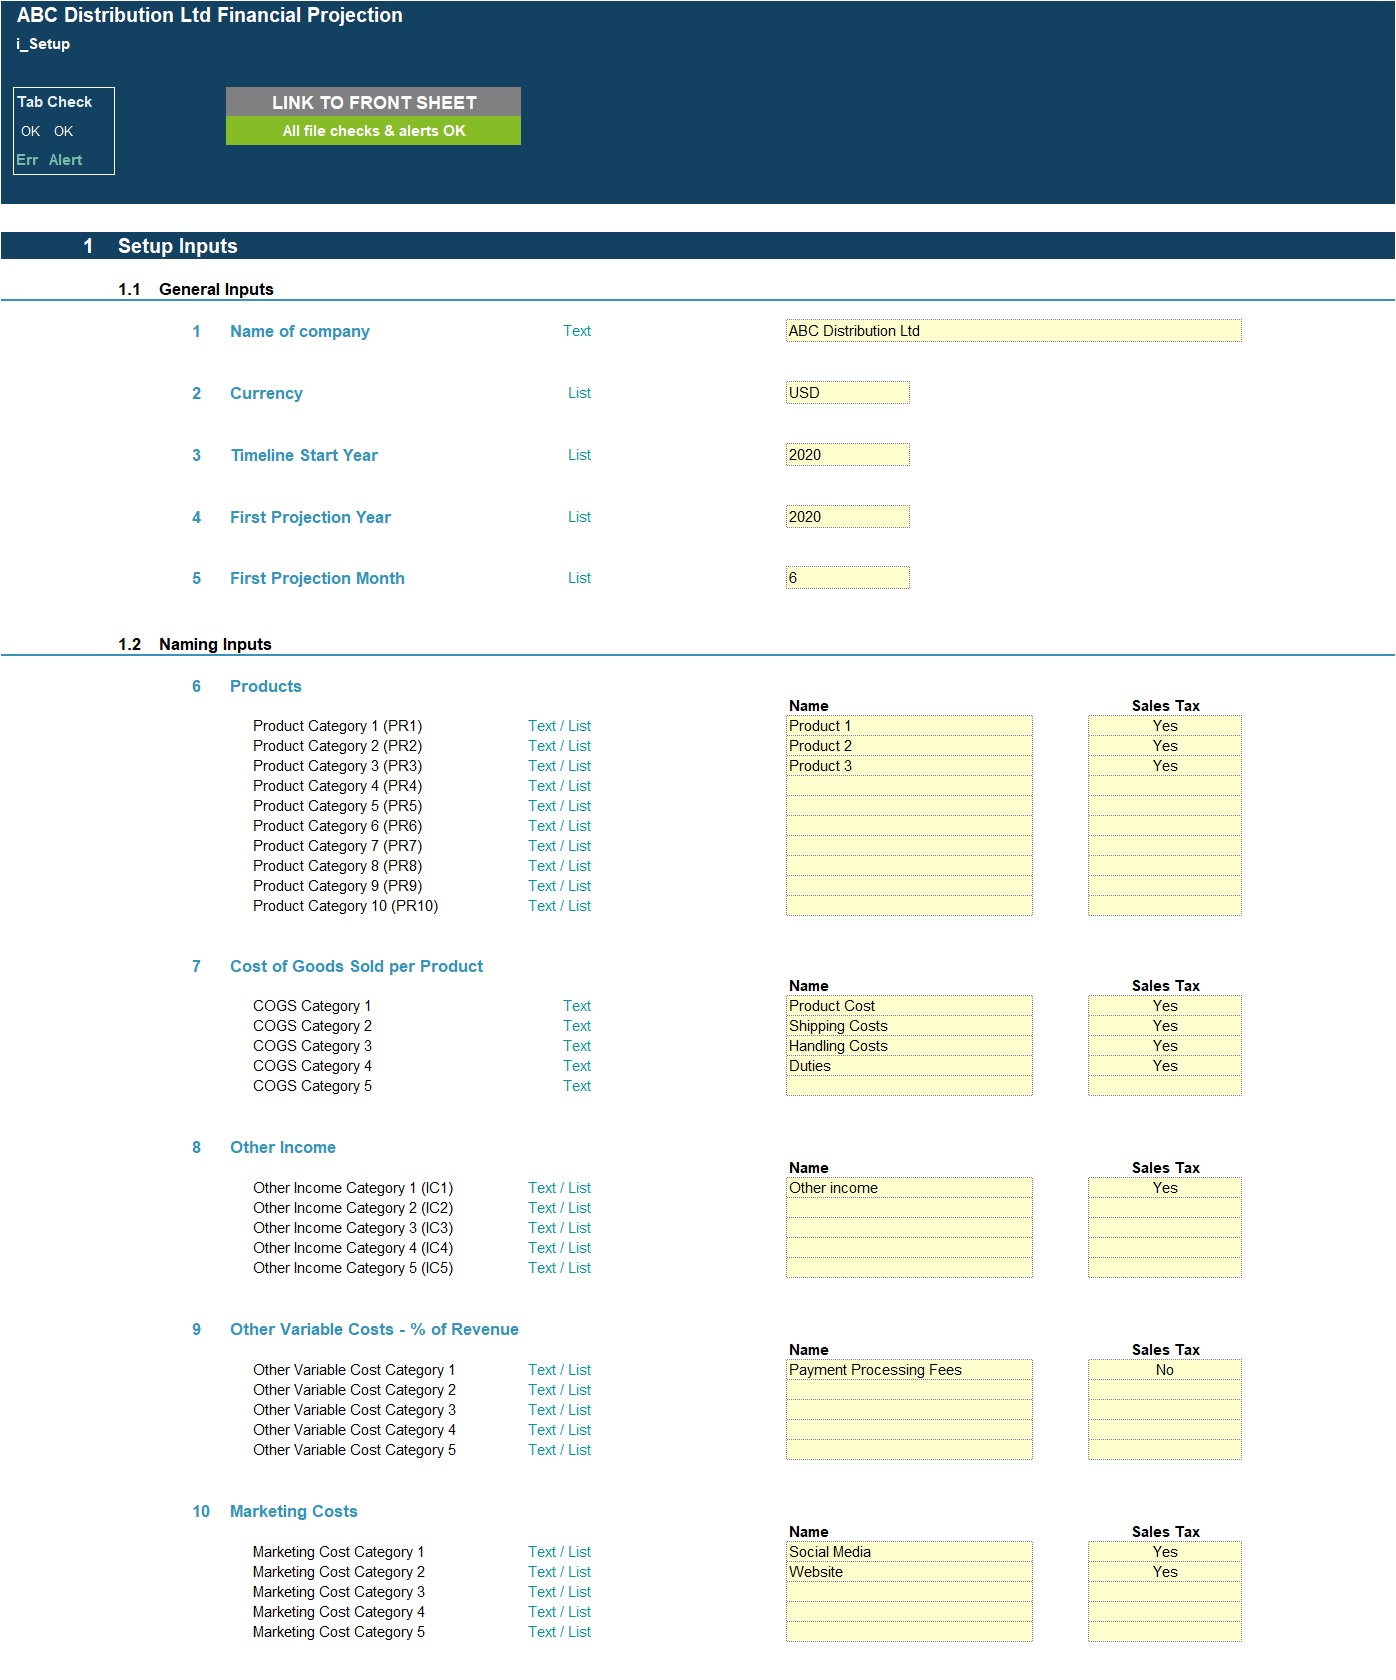
Setup Inputs:
• Name of business;
• Currency;
• First projection year and month;
• Naming for product categories, cost of goods categories, other income, other variable costs, marketing costs, staff costs, admin costs, fixed assets and borrowings;
• Sales tax applicability for products, cost of goods, other income and expenses and fixed assts.
Actuals Inputs:
• Opening balance sheet (for existing businesses);
• Income Statement actuals (for trend analysis);
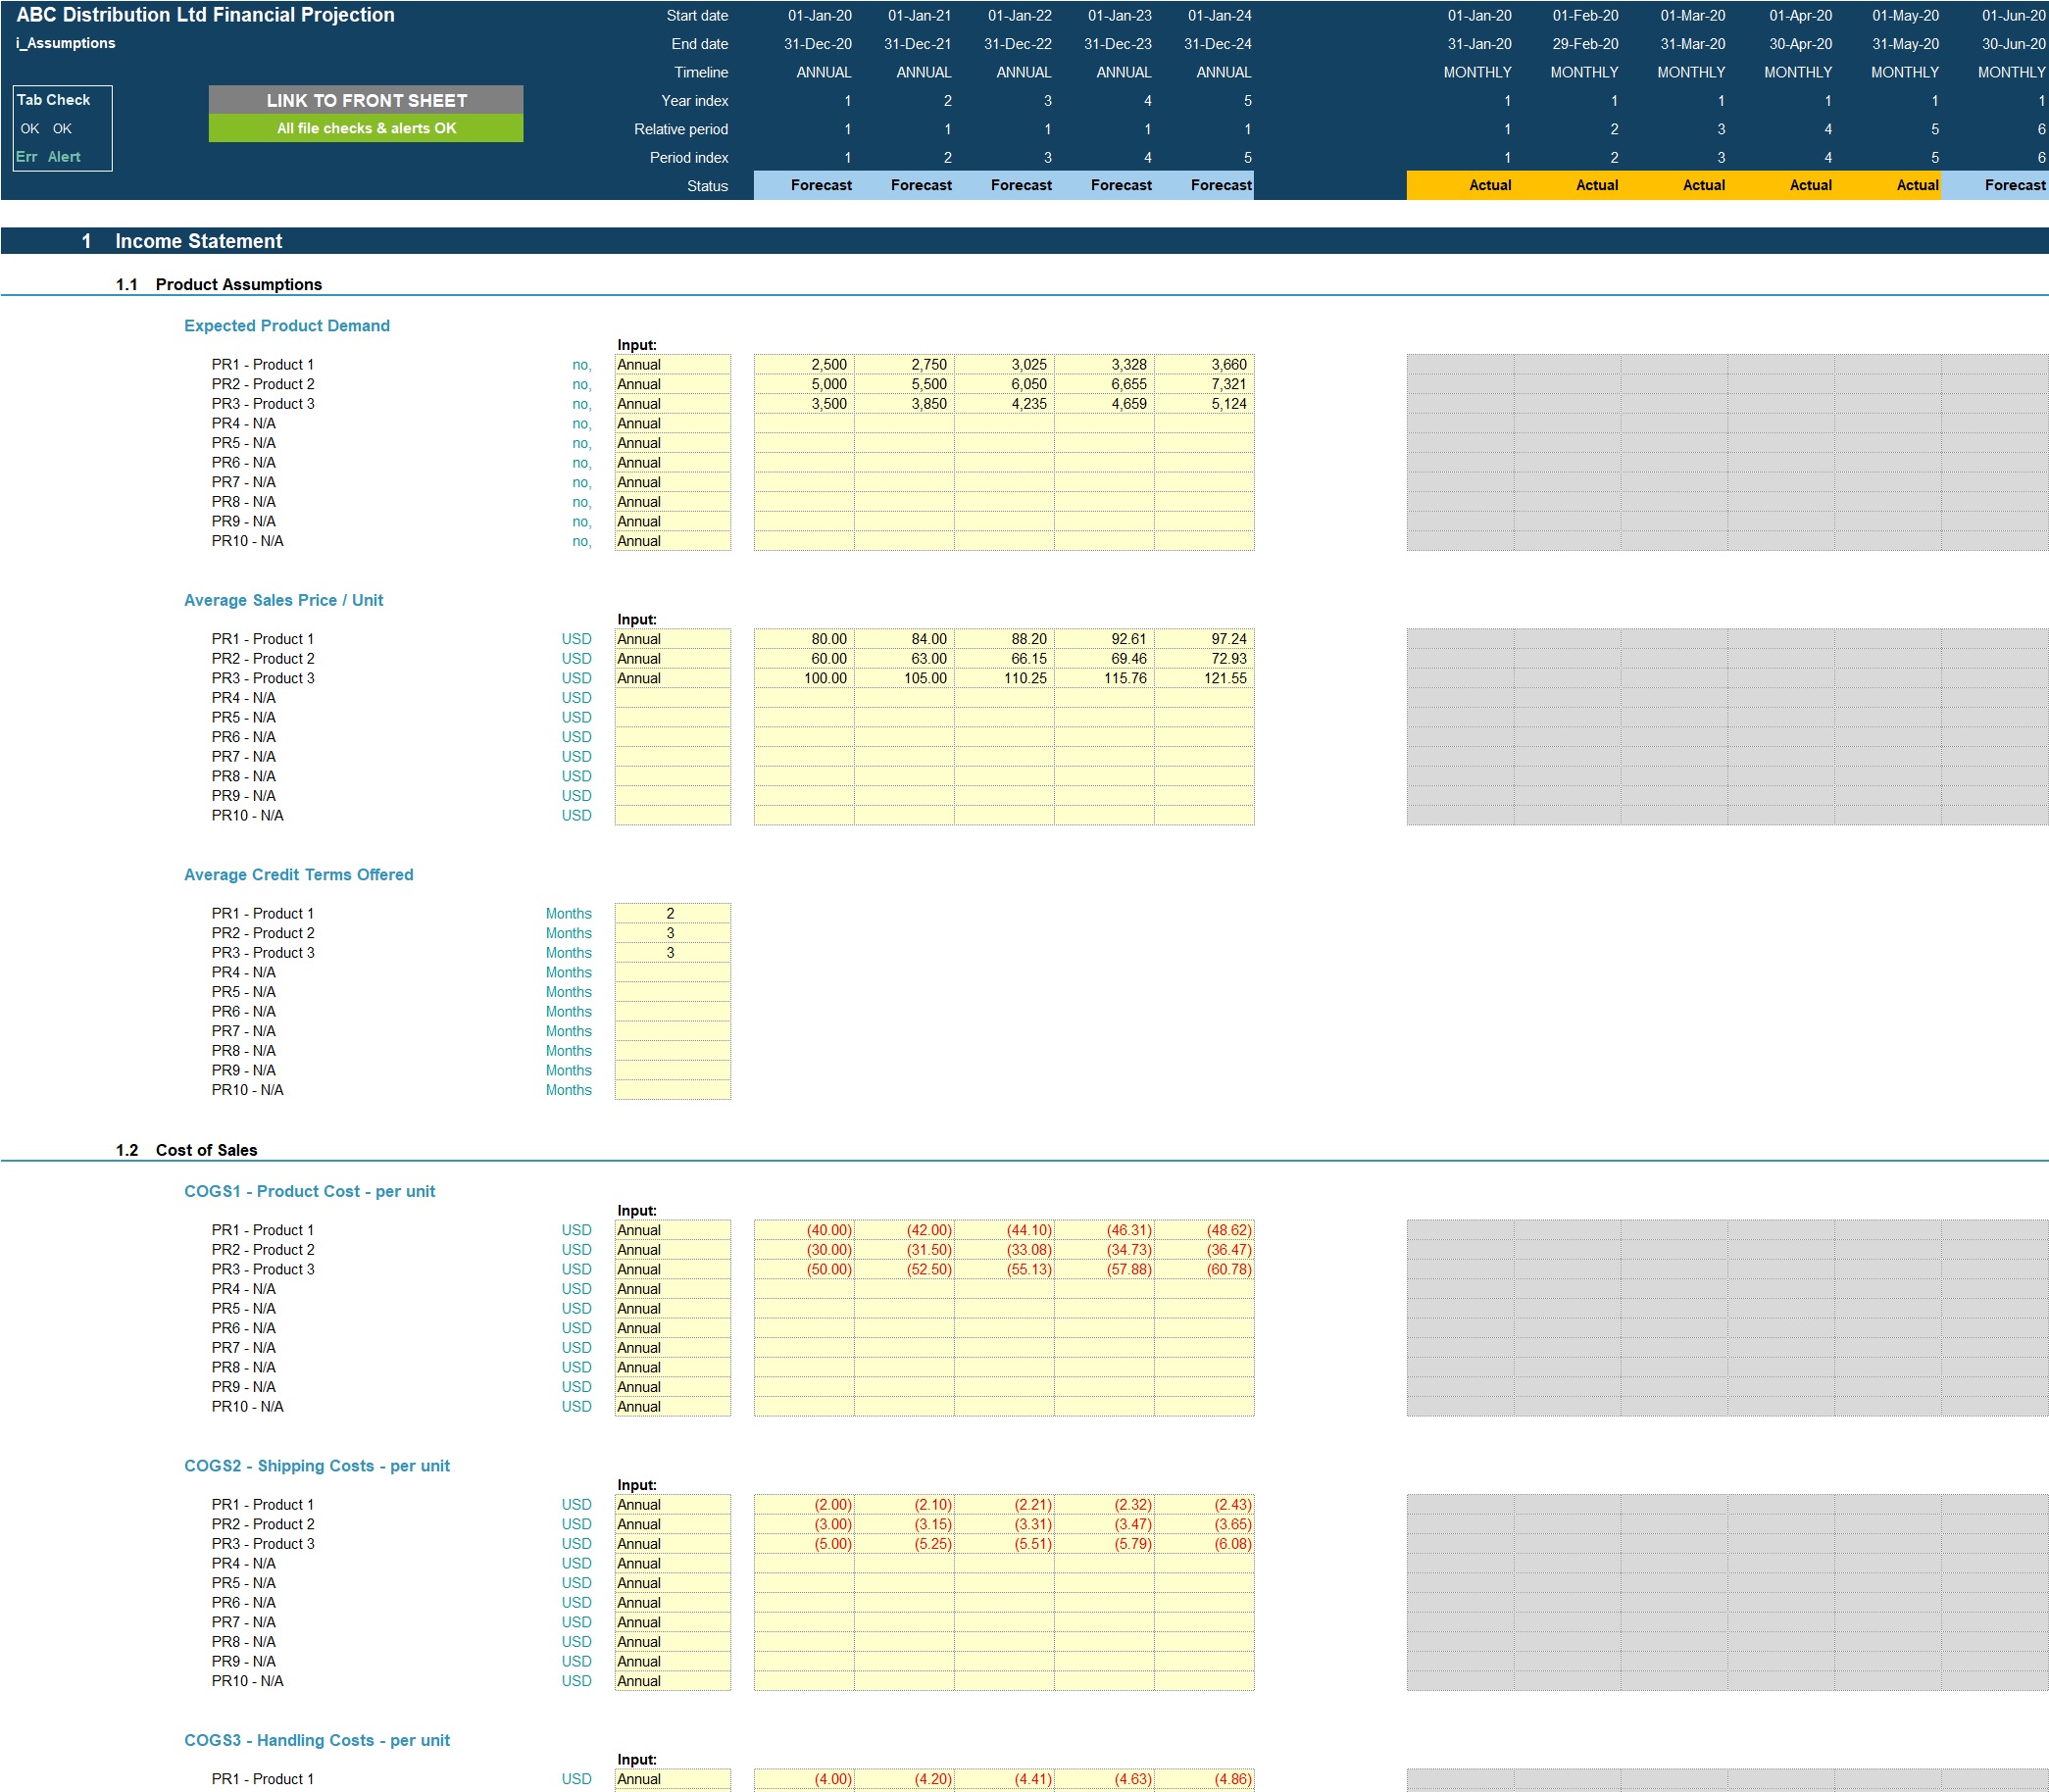
Projection Inputs:
• Revenue inputs including sales volume, sales prices and average credit terms offered;
• Cost of goods inputs including cost per unit, safety stock percentage and average credit terms received;
• Variable cost inputs including percentage of revenue applicable to and cost percentage of revenue;
• Other costs inputs including staff costs, marketing costs and admin costs;
• Sales and corporate tax inputs including rate and payment periods;
• Dividend inputs including amount (percentage of retained earnings) and frequency;
• Fixed assets including addition amounts and useful life;
• Borrowings including addition amounts and interest rate;
• Share capital additions;
• Discount rate inputs (for valuation calculation).
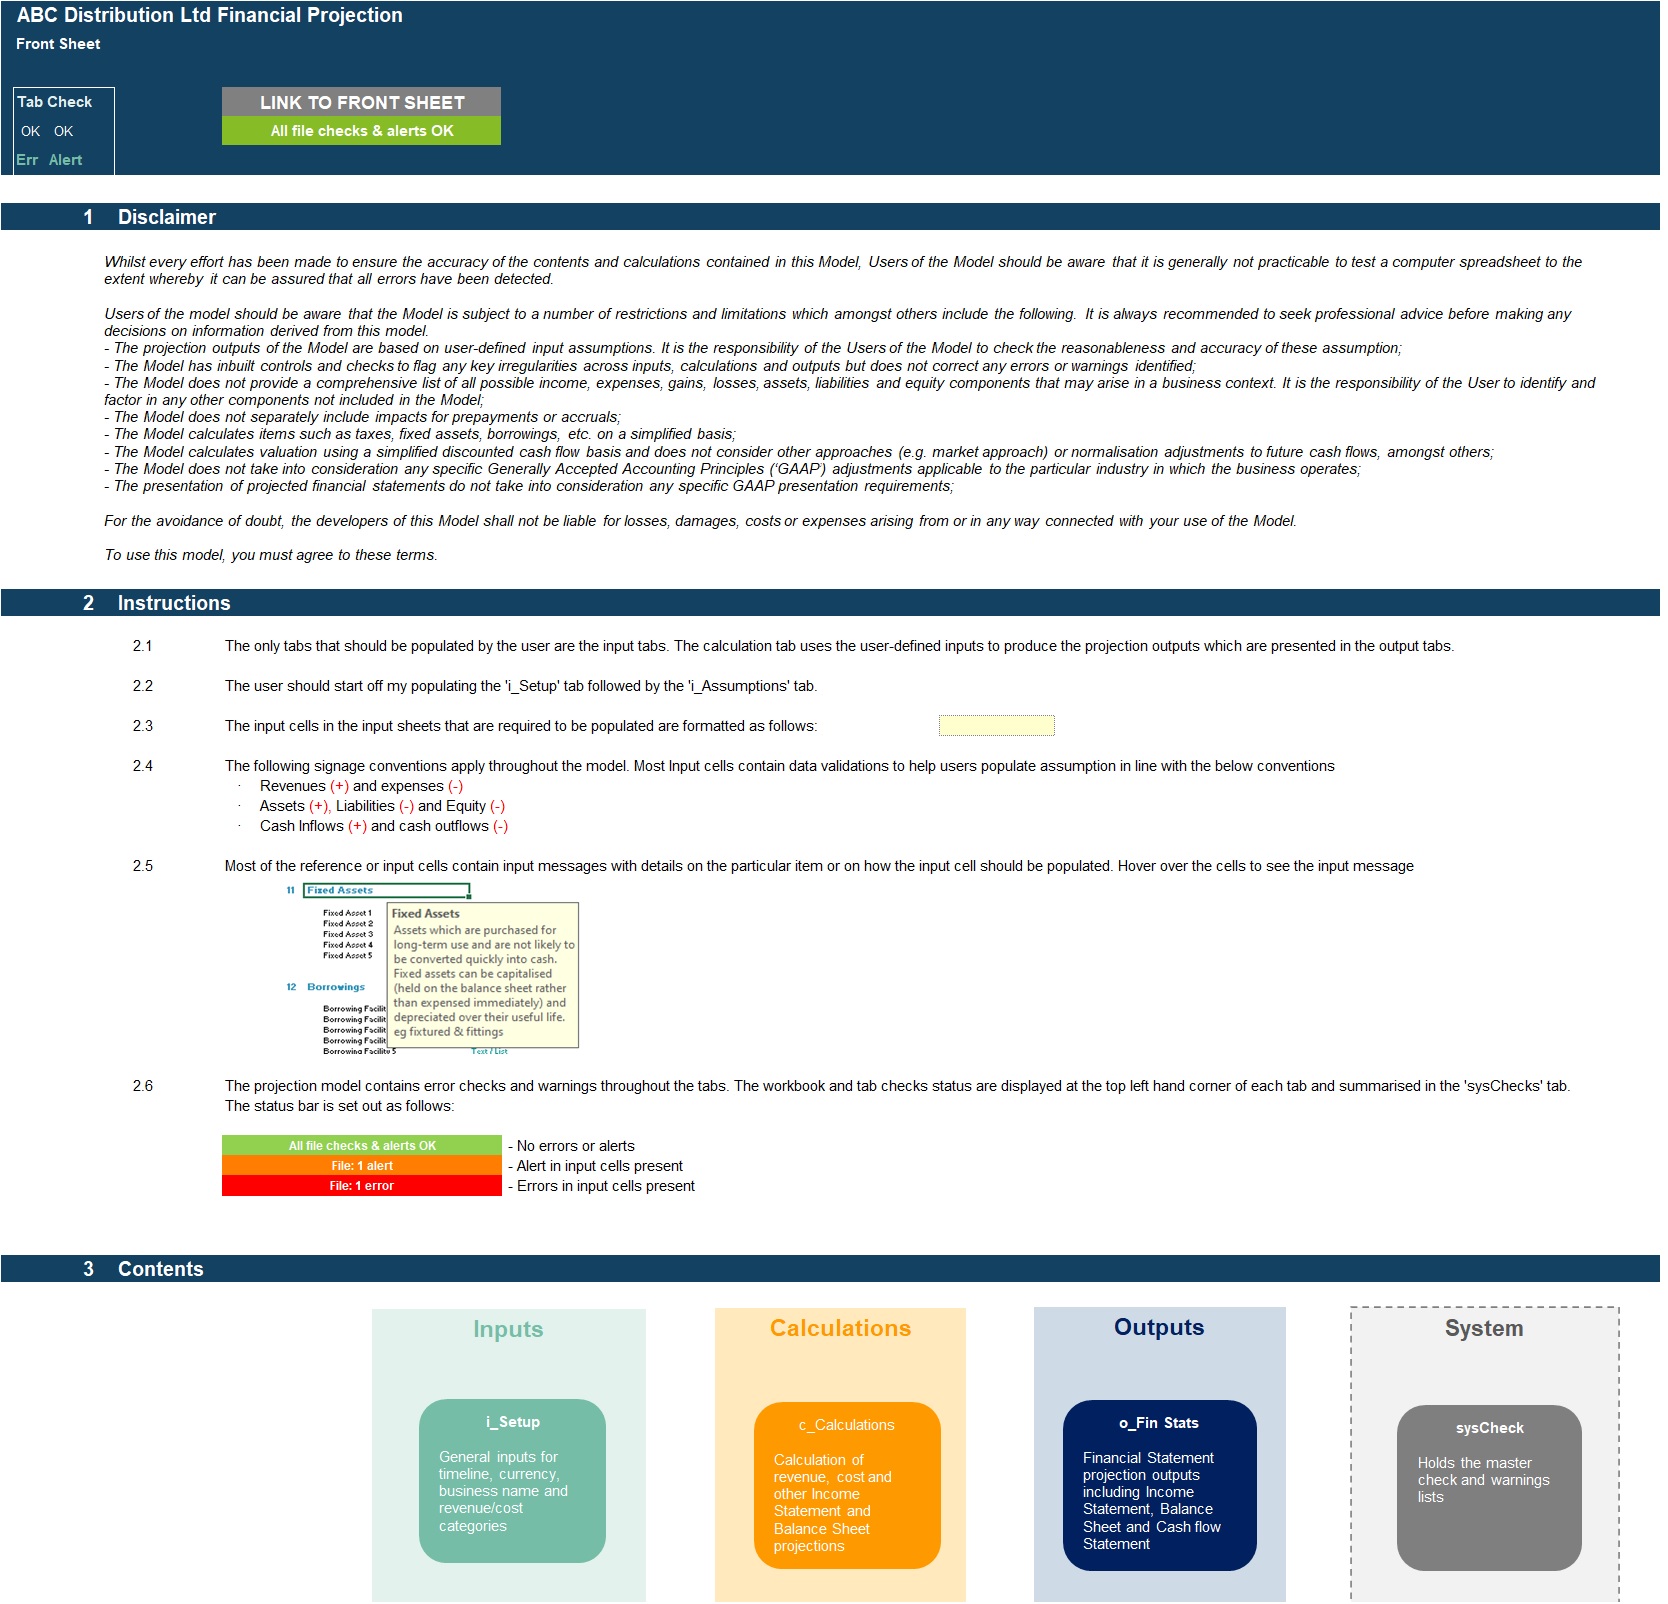
MODEL STRUCTURE
The model comprises of 9 tabs split into input ('i_'), calculation ('c_'), output ('o_') and system tabs. The tabs to be populated by the user are the input tabs ('i_Setup', ‘i_Actuals' and 'i_Assumptions'). The calculation tab uses the user-defined inputs to calculate and produce the projection outputs which are presented in 'o_Fin Stats', ‘o_Charts' and ‘o_DCF'.
System tabs include:
• A 'Front Sheet' containing a disclaimer, instructions and contents;
• A checks dashboard containing a summary of checks by tab.
KEY FEATURES
Other key features of this model include the following:
• The model follows good practice financial modelling guidelines and includes instructions, line item explanations, checks and input validations;
• The model contains a flexible timeline that allows for a mix of actual and forecast period across a 5-year period. This allows projections to be easily rolled forward as forecast periods become actual period;
• Timeline is split on a monthly basis and summarised on an annual basis;
• The model allows the user to model up to 10 separate product categories with their own unique cost of goods setup;
• The model is not password protected and can be modified as required following download;
• The model is reviewed using specialised model audit software to help reduce risk of formula inconsistencies;
• The model allows for the following number of underlying categories for each line item (these can be easily expanded if required):
Products – 10 categories;
Cost of Goods Sold – 5 categories (for each product category);
Other variable costs – 5 categories
Staff costs – 8 categories;
Marketing costs – 5 categories;
Admin expenses – 15 categories;
Fixed assets – 5 categories;
Borrowings – 3 facilities
• Apart from projecting revenue and costs the tool includes the possibility to model receivables and payables, fixed assets, borrowings, dividends and corporate tax;
• Business name, currency, starting projection period are fully customisable;
• Revenue, cost and fixed asset descriptions are fully customisable;
• The model included an integrated discounted cash flow valuation using the projected cash flow outputs;
• The model includes instructions, line item explanations, checks and input validations to help ensure input fields are populated accurately;
• The model includes a checks dashboard which summarises all the checks included in the various tabs making it easier to identify any errors.
This financial projection model is designed to provide a comprehensive analysis of your distribution business's fiscal trajectory. With the ability to customize inputs for multiple product categories and income streams, it equips decision-makers with the insights needed to navigate financial complexities and optimize performance.
Got a question about the product? Email us at support@flevy.com or ask the author directly by using the "Ask the Author a Question" form. If you cannot view the preview above this document description, go here to view the large preview instead.
Source: Best Practices in Retail Strategy, Integrated Financial Model Excel: Distribution Startup/Existing Business Financial Projection 3 Statement Model Excel (XLSX) Spreadsheet, Projectify
ABOUT THE AUTHOR
We are financial modelling professionals, accountants and CFA charterholders with experience working within Deloitte supporting clients with their financial planning and decision support needs. Our aim is to provide robust and easy-to-use financial models that follow good practice financial modelling guidelines and assist individuals and businesses with key financial planning and analysis ... [read more]
Ask the Author a Question
You must be logged in to contact the author.
