
 Click main image to view in full screen. Unlock all 28 preview images:
Space Launch Economics and Valuation Model – Excel XLSX
Excel (XLSX) + supplemental PDF


BENEFITS OF THIS DOWNLOADABLE EXCEL DOCUMENT
- Connects launch cadence, reuse, learning, backlog, mission pricing, constellation services, and risk to a fully linked 10-year financial forecast.
- Quantifies enterprise value, equity value, project IRR, peak funding need, and the assumptions with the greatest impact through scenarios and sensitivities.
- Provides centralized editable assumptions, three decision-ready dashboards, and 25 automated audit checks in a self-contained workbook.
DEFENSE EXCEL DESCRIPTION
🚀 SPACE LAUNCH ECONOMICS, OPERATIONS & VALUATION
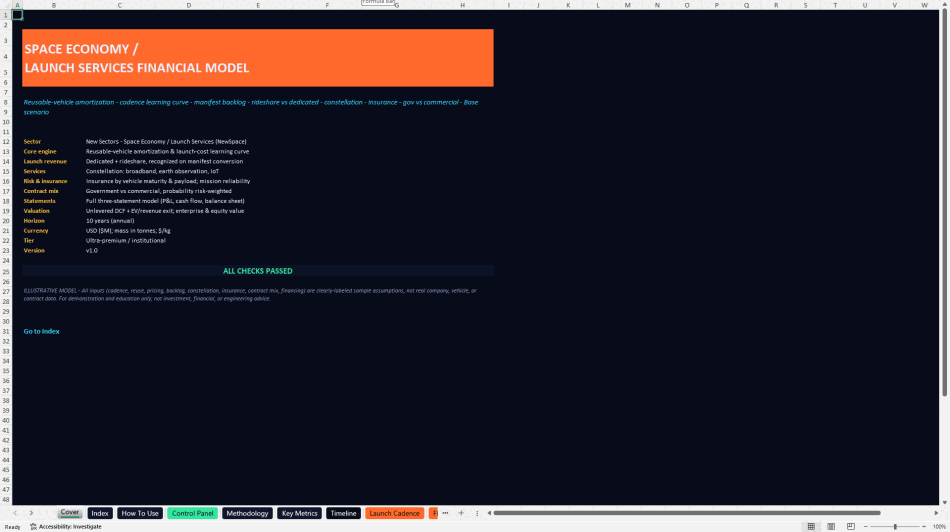
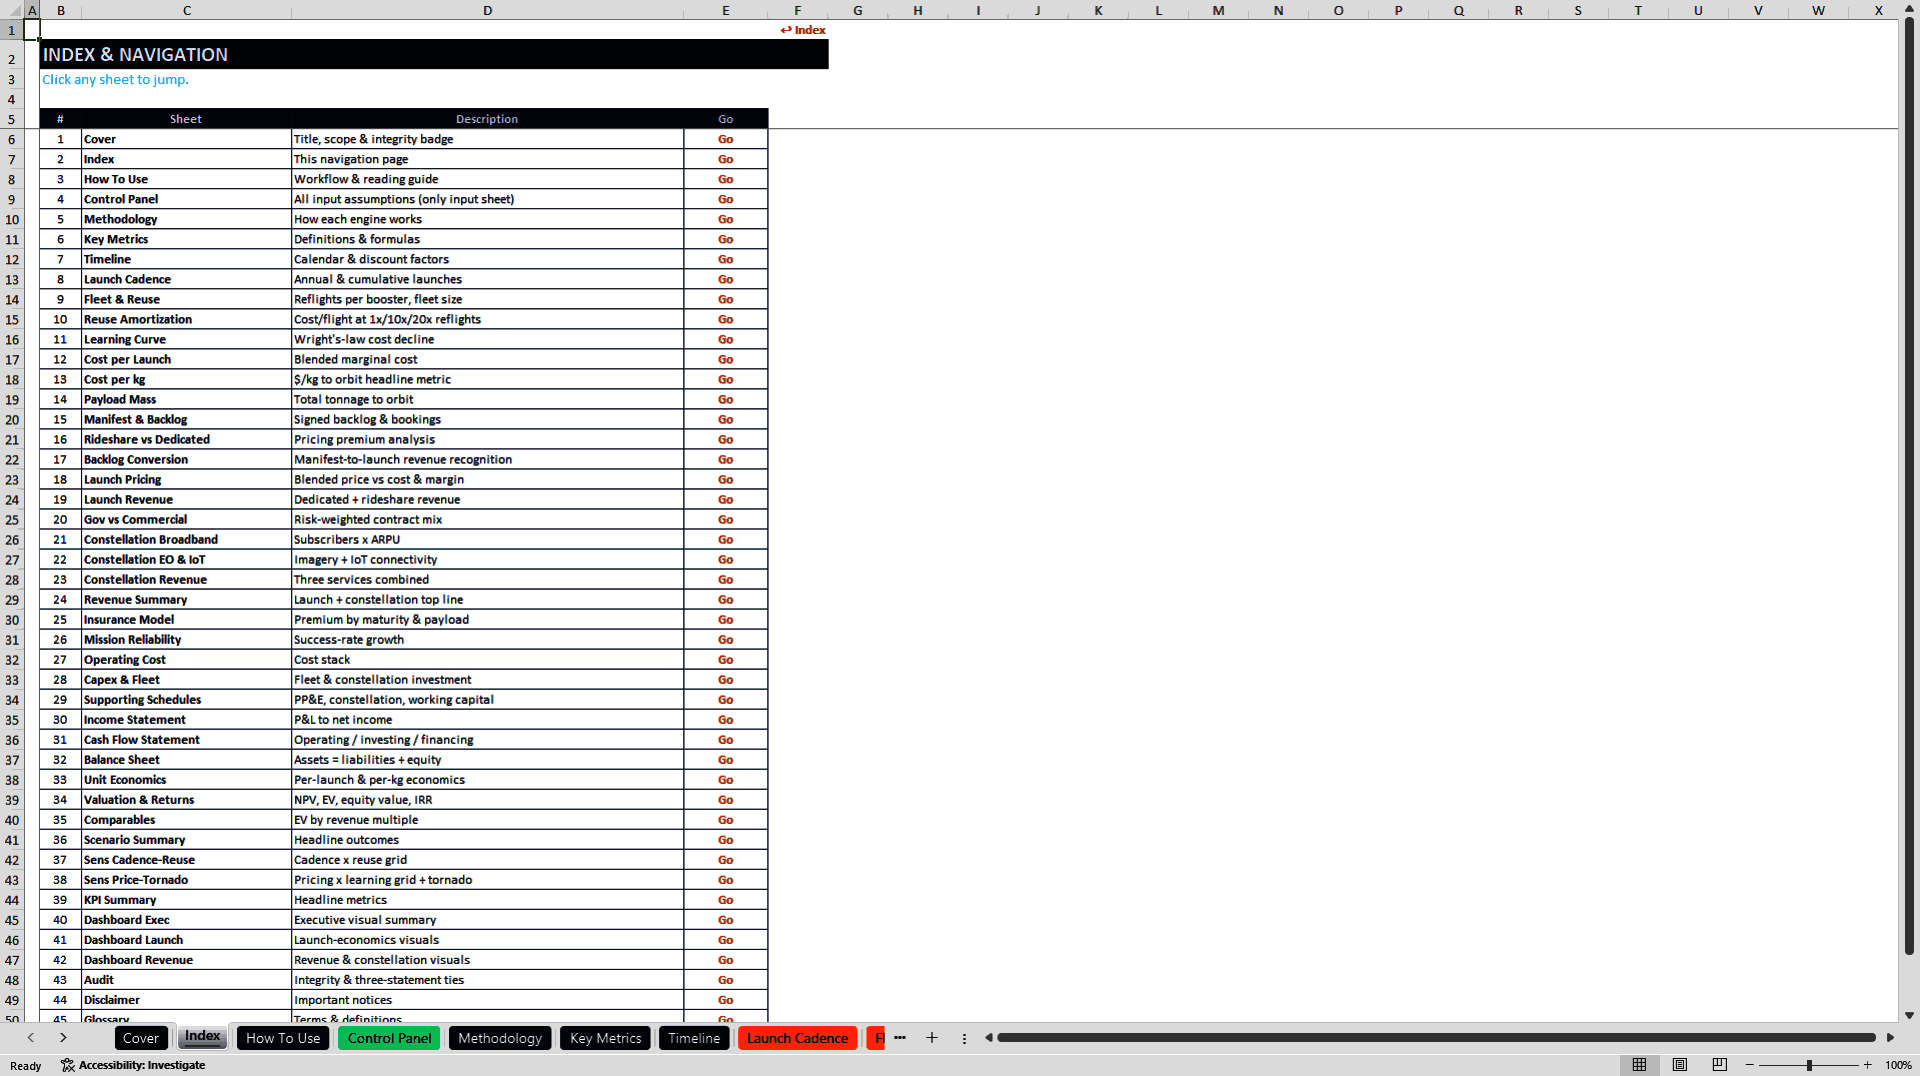
The Space Launch Economics and Valuation Model is an institutional-style, 46-sheet financial planning workbook designed to evaluate a launch-services platform over a 10-year annual forecast. It connects launch cadence, reusable-vehicle economics, cumulative learning, mission pricing, manifest conversion, constellation services, mission risk, insurance, capital requirements, three-statement forecasting, scenarios, sensitivities, and valuation in one formula-driven framework.
The model is designed for aerospace and NewSpace founders, finance teams, investors, consultants, corporate-development professionals, strategy teams, and analysts who need to translate an operating thesis into decision-ready financial projections. It is particularly useful for business planning, feasibility studies, fundraising, investment review, budgeting, scenario analysis, commercial diligence, and valuation.
🎛️ CENTRALIZED INPUTS
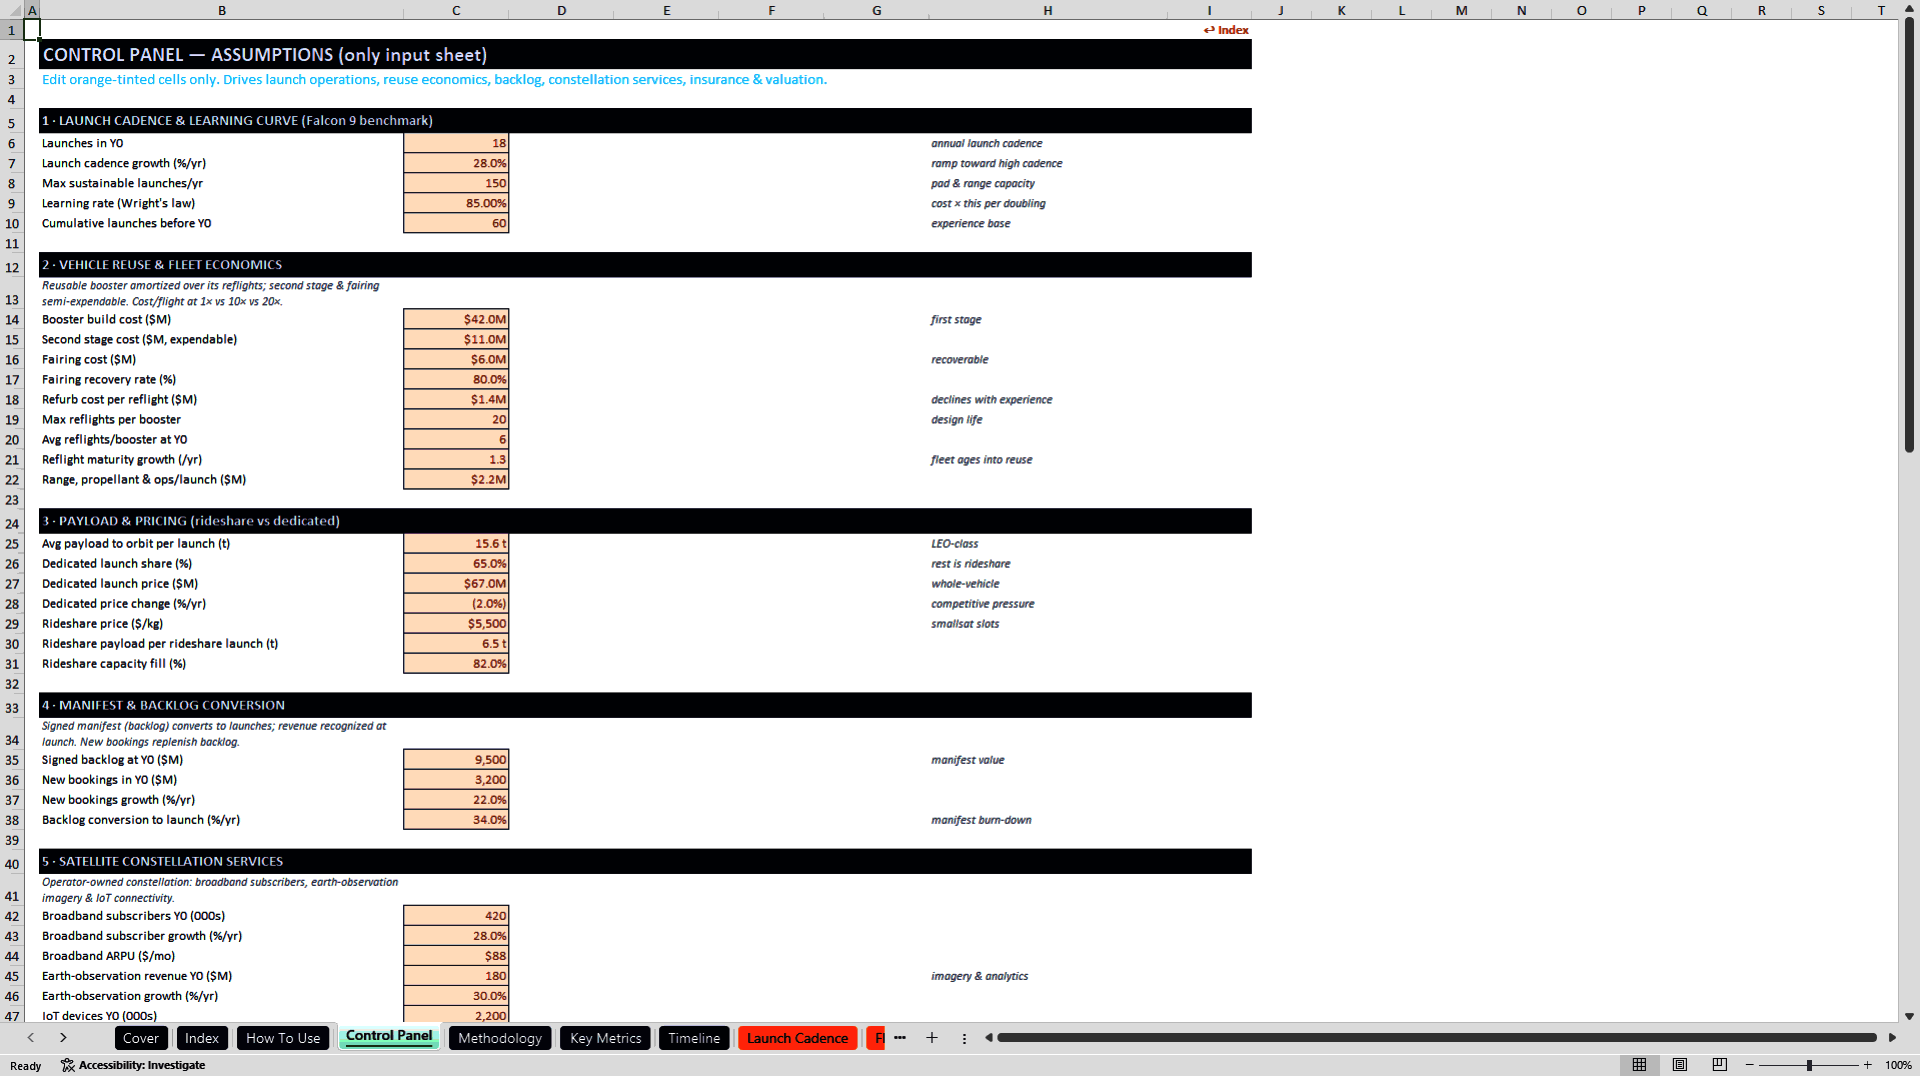
All editable assumptions are located on one Control Panel and are grouped into 11 operating and financial sections. Users can change launch cadence, learning rate, reusable-booster life, refurbishment cost, payload mass, dedicated and rideshare pricing, backlog and bookings, broadband subscribers, Earth-observation revenue, IoT devices, insurance, government/commercial mix, R&D, SG&A, capex, financing, working capital, tax, WACC, terminal growth, and exit multiple.
• Orange-tinted cells identify the editable assumptions.
• Bear, Base, and Bull cases flex cadence, pricing, reuse maturity, constellation demand, and bookings together.
• Validation flags test important input bounds before the results are used.
♻️ LAUNCH, REUSE & LEARNING ECONOMICS
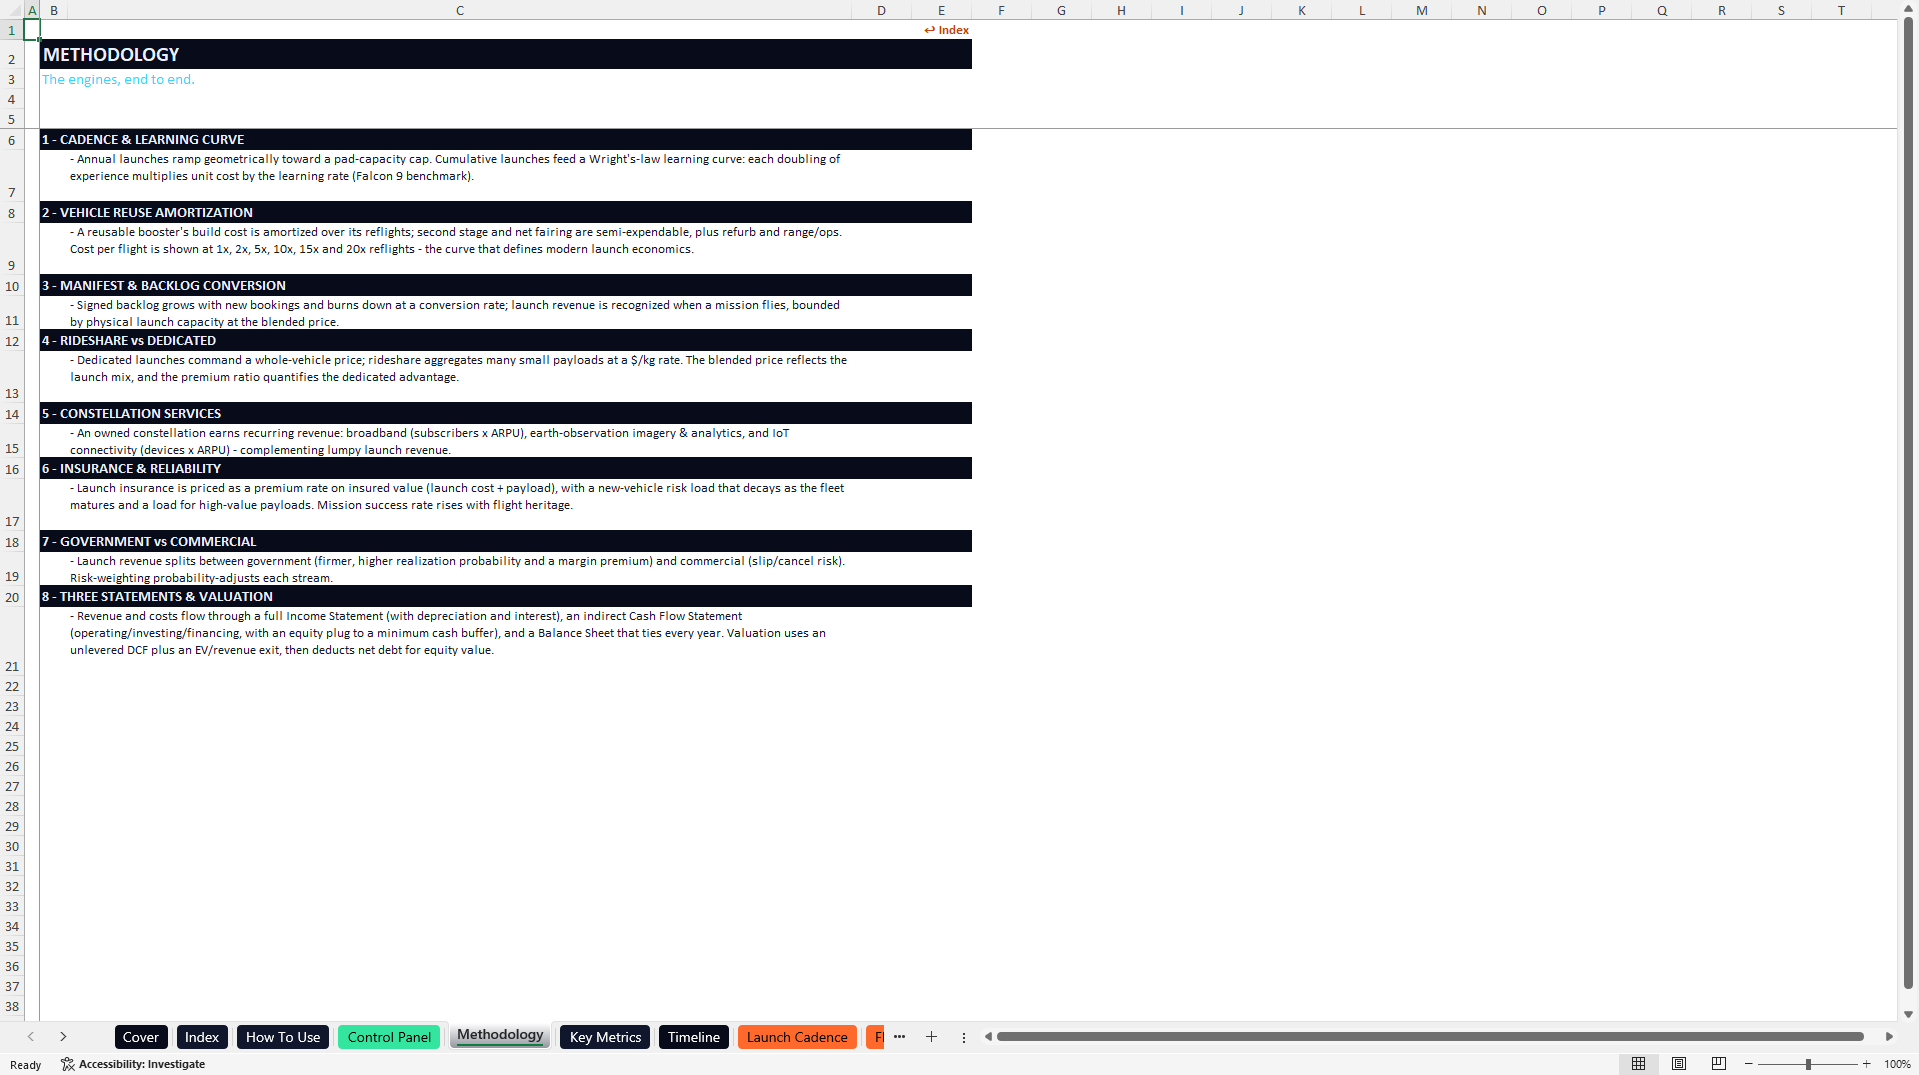
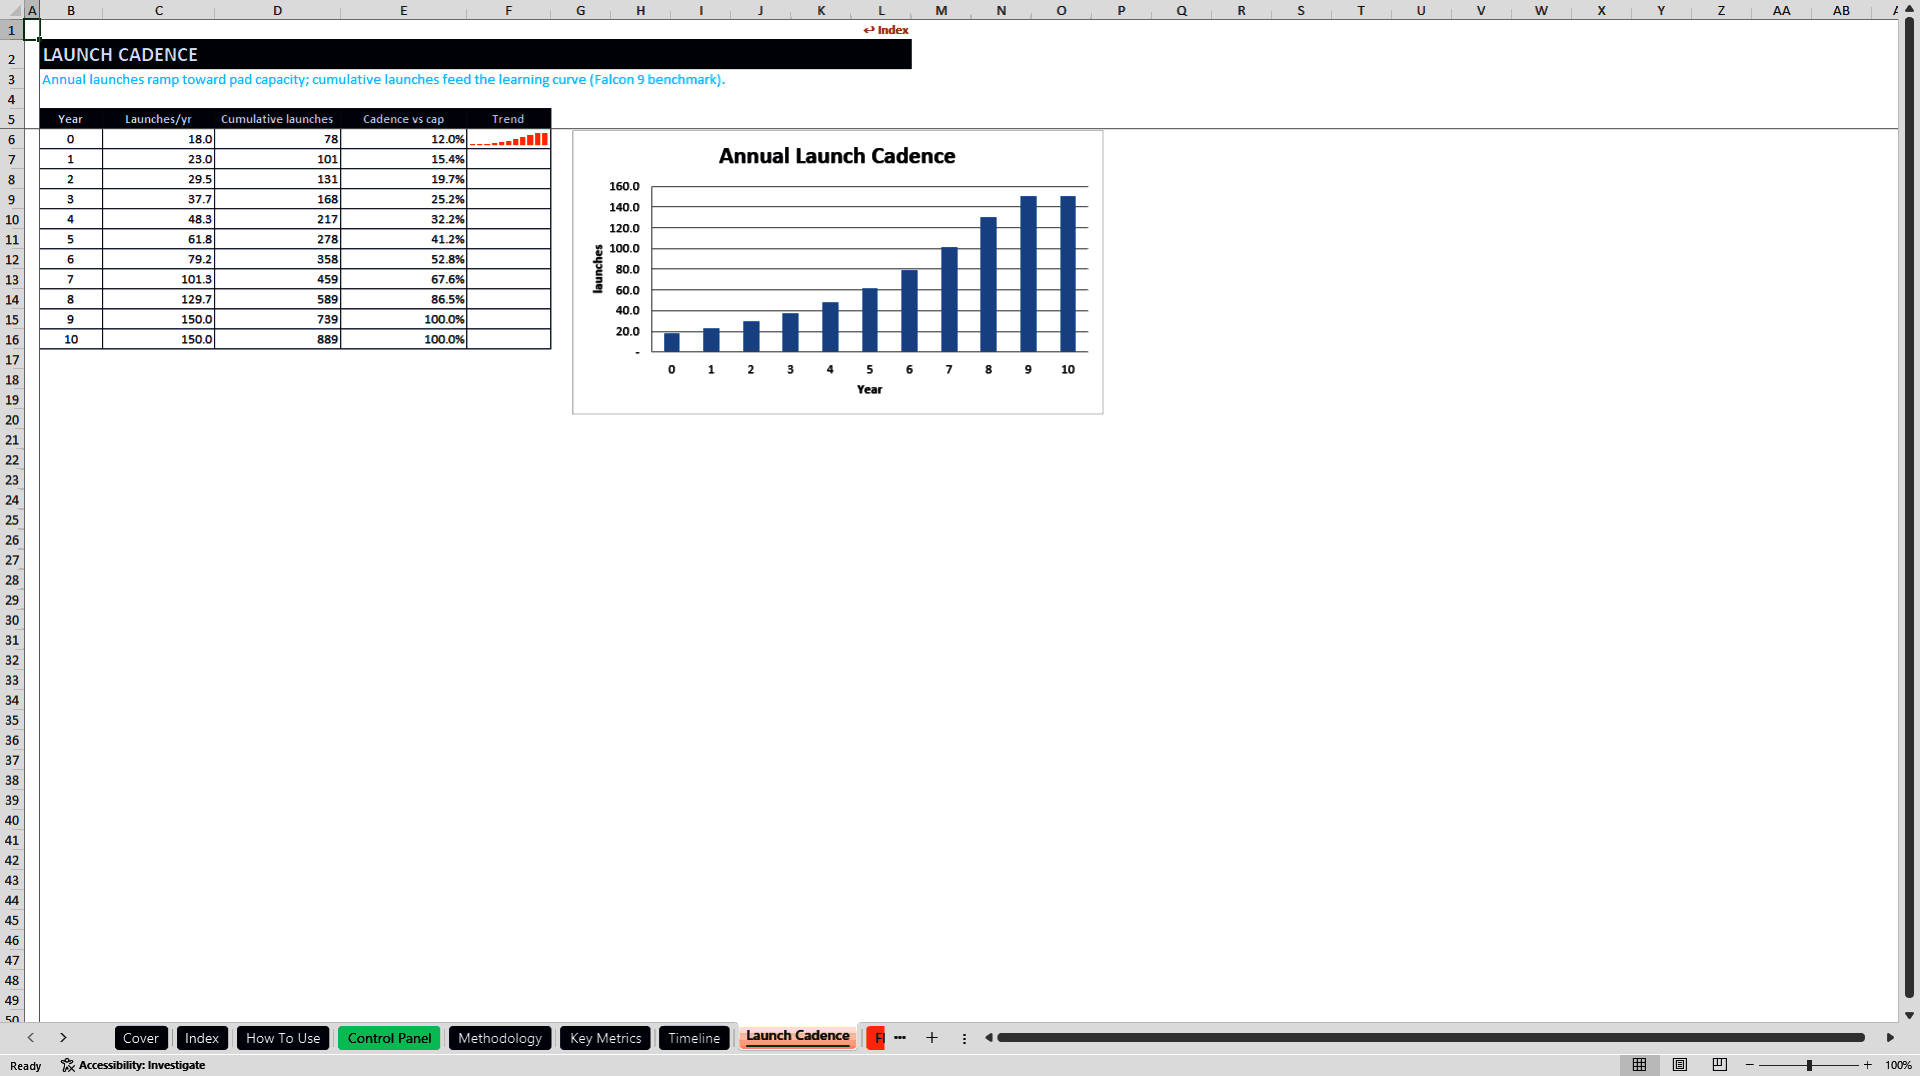
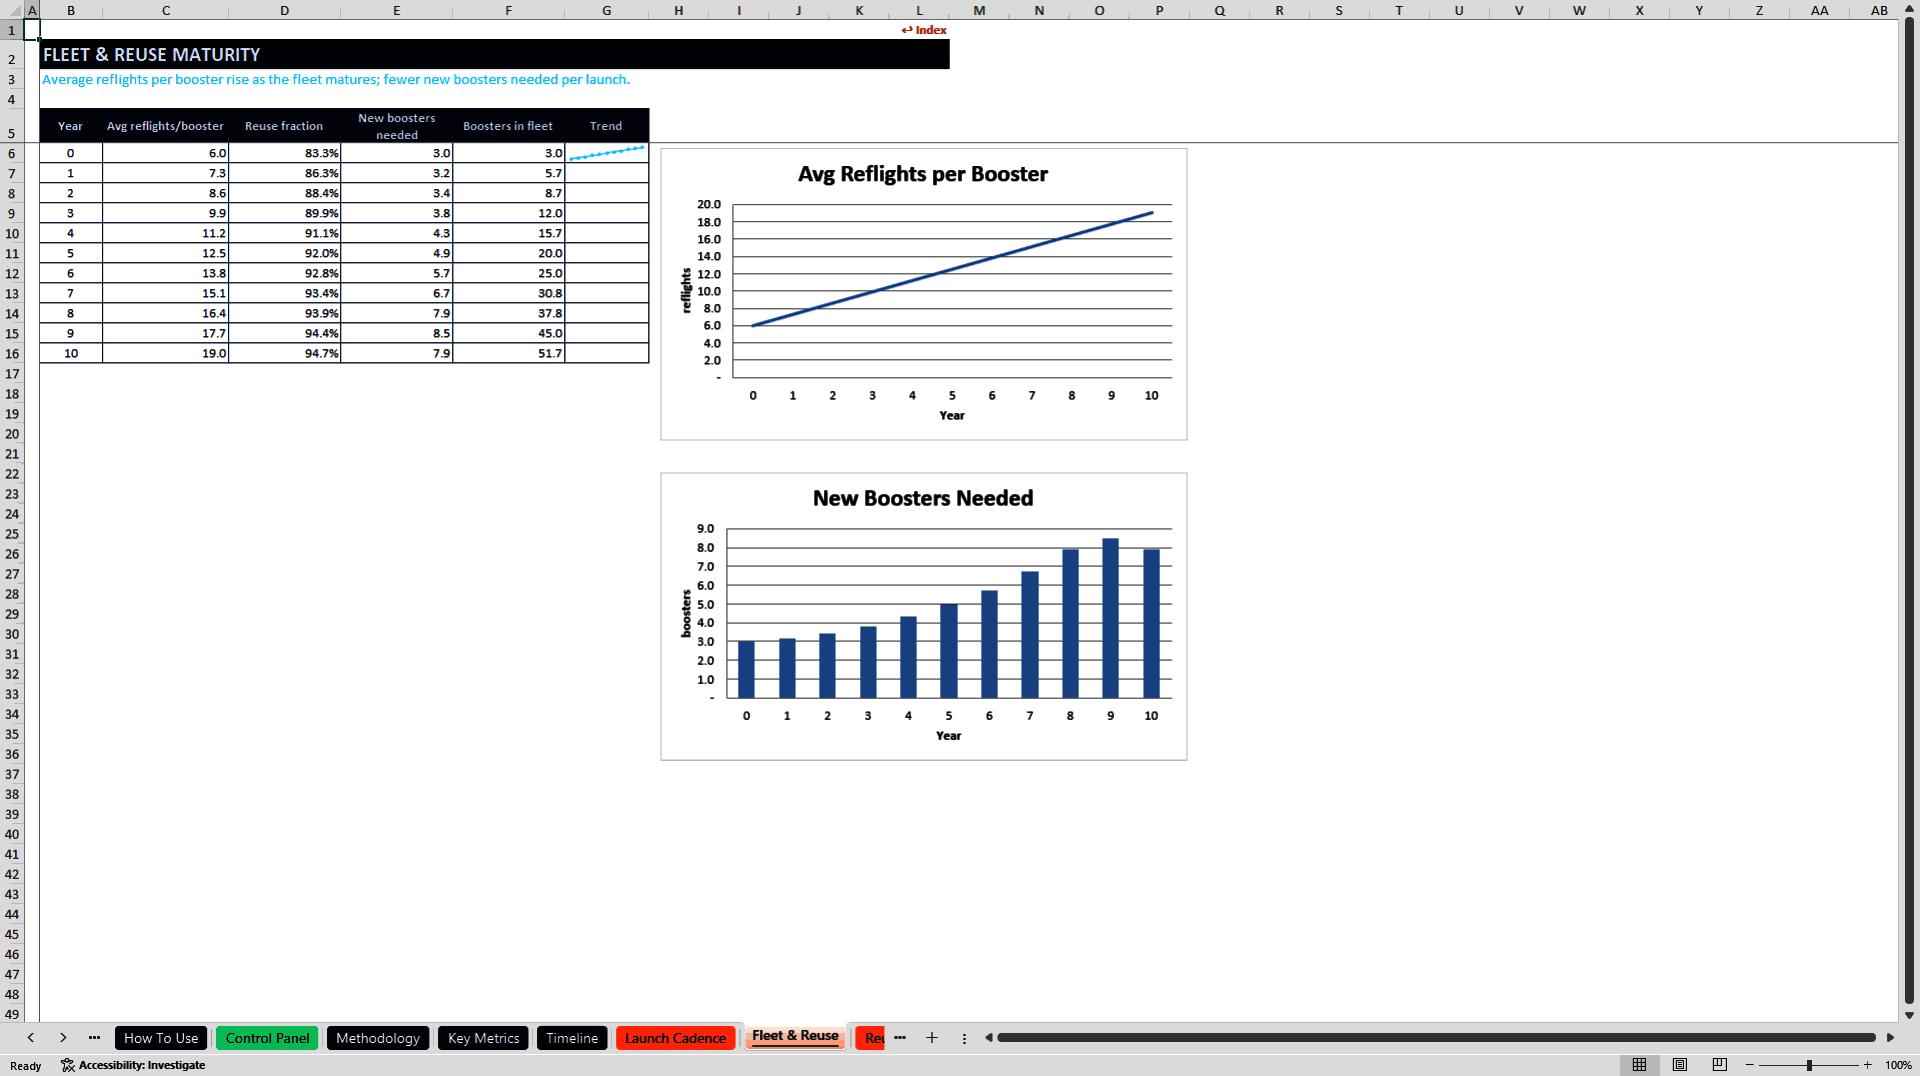
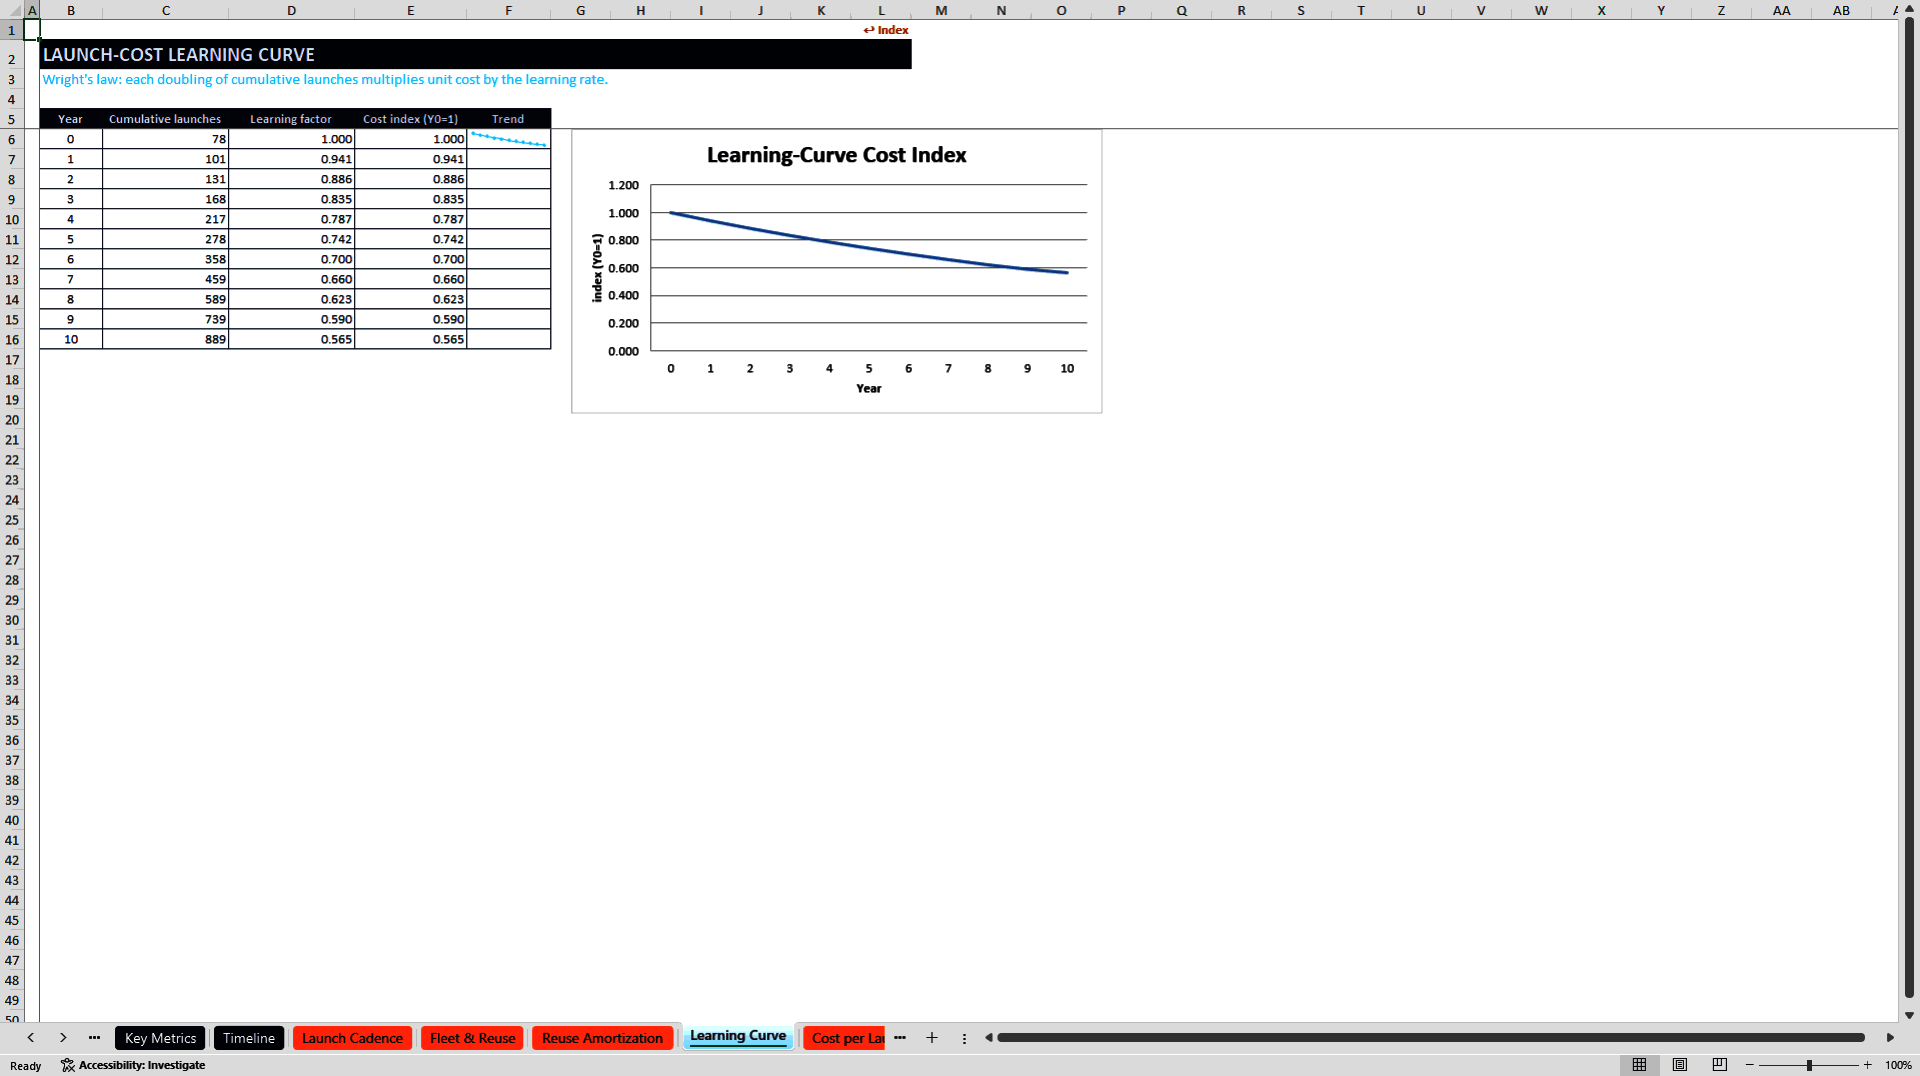
Annual launches ramp toward a configurable sustainable-capacity limit. Cumulative launches feed a Wright's-law learning curve so the model reflects the relationship between experience and unit cost. The fleet schedule projects average booster reflights, reuse fraction, new boosters required, and total fleet development.
The signature Reuse Amortization module separates booster build cost, expendable second-stage cost, fairing cost and recovery, refurbishment, and launch operations. It presents cost per flight at 1, 2, 5, 10, 15, and 20 reflights. Linked schedules calculate annual cost per launch, payload mass to orbit, and cost per kilogram.
• Test how booster life changes amortized flight cost.
• Assess the combined effect of cadence, reuse, and cumulative learning.
• Compare blended revenue per launch with mission cost and gross profit.
📚 MANIFEST, PRICING & REVENUE RECOGNITION
The backlog engine begins with signed manifest value, adds new bookings, applies a conversion rate, and recognizes revenue when missions are flown. Recognized launch revenue is limited by physical launch capacity at the blended mission price, preventing the financial forecast from exceeding the operating plan.
Dedicated and rideshare missions are modeled separately. Dedicated missions use a whole-vehicle price, while rideshare missions combine payload capacity, fill rate, and a price per kilogram. The model then calculates dedicated and rideshare launches, revenue by mission type, dedicated pricing premium, blended launch price, gross profit per mission, and launch gross margin.
🌐 CONSTELLATION SERVICES
The workbook models an owned satellite-constellation business alongside launch services. Separate revenue engines calculate broadband subscriptions and monthly ARPU, Earth-observation imagery and analytics, and IoT connectivity based on devices and annual ARPU. These modules allow users to evaluate a vertically integrated platform with both mission-based launch income and recurring downstream revenue.
🛡️ RELIABILITY, INSURANCE & CONTRACT MIX
Mission success probability rises with flight heritage. Insurance cost is calculated from insured value using a base rate, a new-vehicle risk load that declines with maturity, and a load for high-value payloads. Launch revenue is also divided between government and commercial customers and probability-weighted using separate realization assumptions. A government gross-margin premium can be applied to reflect contract economics.
🏗️ OPERATING COST, CAPEX & FINANCING
The operating model includes launch cost, insurance, R&D, and SG&A. Capex is separated between fleet/infrastructure and constellation investment. Supporting schedules calculate working capital, depreciation, interest, and taxes. Financing inputs include opening equity, long-term debt, customer deposits linked to backlog, and a minimum cash balance. Where operating cash is insufficient, the model calculates the equity funding needed to maintain the minimum cash buffer and identifies peak funding need.
🧾 THREE FINANCIAL STATEMENTS
The Income Statement, indirect Cash Flow Statement, and Balance Sheet are fully linked from Y0 through Y10. The statements cover revenue, operating costs, EBITDA, depreciation, EBIT, interest, taxes, net income, operating cash flow, working-capital movements, capex, debt/equity financing, ending cash, receivables, fixed assets, constellation assets, payables, deferred revenue, debt, paid-in capital, and retained earnings. A balance check verifies that assets equal liabilities plus equity in every forecast year.
💎 VALUATION, RETURNS & RISK ANALYSIS
Valuation combines an unlevered discounted cash flow with a terminal value based on an EV/revenue exit multiple. Outputs include operating NPV, present value of the exit, enterprise value, net debt, equity value, project IRR, revenue CAGR, EBITDA margin, implied EV/revenue, and peak funding requirement. A separate valuation-multiple table shows the effect of alternative exit assumptions.
The model also includes a cadence-versus-reuse sensitivity for launch gross profit, a price-versus-learning grid for revenue, and a tornado analysis showing the enterprise-value impact of launch cadence, pricing, reuse, constellation demand, bookings, learning rate, insurance, R&D, and exit multiple.
📊 DECISION-READY OUTPUTS & CONTROLS
Three dashboards organize the results into Executive, Launch Economics, and Revenue/Constellation views. A KPI Summary consolidates the headline outputs, while a separate Audit sheet performs 25 automated checks covering revenue composition, backlog, launch-capacity constraints, contract mix, reusable-vehicle calculations, unit economics, earnings, cash flow, balance-sheet ties, retained earnings, key operating bounds, and scenario validity.
• Use the Executive Dashboard to review growth, earnings, efficiency, and asset composition.
• Use the Launch Dashboard to analyze reuse, cadence, cost, and reliability.
• Use the Revenue Dashboard to review launch mix, constellation mix, backlog, and customer exposure.
⚙️ RECOMMENDED WORKFLOW
1. Open the Control Panel and replace the illustrative assumptions with business-specific inputs.
2. Select a Bear, Base, or Bull case, or create a custom case by changing individual drivers.
3. Review the operating schedules to understand how the assumptions move launch capacity, unit cost, revenue, and investment requirements.
4. Analyze the three statements, valuation, scenarios, sensitivities, dashboards, and KPI Summary.
5. Confirm that all Control Panel validation flags and Audit checks remain clear.
The buyer receives one fully editable, macro-free Microsoft Excel workbook with 46 organized sheets, 47 embedded charts, three dashboards, centralized assumptions, scenario controls, linked statements, valuation schedules, methodology, instructions, glossary, sources/conventions, and audit checks. The workbook is self-contained and has no external file links.
Got a question about the product? Email us at support@flevy.com or ask the author directly by using the "Ask the Author a Question" form. If you cannot view the preview above this document description, go here to view the large preview instead.
Source: Best Practices in Defense, Integrated Financial Model Excel: Space Launch Economics and Valuation Model Excel (XLSX) Spreadsheet, PDMM Financial Models
ABOUT THE AUTHOR

PDMM Financial Models develops professional, decision-ready Excel models for business owners, entrepreneurs, investors, consultants, analysts, and finance teams. Our objective is to transform complex business assumptions into clear, structured analysis that supports better planning and investment decisions.
Our models cover business planning, forecasting, budgeting, feasibility analysis,
... [read more]
Ask the Author a Question
You must be logged in to contact the author.




























