
SOLAR ENERGY EXCEL DESCRIPTION
A Solar Power Project Excel Financial Model is a comprehensive framework designed for simulating the financial feasibility of a solar power project. By integrating all the essential components like capital costs, operating expenses, debt structuring, and cash flows, this model provides a roadmap to profitability for prospective investors. These models often allow for modifications according to individual project specifications, making them highly adaptable. Remember, having a well-structured financial model template is like having a strategic plan, ensuring the success of your solar power project.
Key Components:
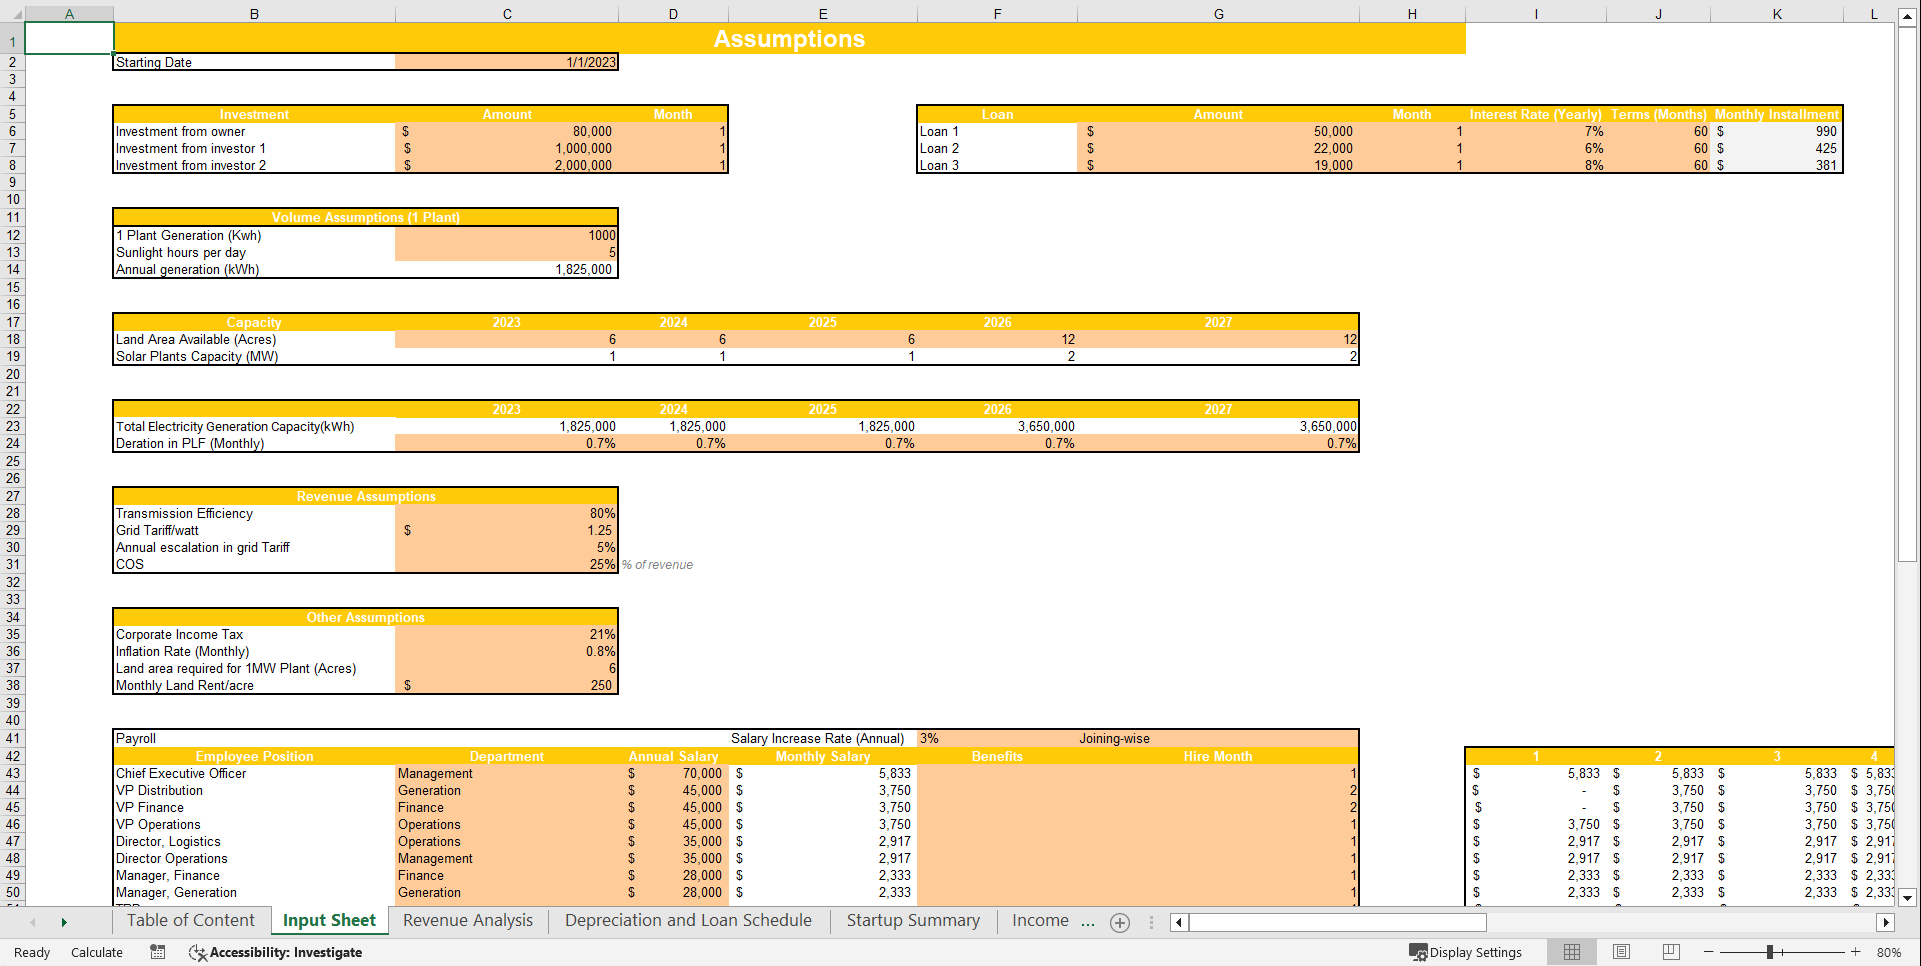
1. Input Sheet
The input sheet is where all your assumptions for the financial model are consolidated. It includes variables such as project size, capital expenditures, operating costs, loan terms, and energy output. This sheet drives the rest of the financial model, and changes to any of these assumptions directly impact the projections.
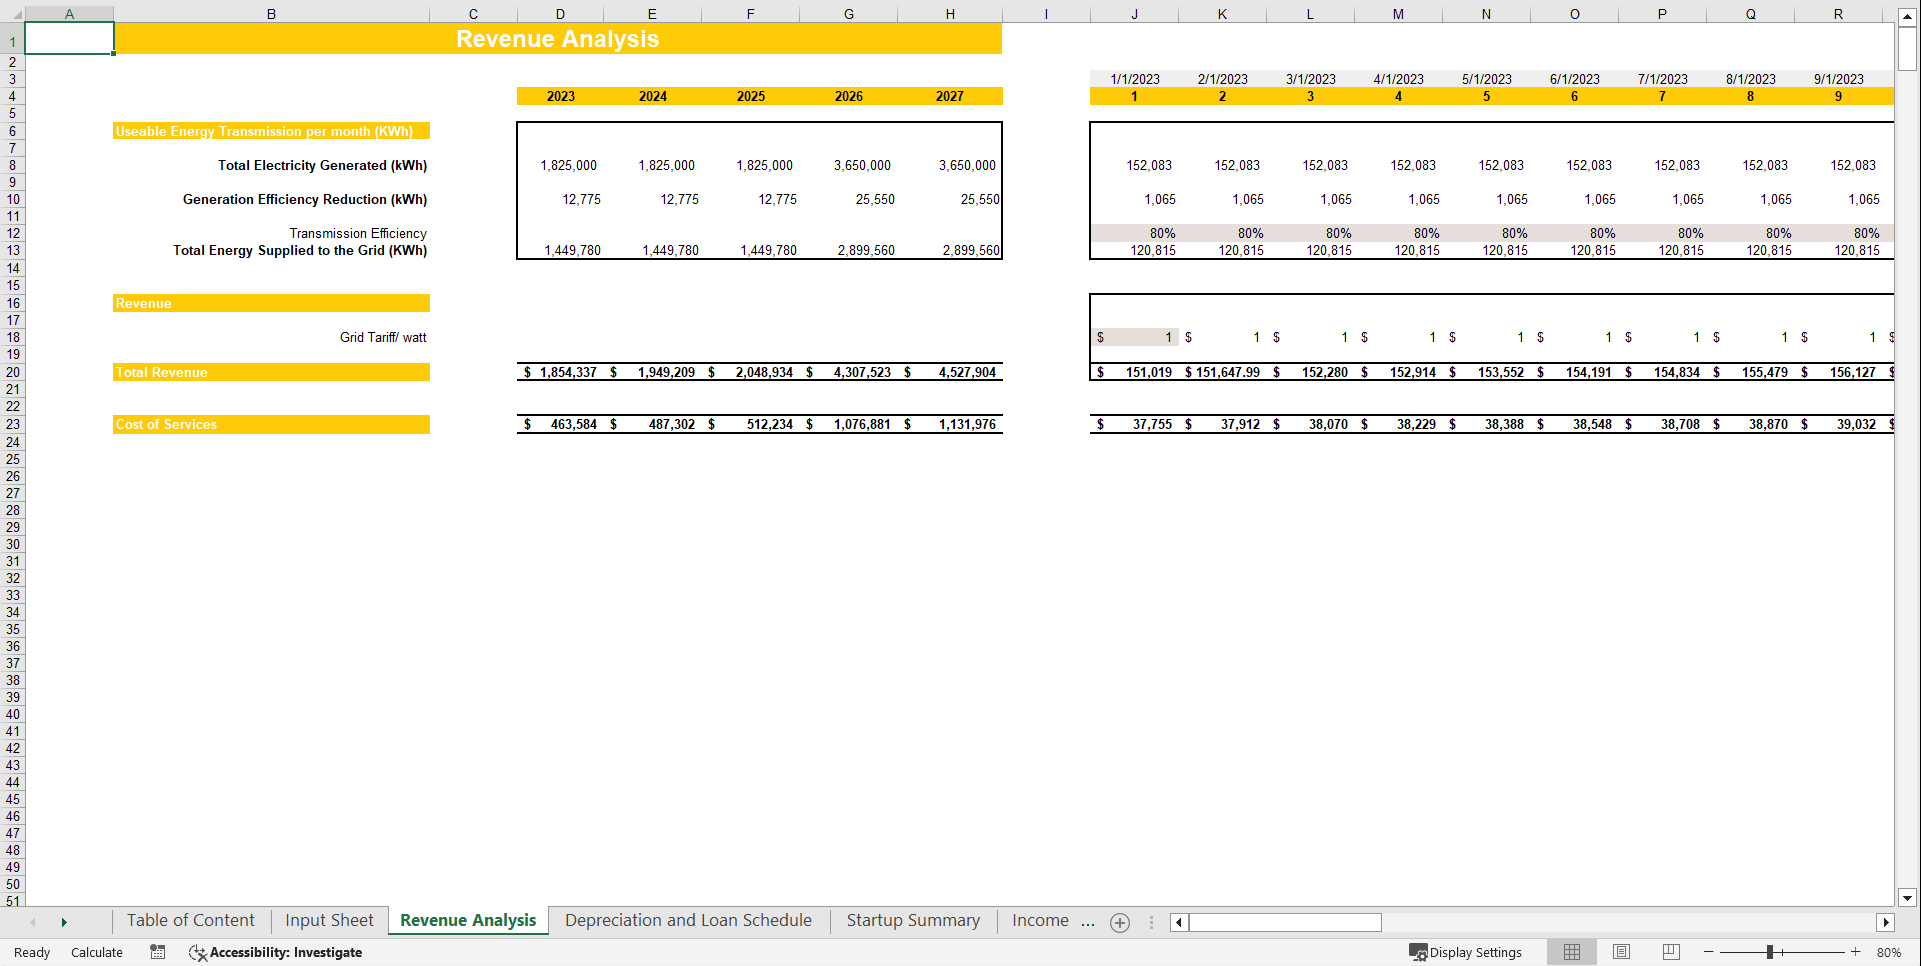
2. Revenue Analysis
The revenue analysis provides a detailed breakdown of the projected revenues from the solar power project. It considers factors such as energy output and tariffs. A robust revenue analysis is critical in understanding the project's earning potential and, thus, its viability.
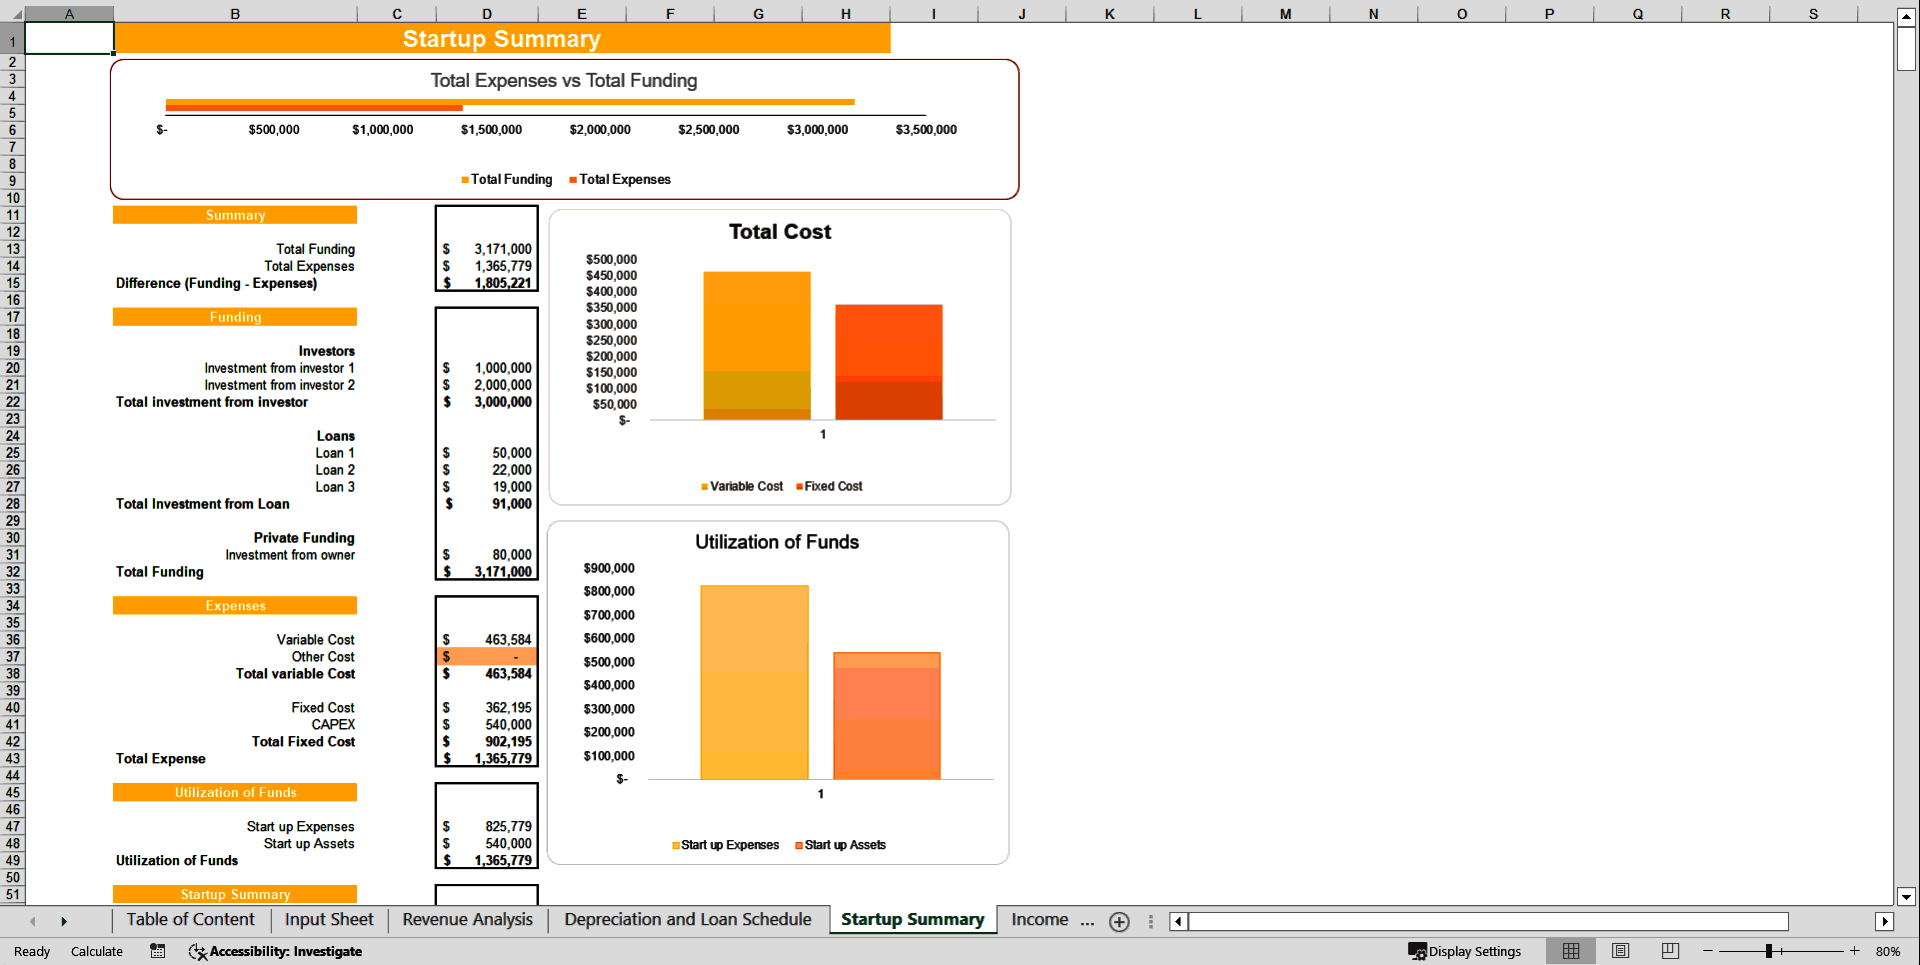
3. Startup Summary
The startup summary outlines all the initial costs associated with starting the solar power project. This includes land acquisition costs, construction, solar panels, and other necessary infrastructure. Understanding these costs is crucial in determining the initial funding requirements for the project.
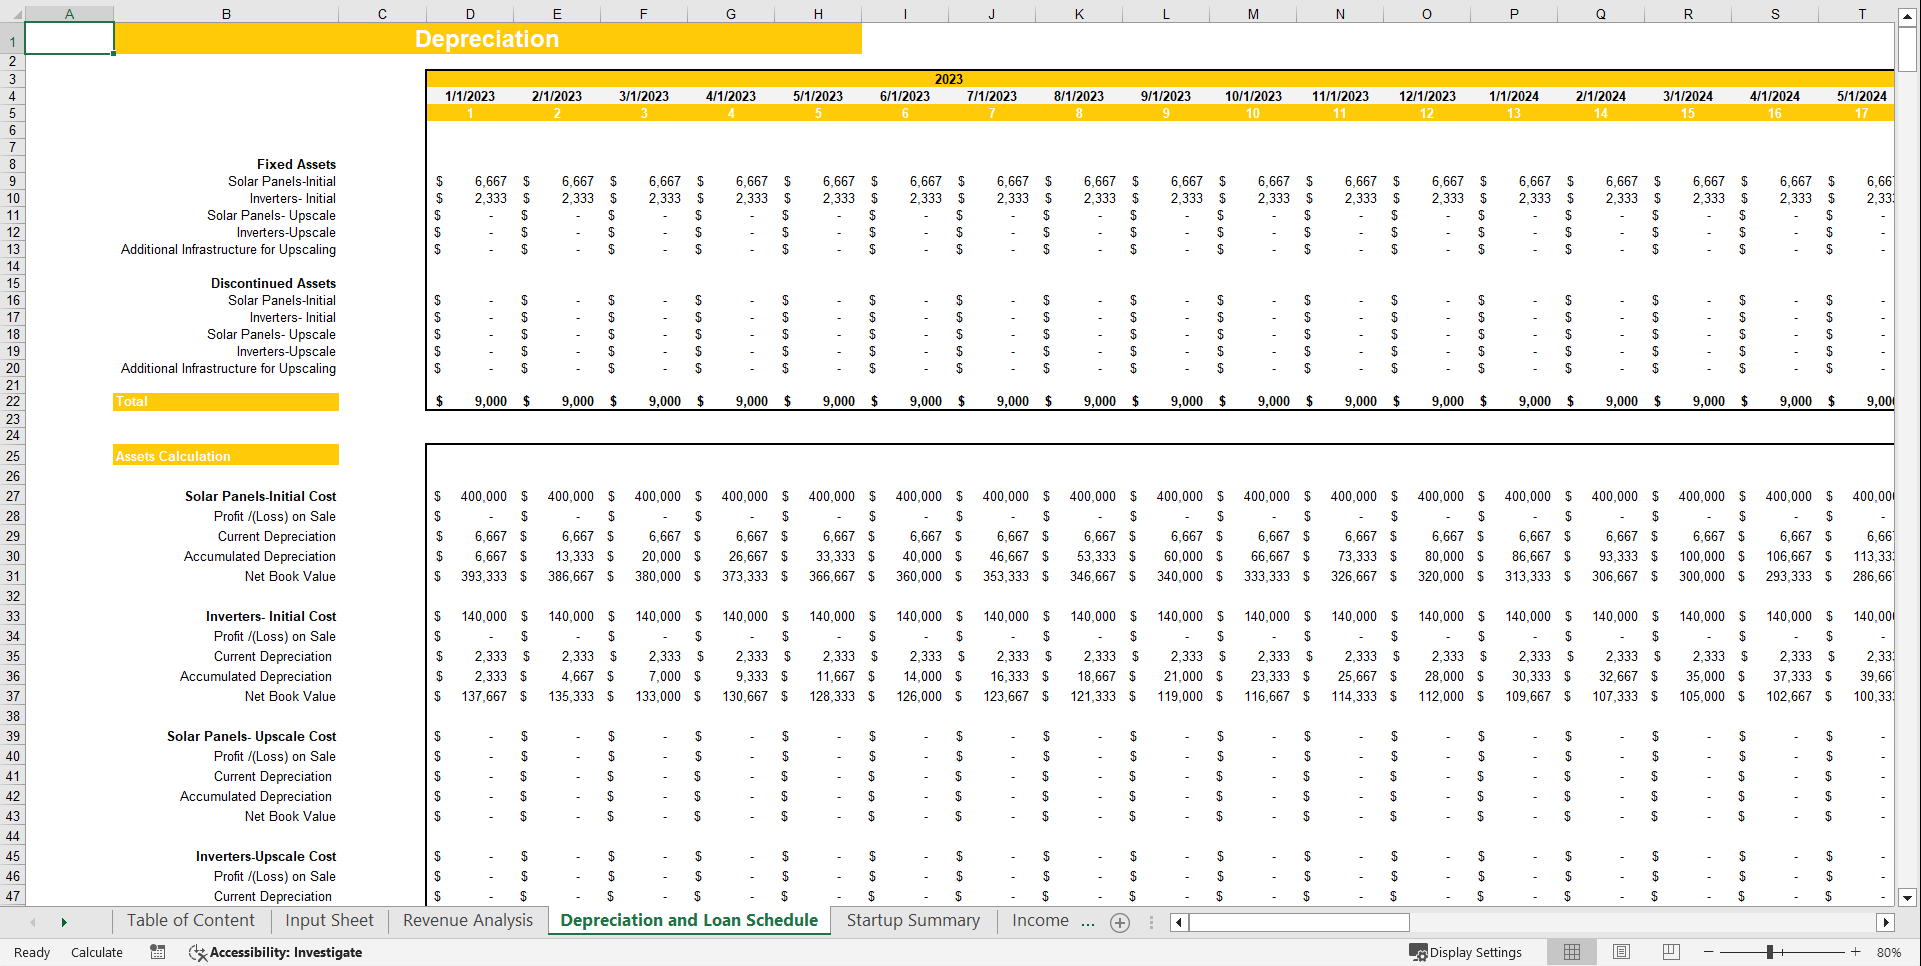
3. Depreciation and Loan Amortization Schedule
The depreciation schedule outlines how the project's assets lose value over time, while the loan amortization schedule provides details on how the project's loans will be paid off over time, considering both the principal and interest payments. Both these schedules are critical components in understanding the project's long-term financial obligations.
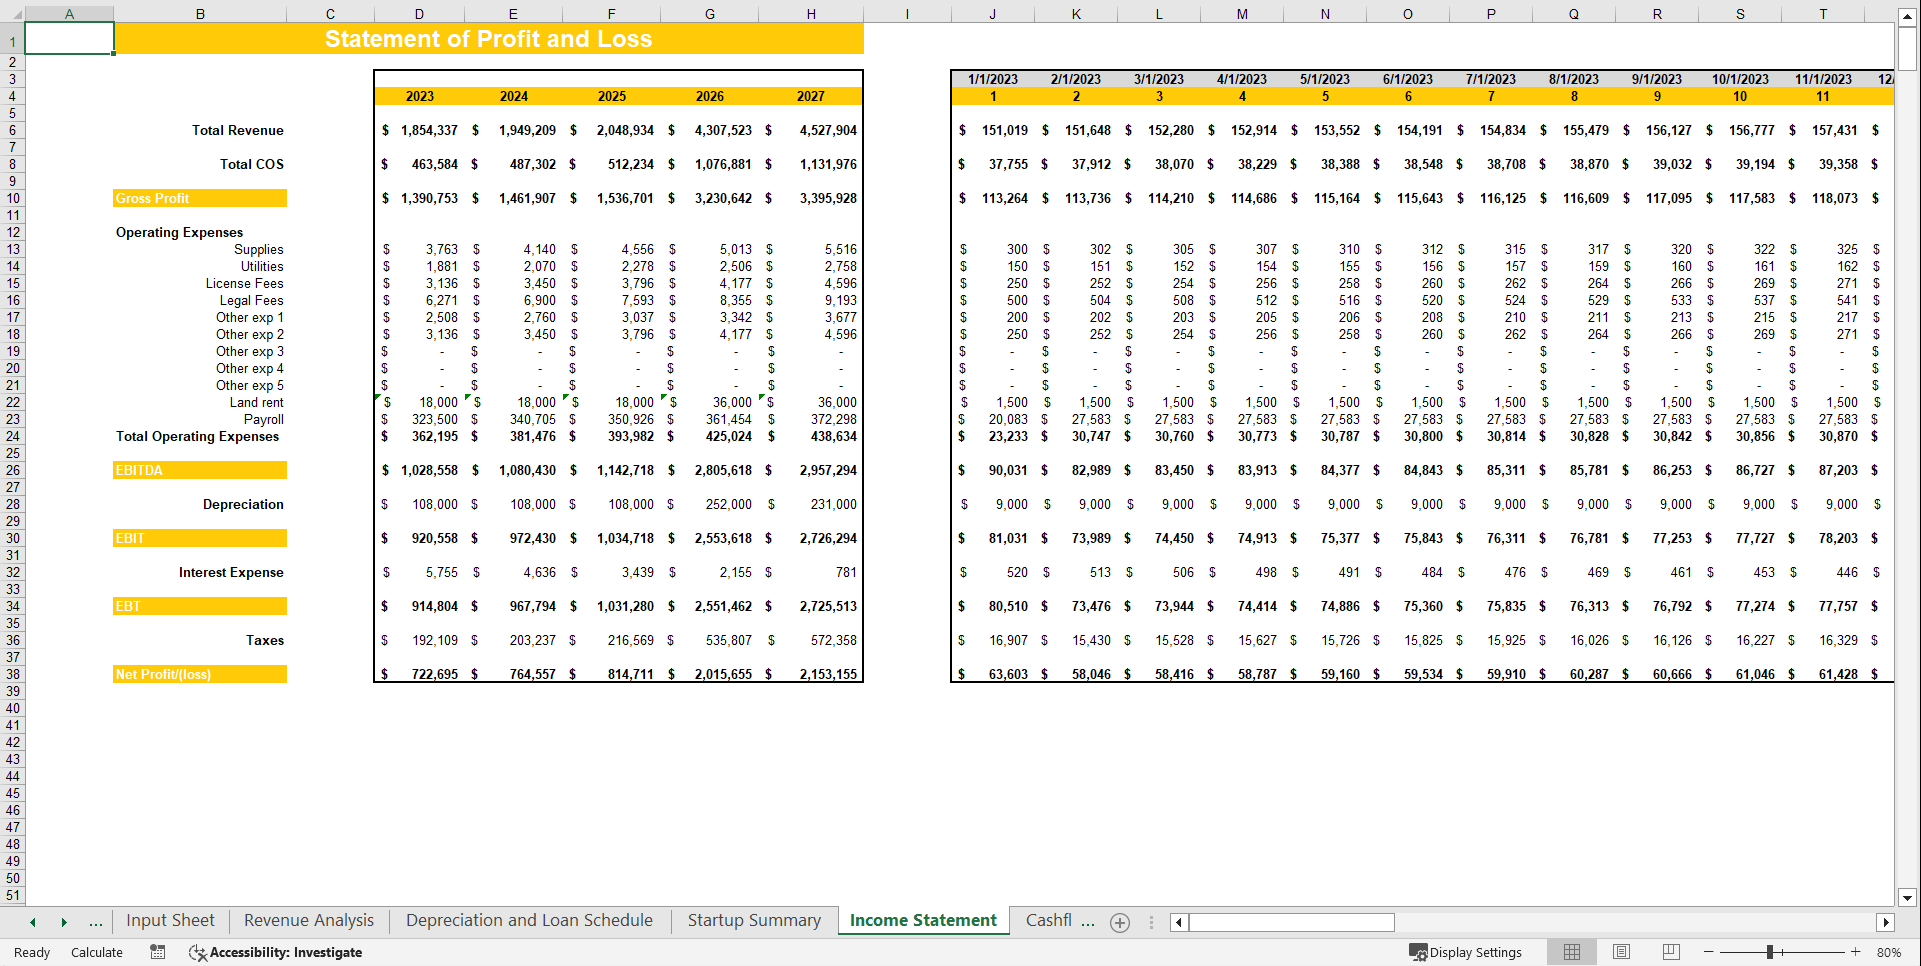
4. 5-year income statement projection
The 5-year income statement projection estimates the project's profitability over a five-year period. It includes projected revenues, operating costs, interest expenses, and taxes, ultimately leading to the net income. This statement is crucial for potential investors, providing insights into the project's earning potential.
5. 5-year balance sheet projection
The 5-year balance sheet projection provides a snapshot of the project's financial position over a five-year period. It includes assets, liabilities, and equity. This statement helps investors understand the project's financial health, which is vital in assessing its creditworthiness.
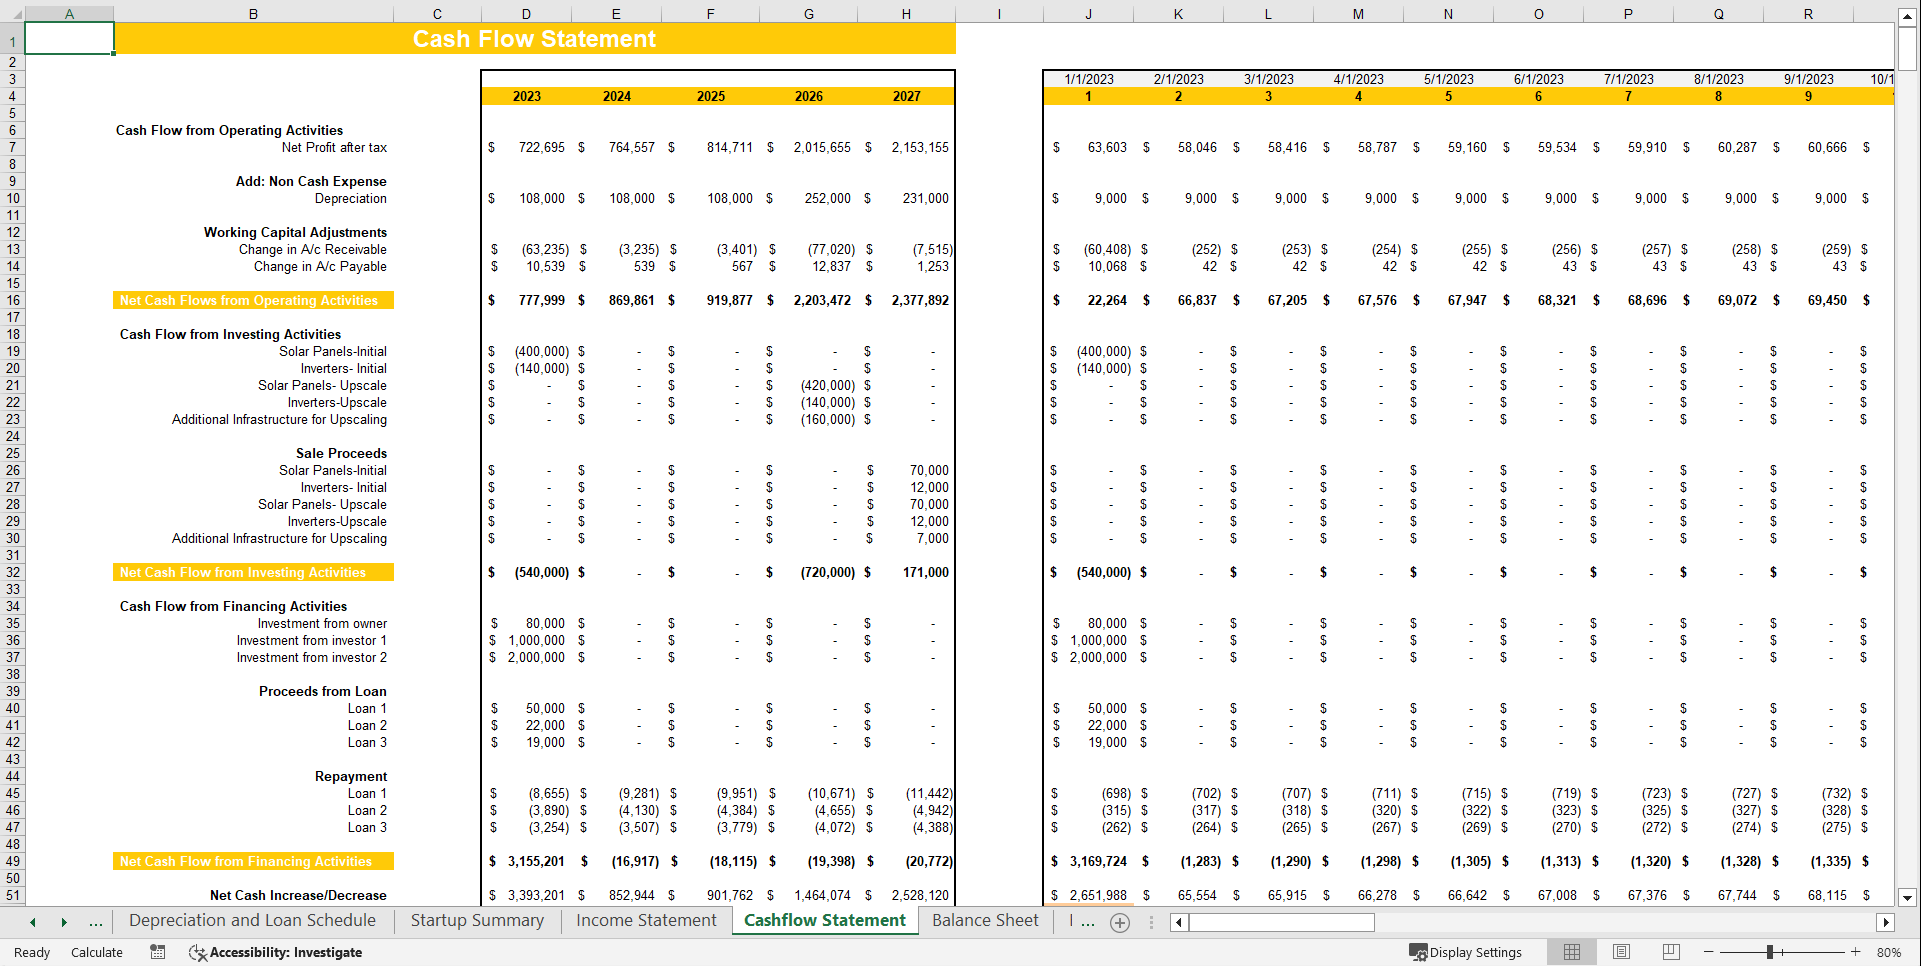
6. 5-year cashflow statement projection
The 5-year cash flow statement projection reveals the project's cash inflows and outflows over a five-year period. By highlighting net cash from operating, investing, and financing activities, gives investors an idea of the project's liquidity and solvency.
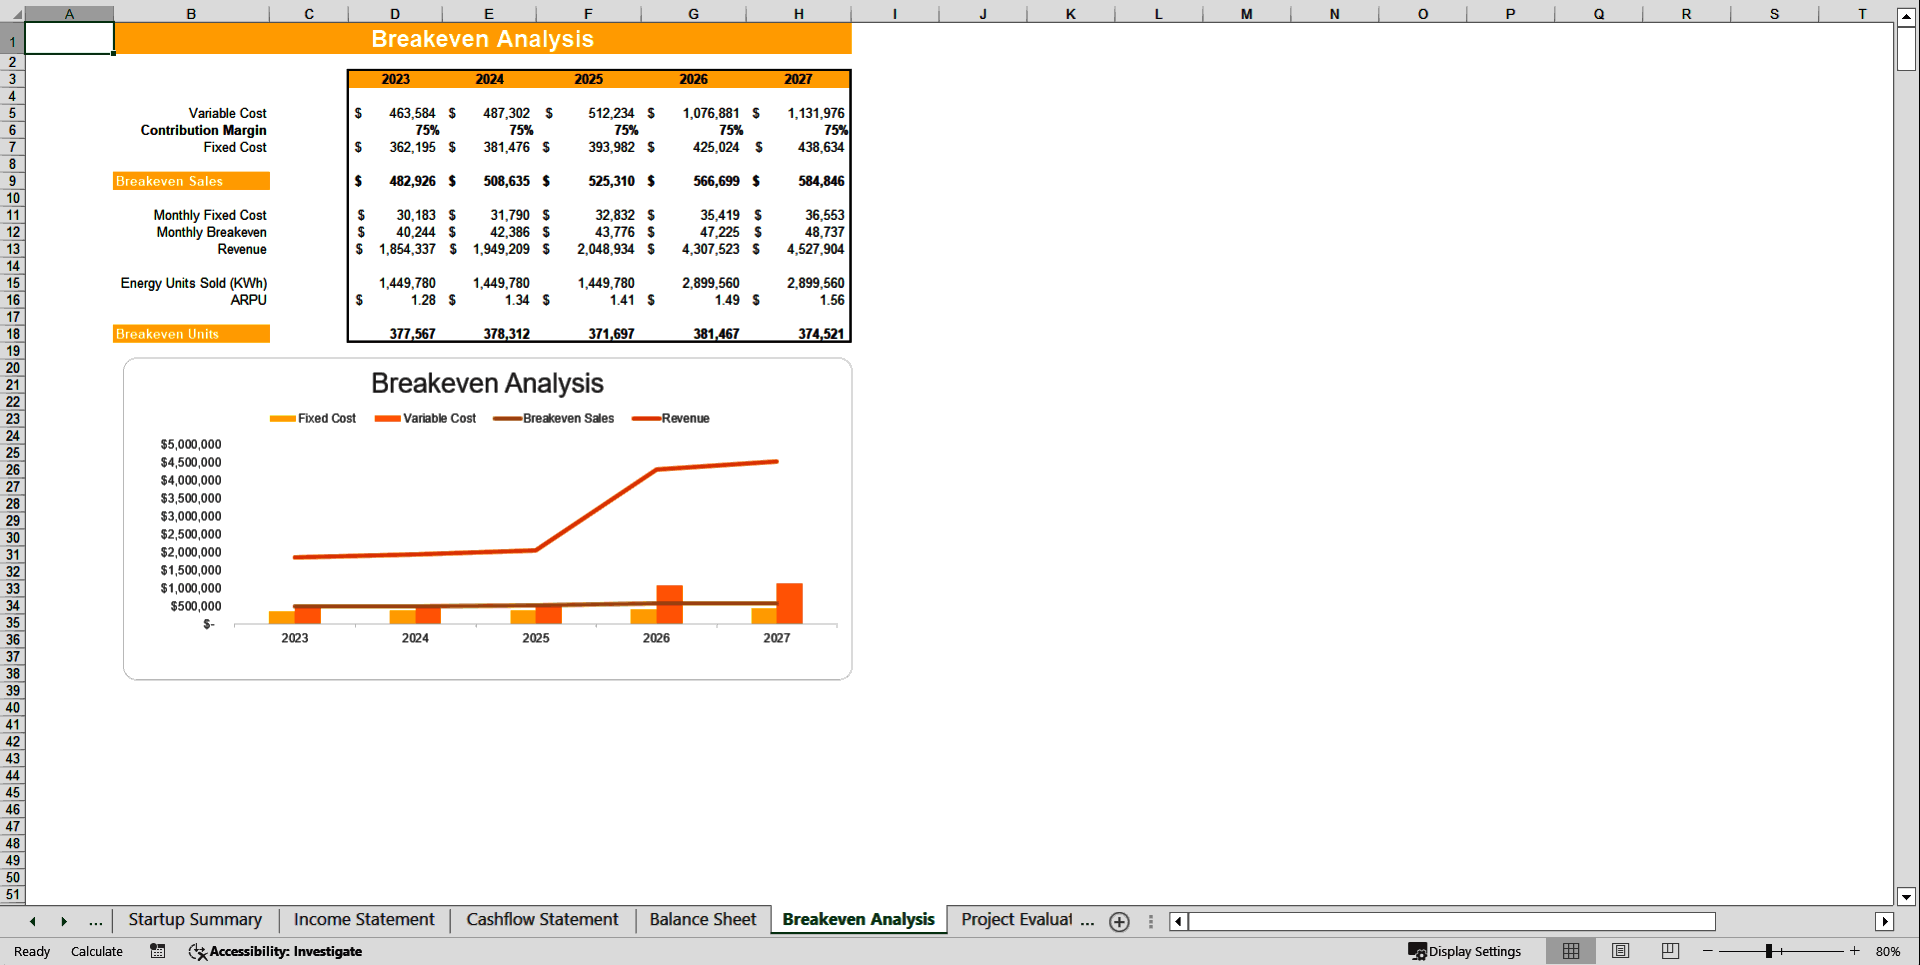
7. Breakeven Analysis
The breakeven analysis identifies when the project is expected to start generating profits, i.e., when the total revenue equals total costs. This analysis is crucial as it gives investors an indication of the project's risk and the time required to start earning returns on their investment.
8. Project Evaluation
Project evaluation involves assessing the project's financial feasibility and profitability. This can involve computing financial metrics like NPV, IRR and payback period. This step is paramount as it allows investors to gauge the expected return and potential risks involved in the project.
9. Sensitivity Analysis
Sensitivity analysis is an approach to predicting the outcome of a decision if a set of variables is varied. For a solar power project, sensitivity analysis could involve varying key assumptions, like the energy units sold. This analysis helps investors understand the impact of changes in key assumptions on the project's profitability.
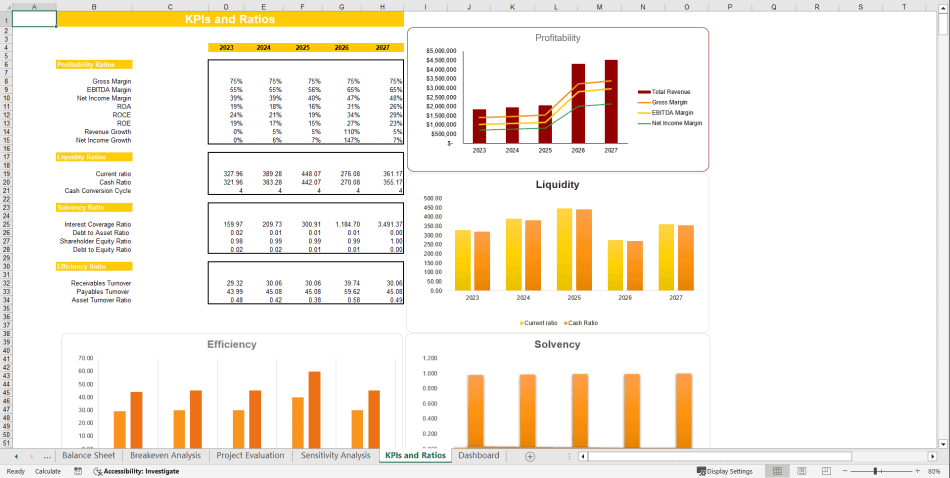
10. KPIs and Financial Ratios
Key performance indicators (KPIs) and financial ratios are used to track the performance of the solar power project. These could include metrics like return on investment (ROI), debt service coverage ratio (DSCR), and Asset turnover ratio. These ratios provide investors with a quick snapshot of the project's financial health and efficiency.
11. Dashboard
The dashboard consolidates all the key components of the financial model, providing a quick and easy-to-understand overview of the project's financial projections. It typically includes key figures and graphs to visualize the project's performance over time.
Got a question about the product? Email us at support@flevy.com or ask the author directly by using the "Ask the Author a Question" form. If you cannot view the preview above this document description, go here to view the large preview instead.
Source: Best Practices in Solar Energy, Integrated Financial Model Excel: Solar Power Project Financial Model Template Excel (XLSX) Spreadsheet, Oak Business Consultant
