
 Click main image to view in full screen. Unlock all 20 preview images:
Seafood Restaurant Profitability & 5-Year Financial Model – Excel XLSX
Excel (XLSX) + supplemental PDF


BENEFITS OF THIS DOWNLOADABLE EXCEL DOCUMENT
- Connect species-level seafood purchase cost, edible yield, recipe costing and menu engineering to five-year restaurant profitability.
- Stress-test traffic, menu price, seafood cost, yield and labor using three operating scenarios and three two-way EBITDA-margin sensitivities.
- Integrate monthly operations with three financial statements, cash, debt, break-even analysis, DCF valuation and decision dashboards.
RESTAURANT INDUSTRY EXCEL DESCRIPTION
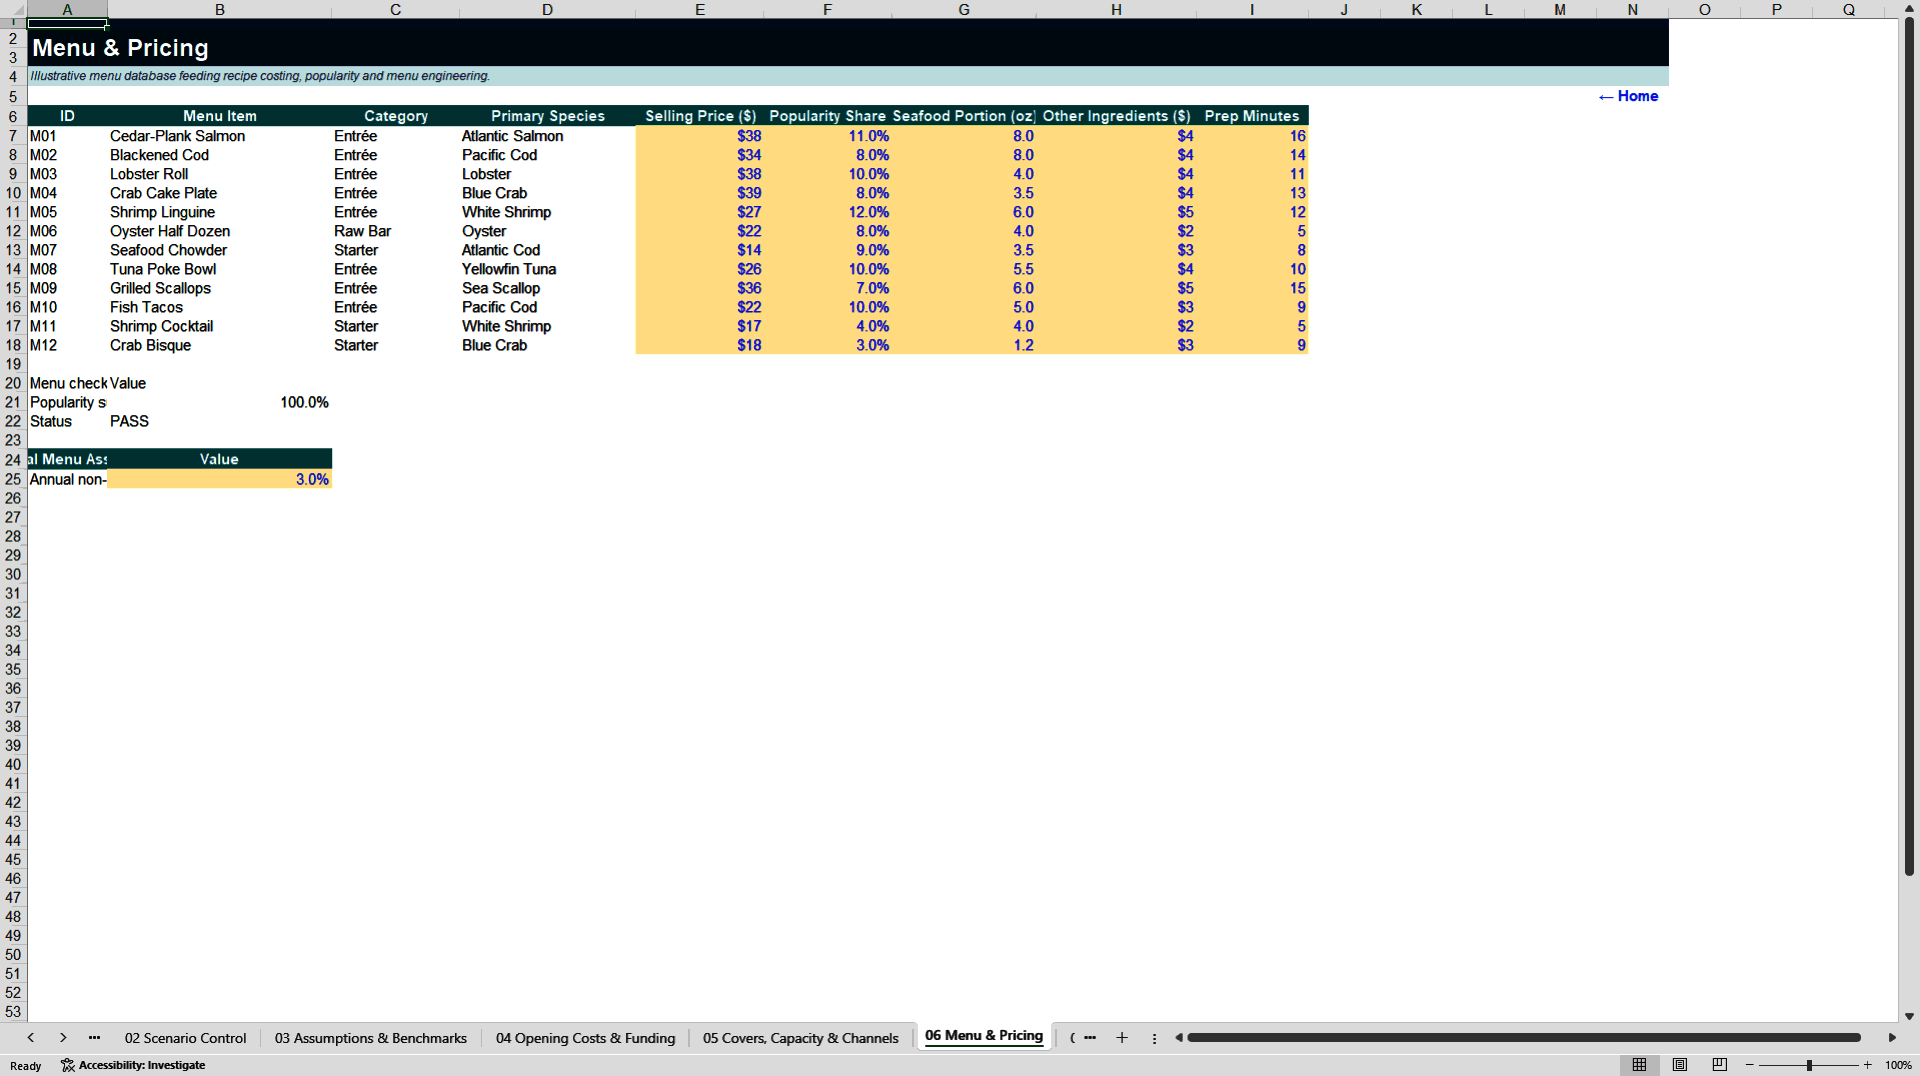
This premium Excel model is built for seafood restaurant founders, owners, operators, consultants, lenders and investors who need a connected view of menu economics, operations and five-year financial performance. It goes beyond a generic restaurant projection by converting seafood purchase prices into usable edible cost and then linking that cost to recipe margins, menu popularity, waste, capacity, labor, working capital, financing and valuation.
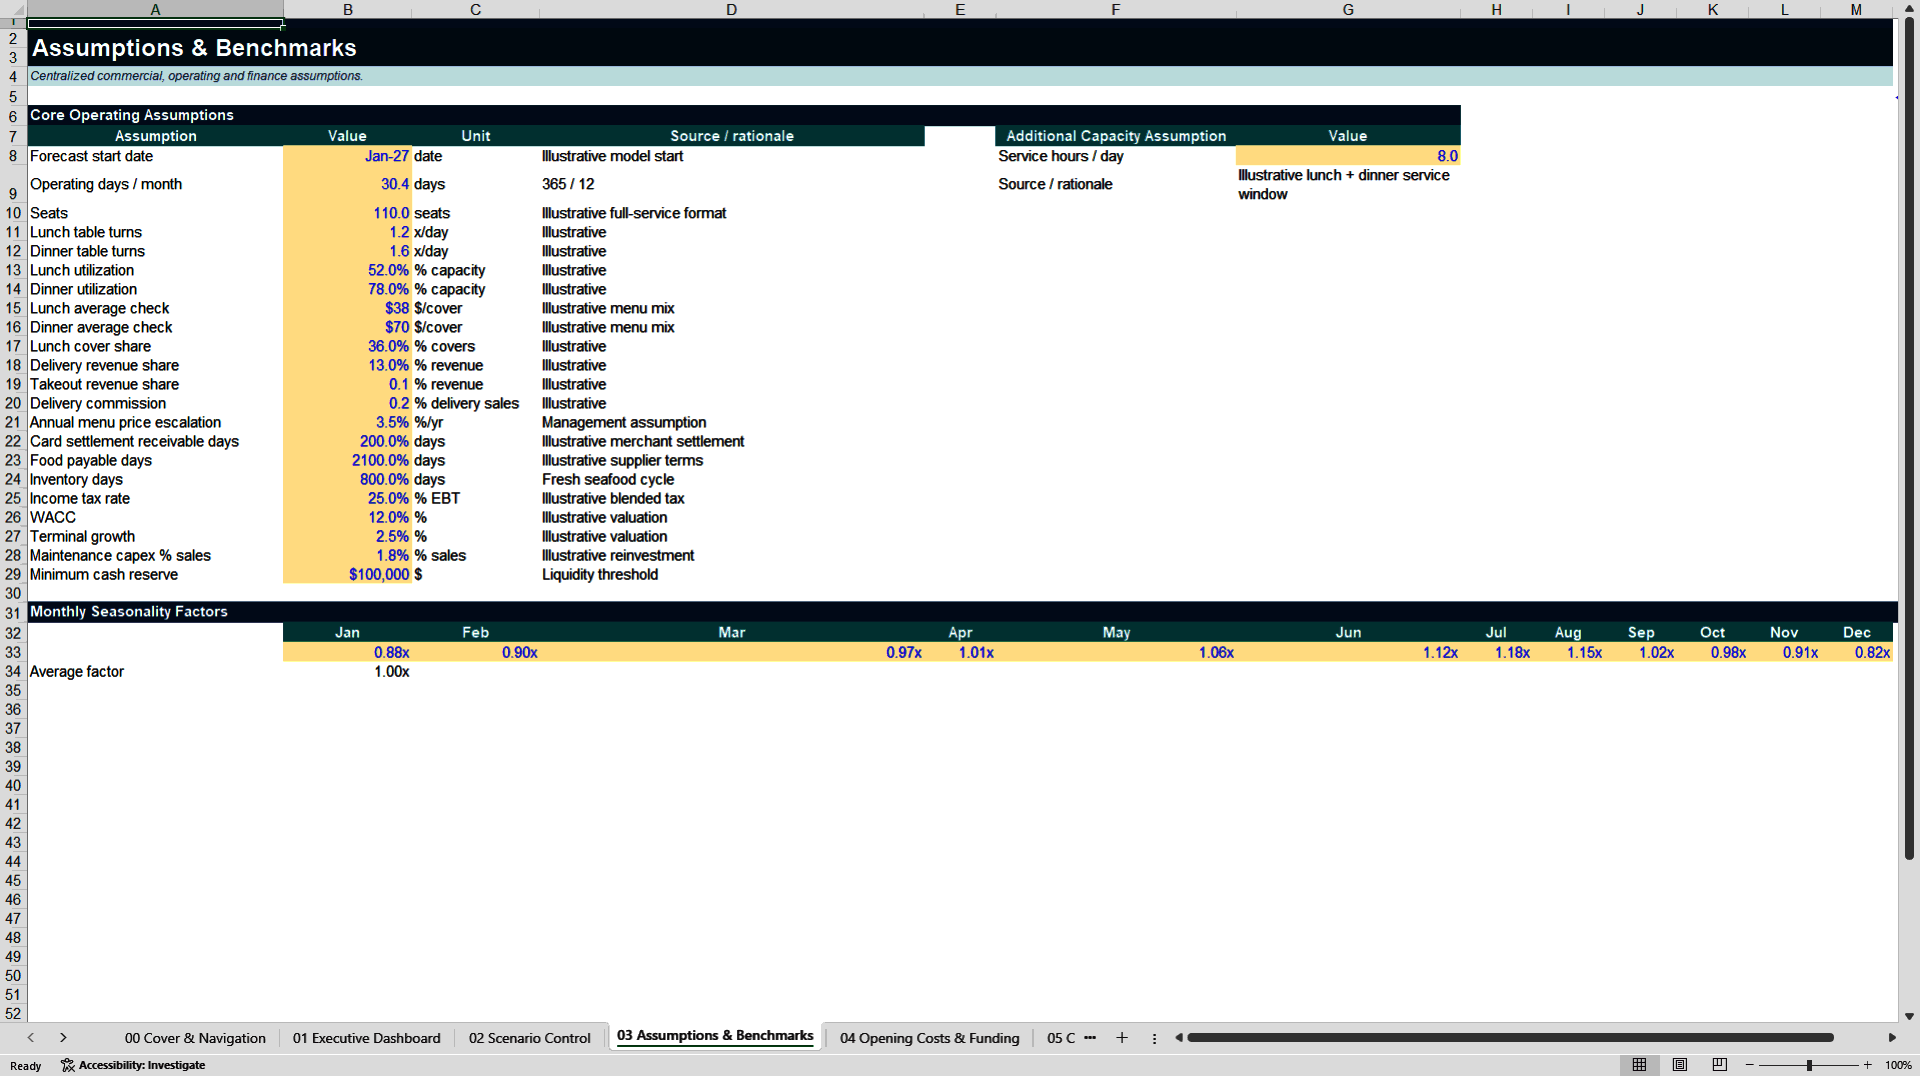
The workbook begins with a centralized scenario and assumptions structure. A single Downside, Base or Upside selection changes traffic, average check, seafood price pressure, usable yield, labor and waste. Capacity is modeled from seats, table turns, utilization, service periods and operating days, while dine-in, takeout and delivery mix feed channel revenue and variable fees. A 60-month forecast integrates these operating drivers with food cost, labor, operating expenses, working capital, debt service and cash.
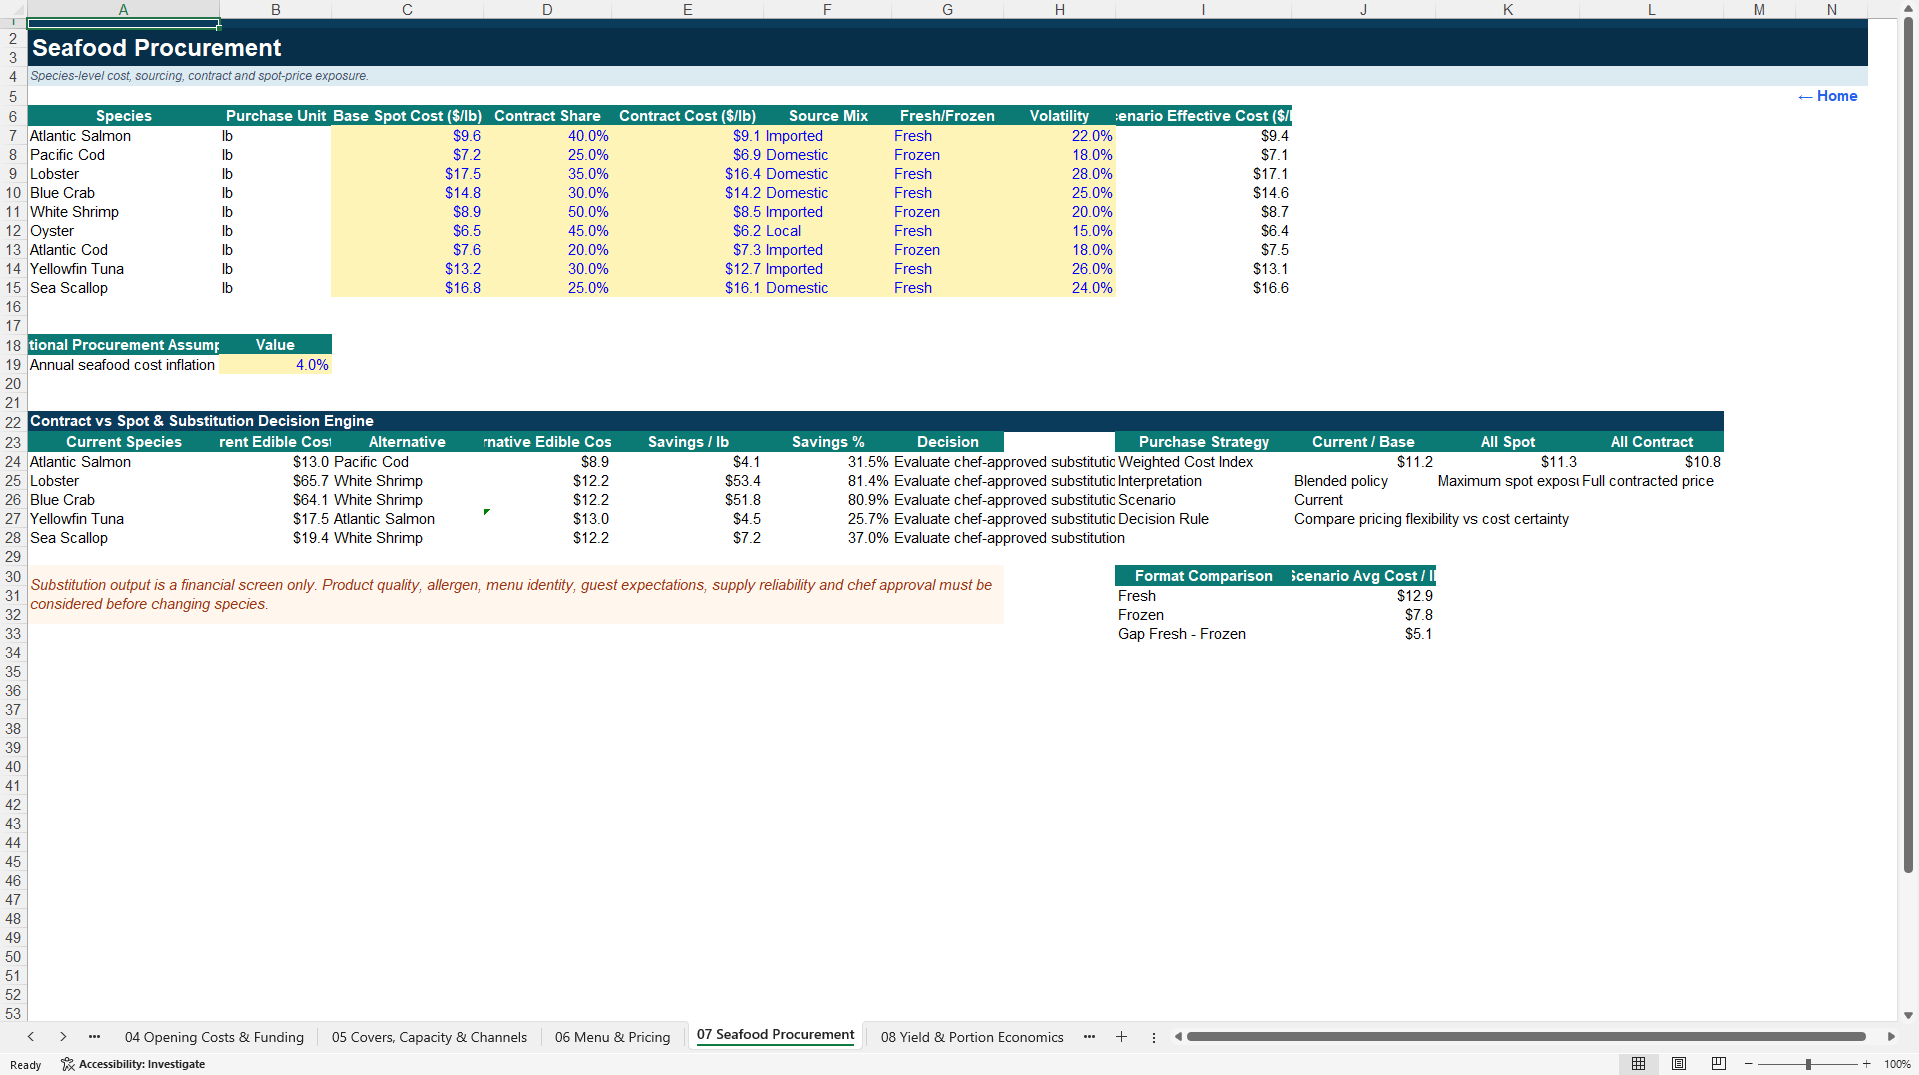
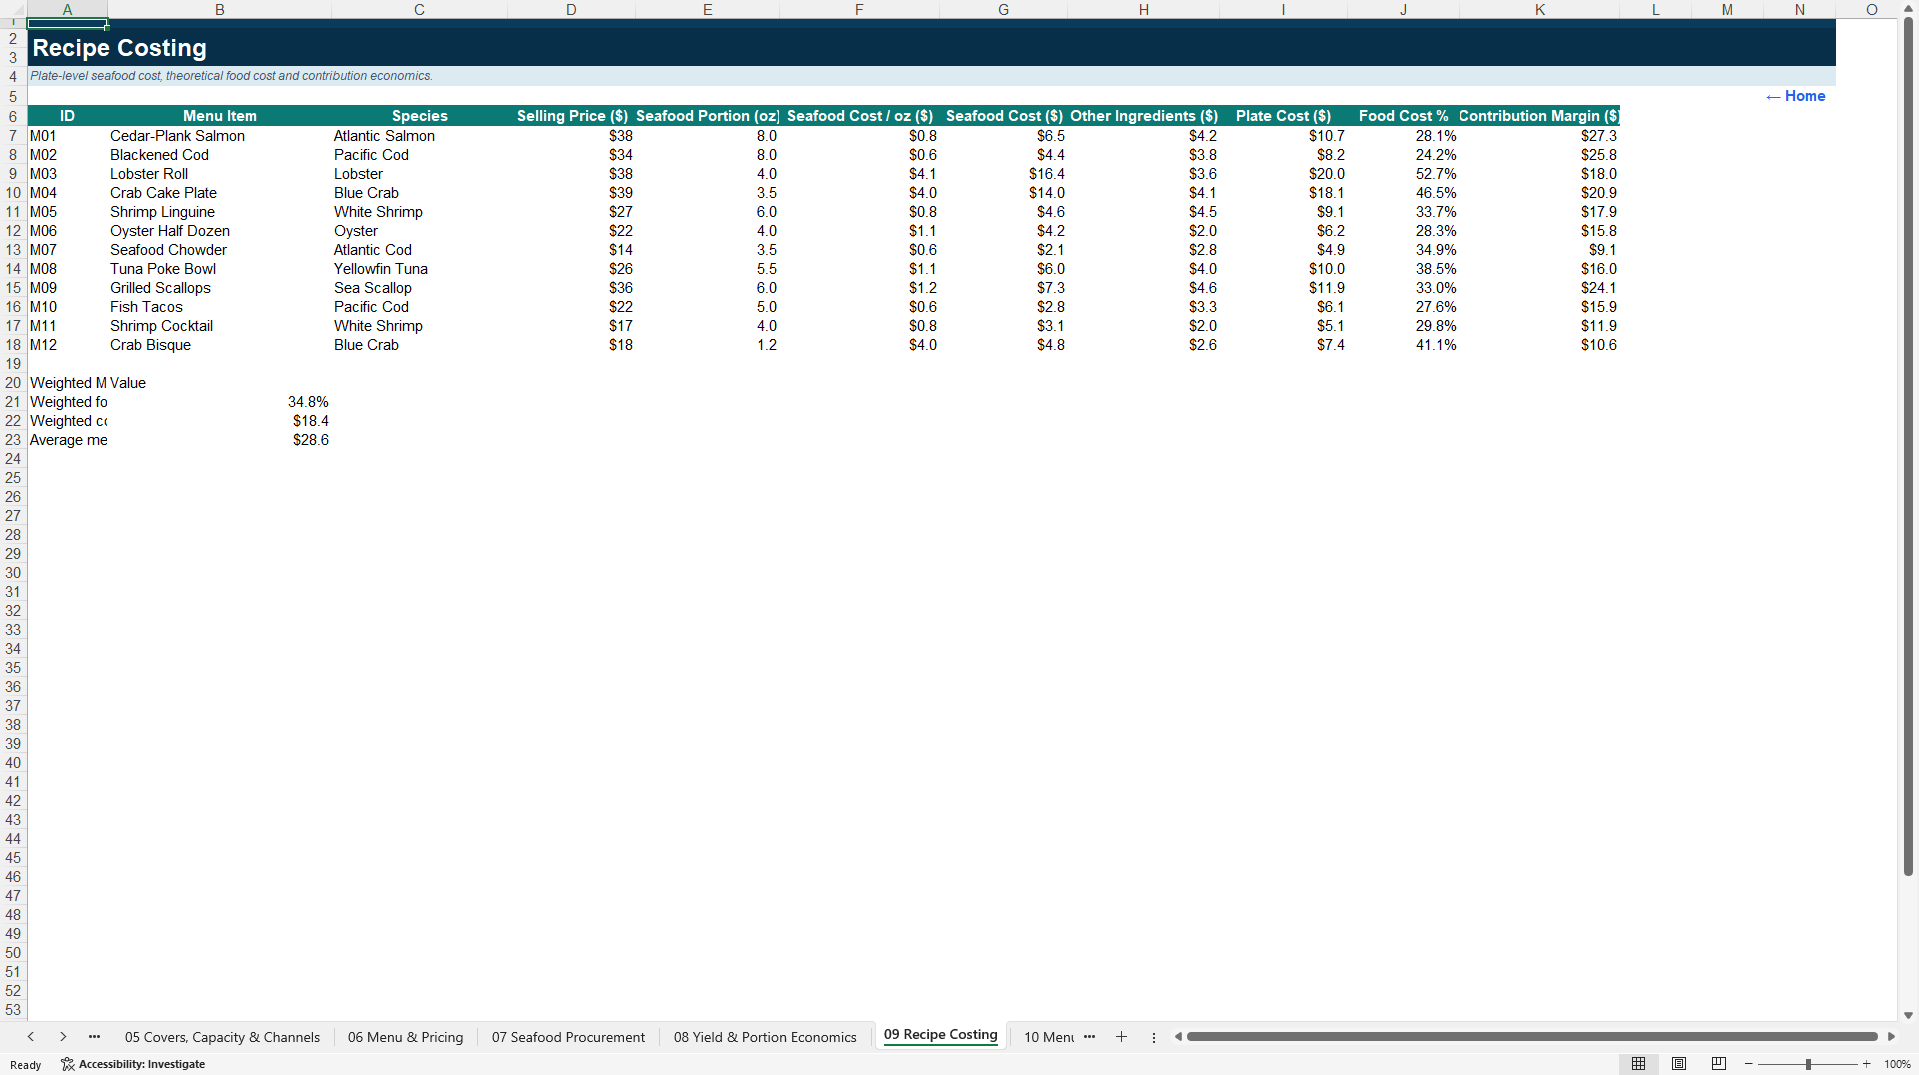
Seafood-specific schedules provide the main analytical depth. The procurement sheet tracks species-level spot cost, contract share, contract price, source mix, fresh/frozen status and volatility. Yield analysis converts purchase cost through trim or shell yield, preparation yield and cooking yield to final edible cost per pound and per ounce. Recipe costing then connects each menu item's selling price, seafood portion and other ingredients to plate cost, food-cost percentage and contribution margin.
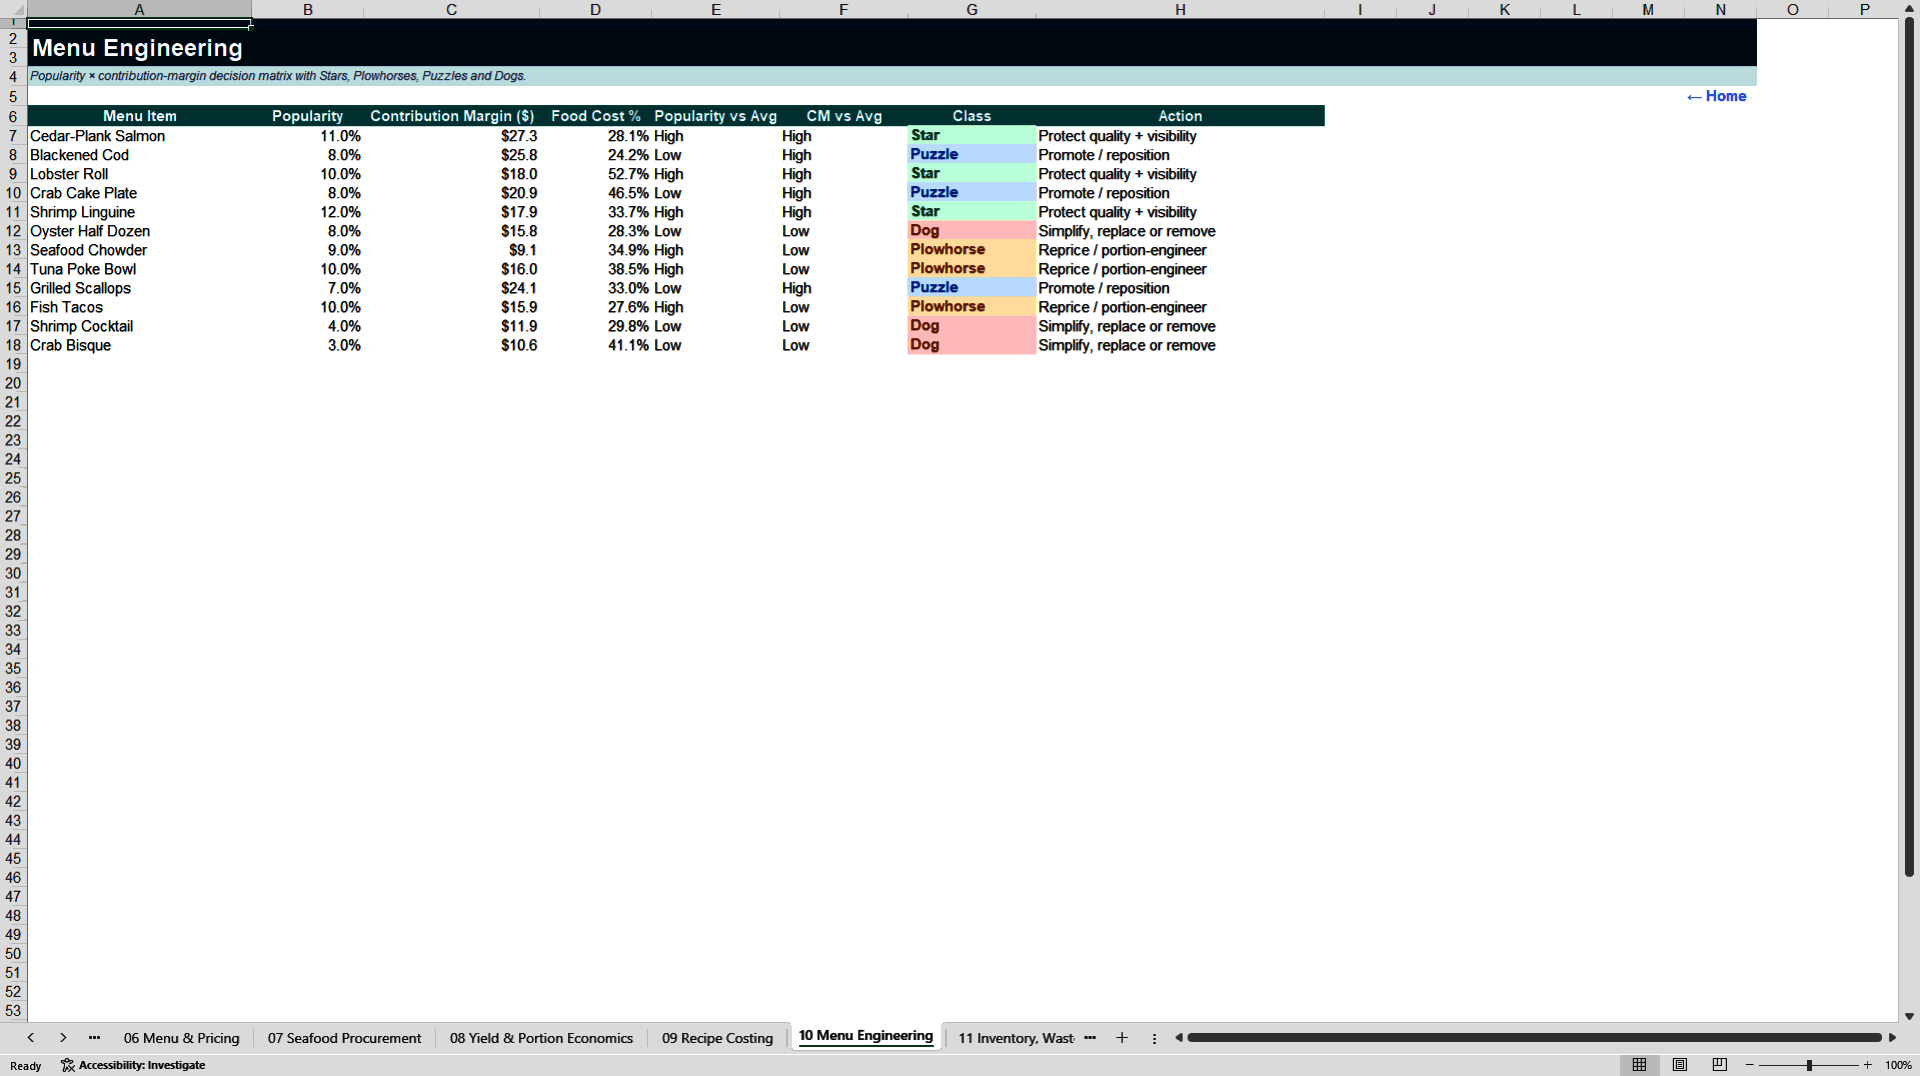
Menu engineering combines popularity and contribution margin to classify items as Stars, Plowhorses, Puzzles or Dogs. Waste and spoilage analysis identifies leakage from seafood spoilage, trim variance, comps or remakes and other food waste. Supplier analysis adds allocation, origin, payment terms, readiness, reliability and price index, while the traceability schedule separates implementation and recurring readiness costs.
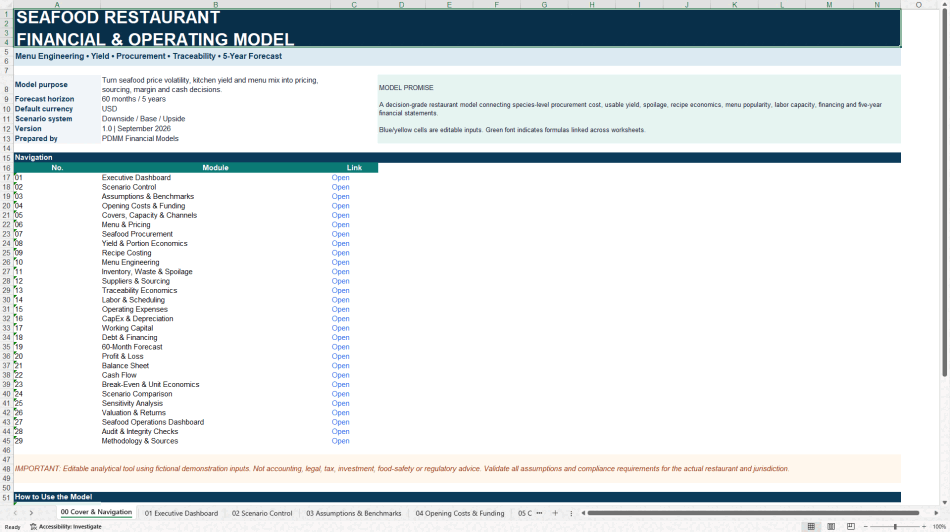
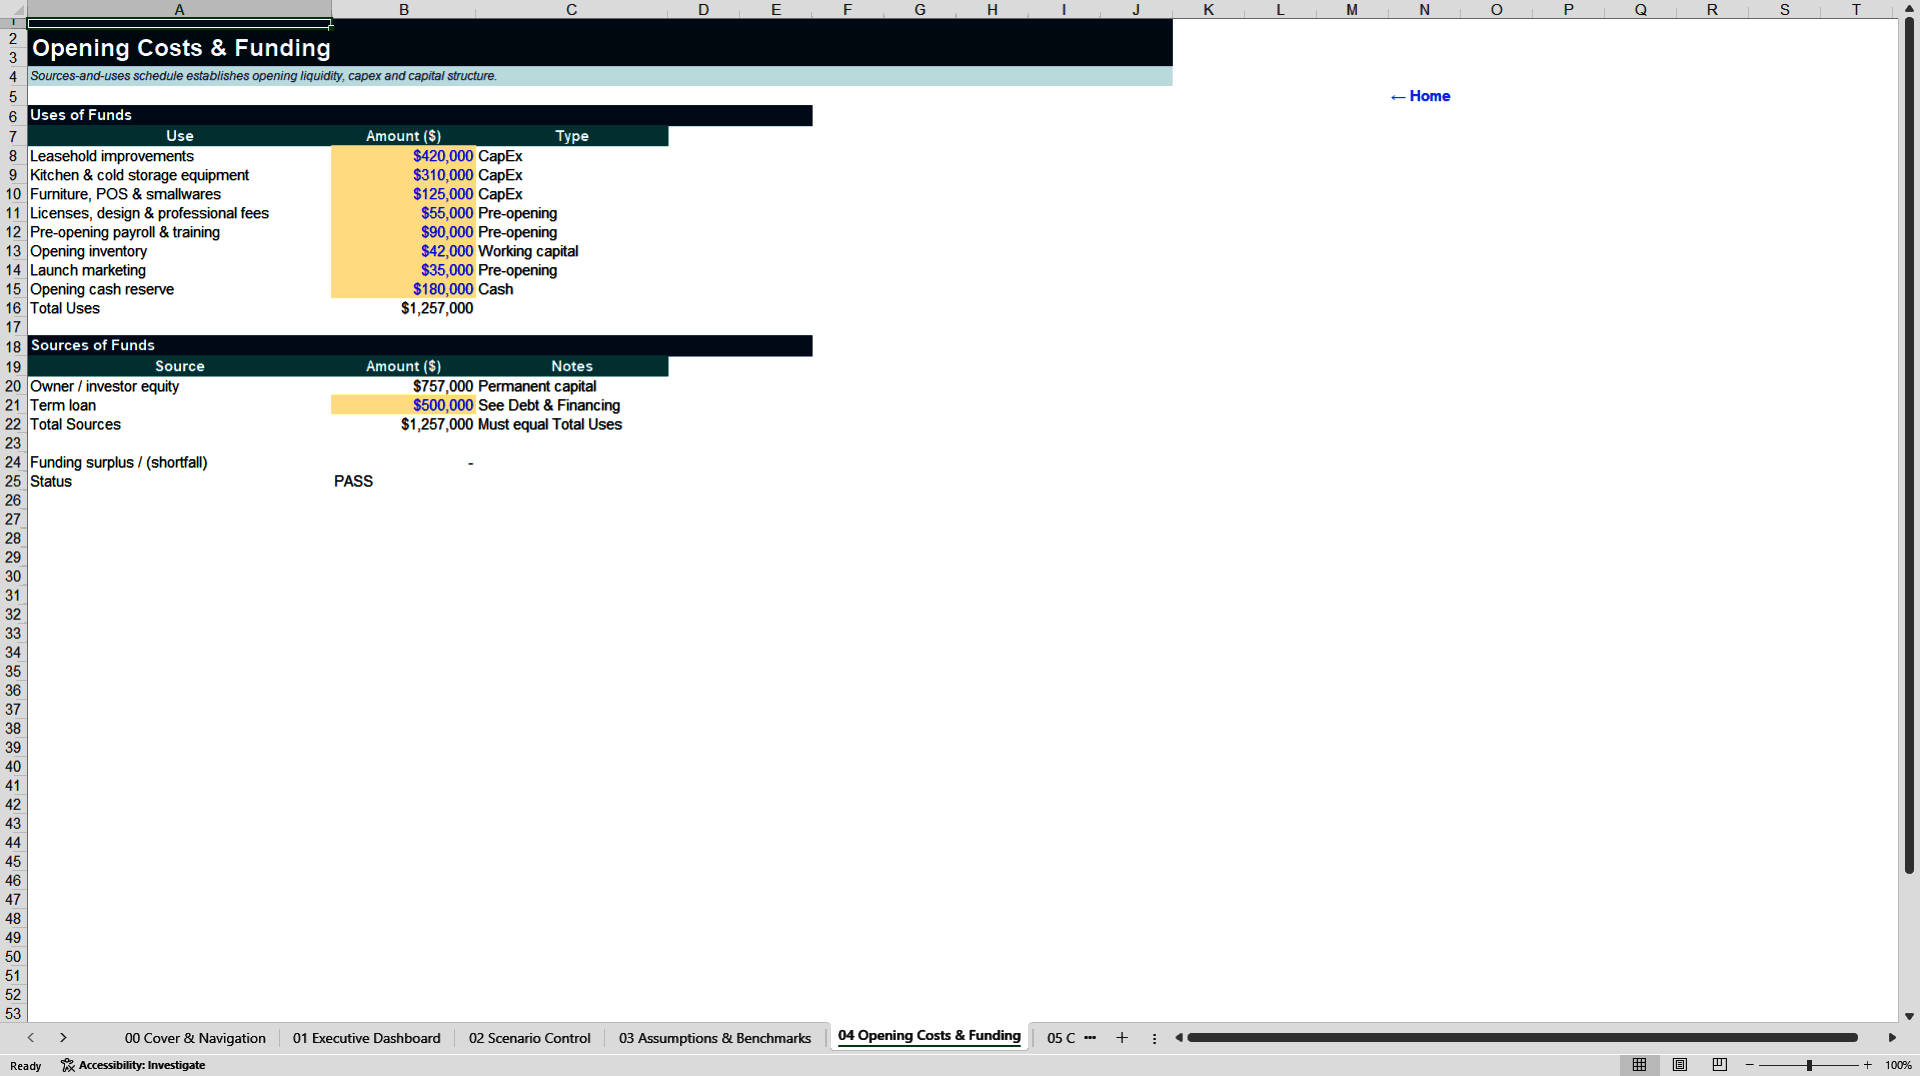
The financial model includes opening sources and uses, labor scheduling, operating expenses, CapEx and depreciation, working capital, a term-loan amortization schedule, five annual Profit and Loss statements, Balance Sheets and Cash Flow statements, break-even and unit economics, scenario comparison, three two-way EBITDA-margin sensitivity tables, DCF valuation and investor return outputs.
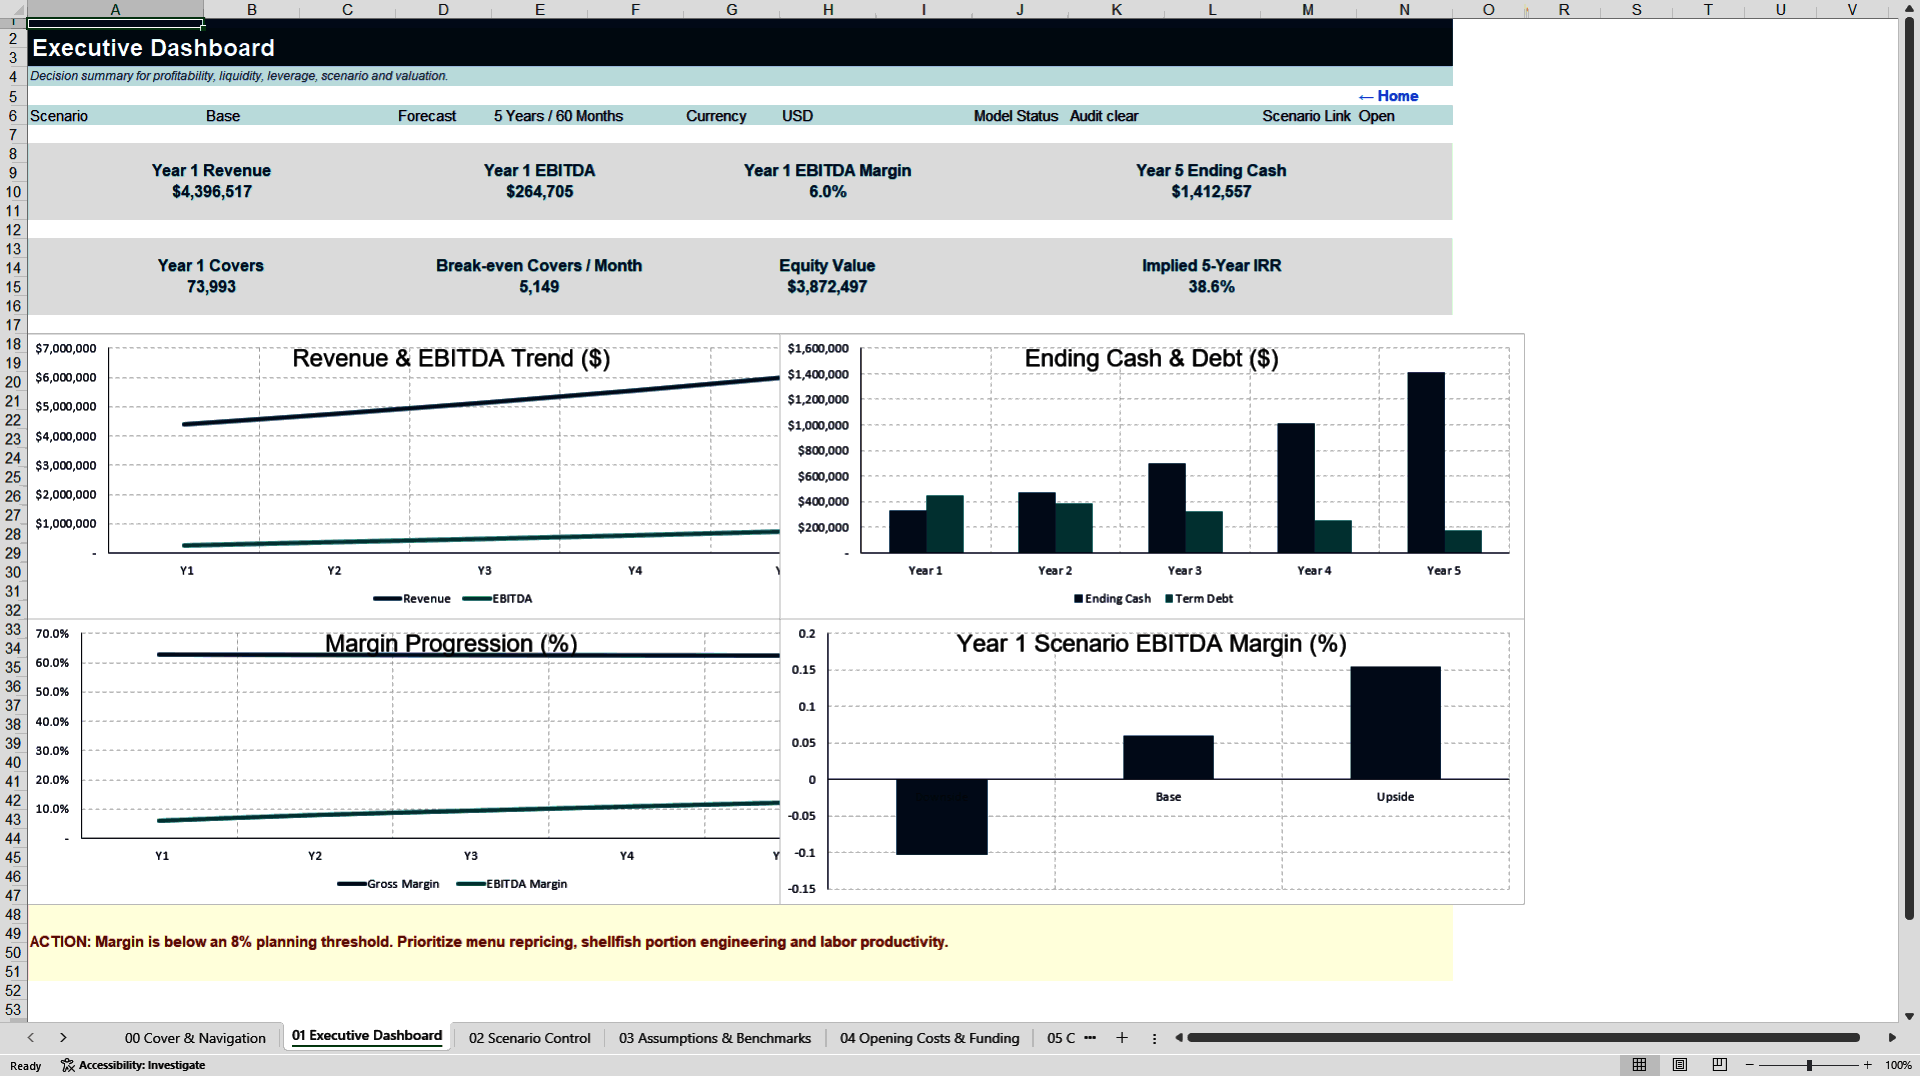
Two dashboards make the model decision-ready. The Executive Dashboard presents revenue, EBITDA, margin, ending cash, break-even covers, equity value and implied return together with four native Excel charts. The Seafood Operations Dashboard focuses on weighted food cost, leakage, utilization, supplier concentration, menu pricing, contribution margin, break-even covers and menu engineering, supported by four additional decision charts. A separate food-cost leakage chart brings the workbook to nine native charts in total.
The workbook also contains 40 formula-driven audit and integrity checks covering balance, roll-forwards, bounds, scenario consistency and liquidity. Sample inputs are populated so users can see the model working immediately and then replace assumptions with restaurant-specific information.
This document is especially useful for business planning, budgeting, menu repricing, sourcing strategy, cost-control initiatives, turnaround analysis, financing discussions, expansion review and valuation work. It gives a user one integrated place to test whether a seafood restaurant can translate traffic and menu demand into durable margins and cash flow while managing the operating risks that are most specific to seafood.
Got a question about the product? Email us at support@flevy.com or ask the author directly by using the "Ask the Author a Question" form. If you cannot view the preview above this document description, go here to view the large preview instead.
Source: Best Practices in Restaurant Industry, Integrated Financial Model Excel: Seafood Restaurant Profitability & 5-Year Financial Model Excel (XLSX) Spreadsheet, PDMM Financial Models
ABOUT THE AUTHOR

PDMM Financial Models develops professional, decision-ready Excel models for business owners, entrepreneurs, investors, consultants, analysts, and finance teams. Our objective is to transform complex business assumptions into clear, structured analysis that supports better planning and investment decisions.
Our models cover business planning, forecasting, budgeting, feasibility analysis,
... [read more]
Ask the Author a Question
You must be logged in to contact the author.




























