
 Click main image to view in full screen. Unlock all 11 preview images:
Renewable Development Pipeline Acquisition Model – Excel XLSX
Excel (XLSX) + supplemental PDF


BENEFITS OF THIS DOWNLOADABLE EXCEL DOCUMENT
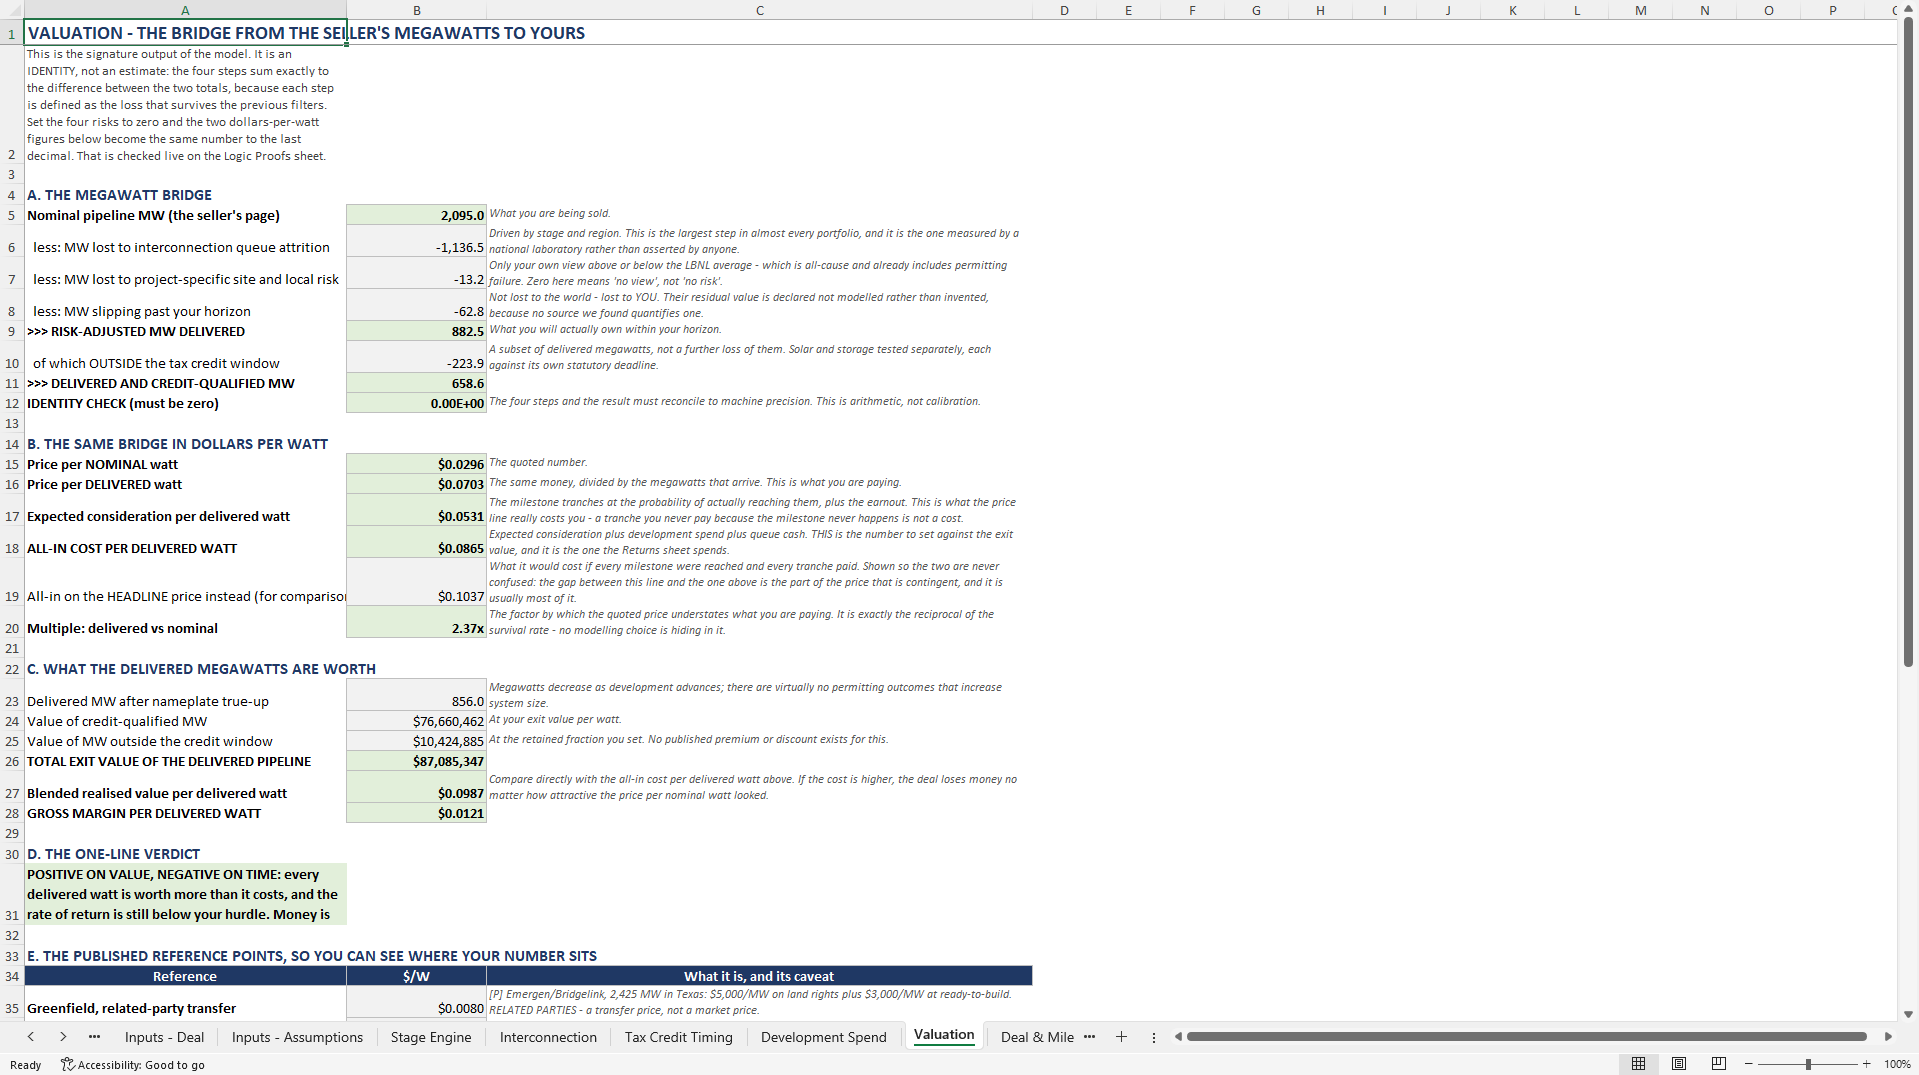
- Turn a seller nameplate megawatt count into risk-adjusted delivered megawatts, with the four causes of the gap itemised and summing exactly.
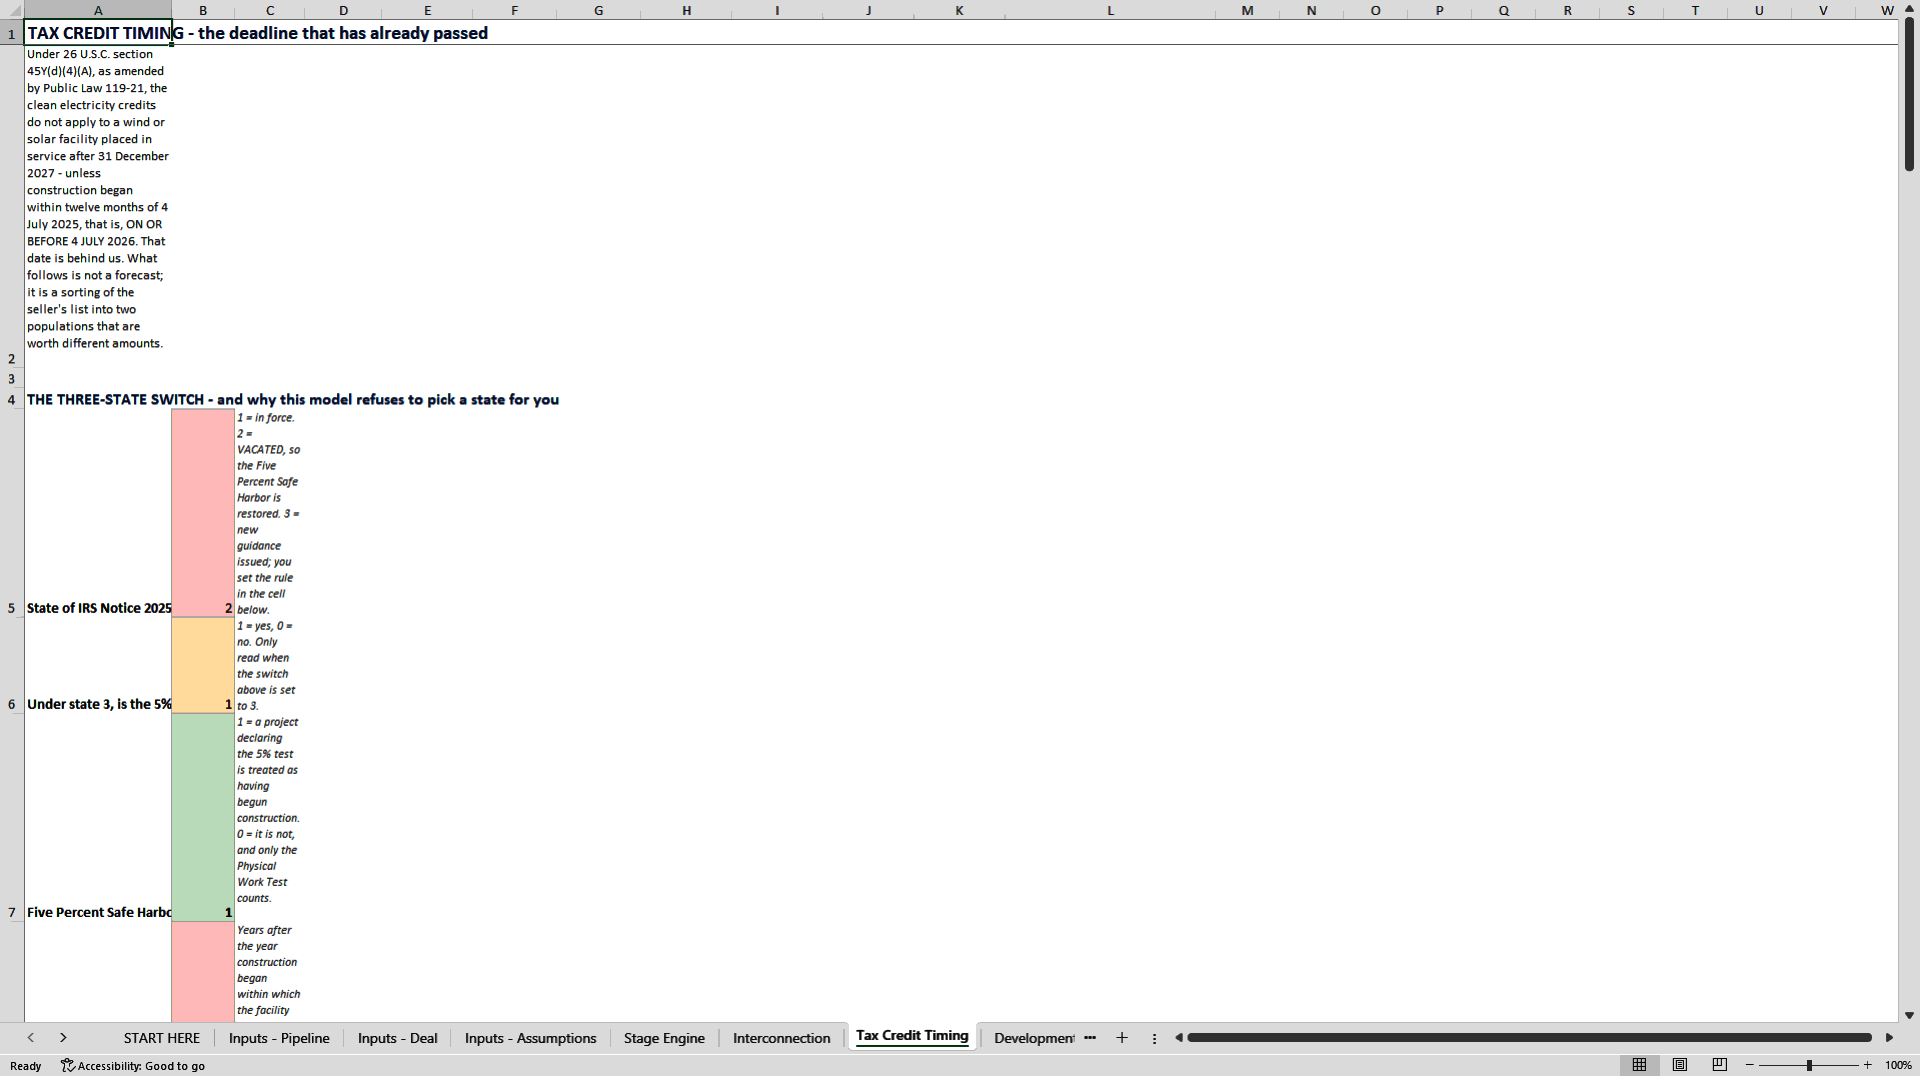
- Price the 4 July 2026 beginning-of-construction deadline project by project, separating solar from storage inside the same hybrid.
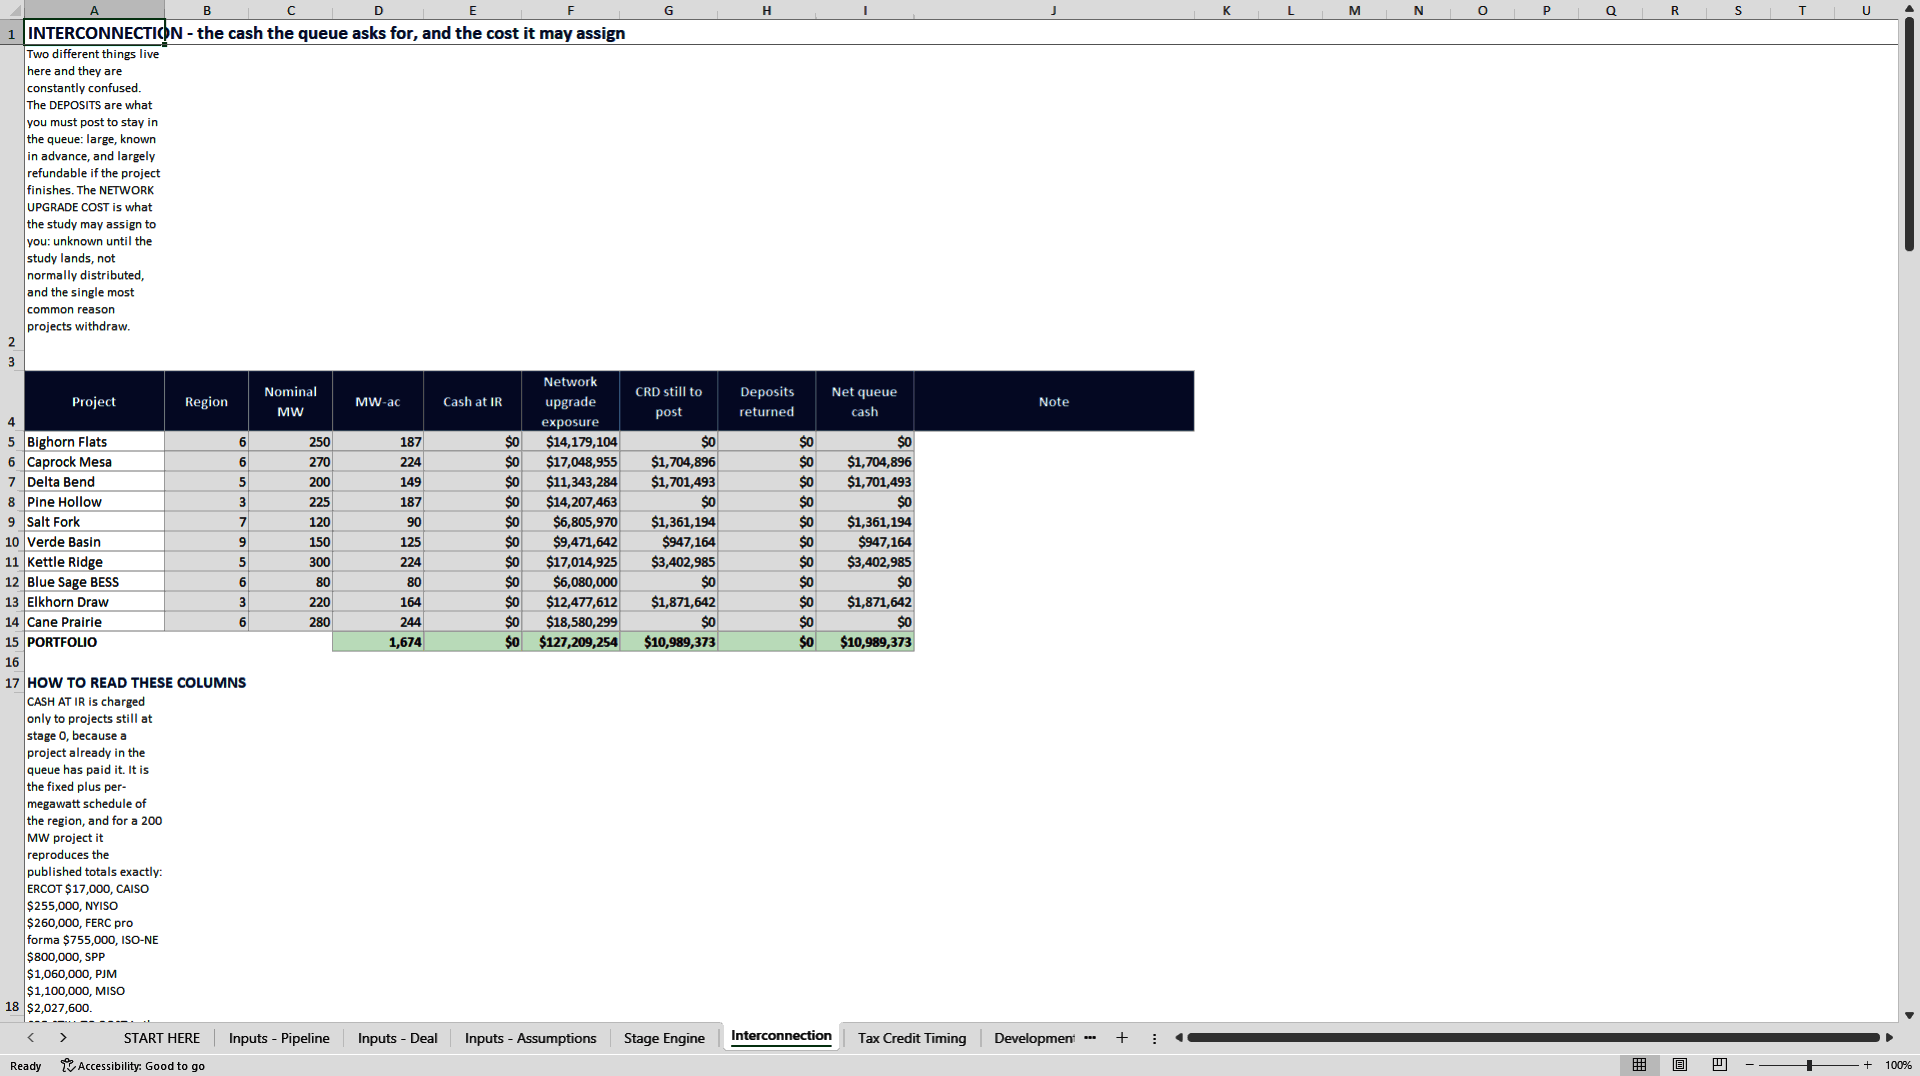
- Size the real cash cost of the interconnection queue by ISO, where the same 200 MW project costs 17,000 dollars in ERCOT and 2,027,600 in MISO.
RENEWABLE ENERGY EXCEL DESCRIPTION
You are not buying cash flow. You are buying a queue.
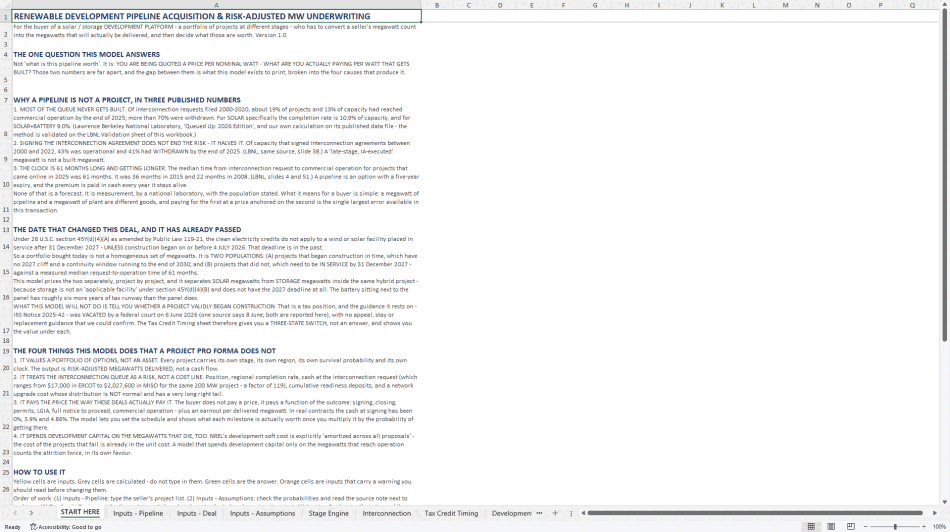
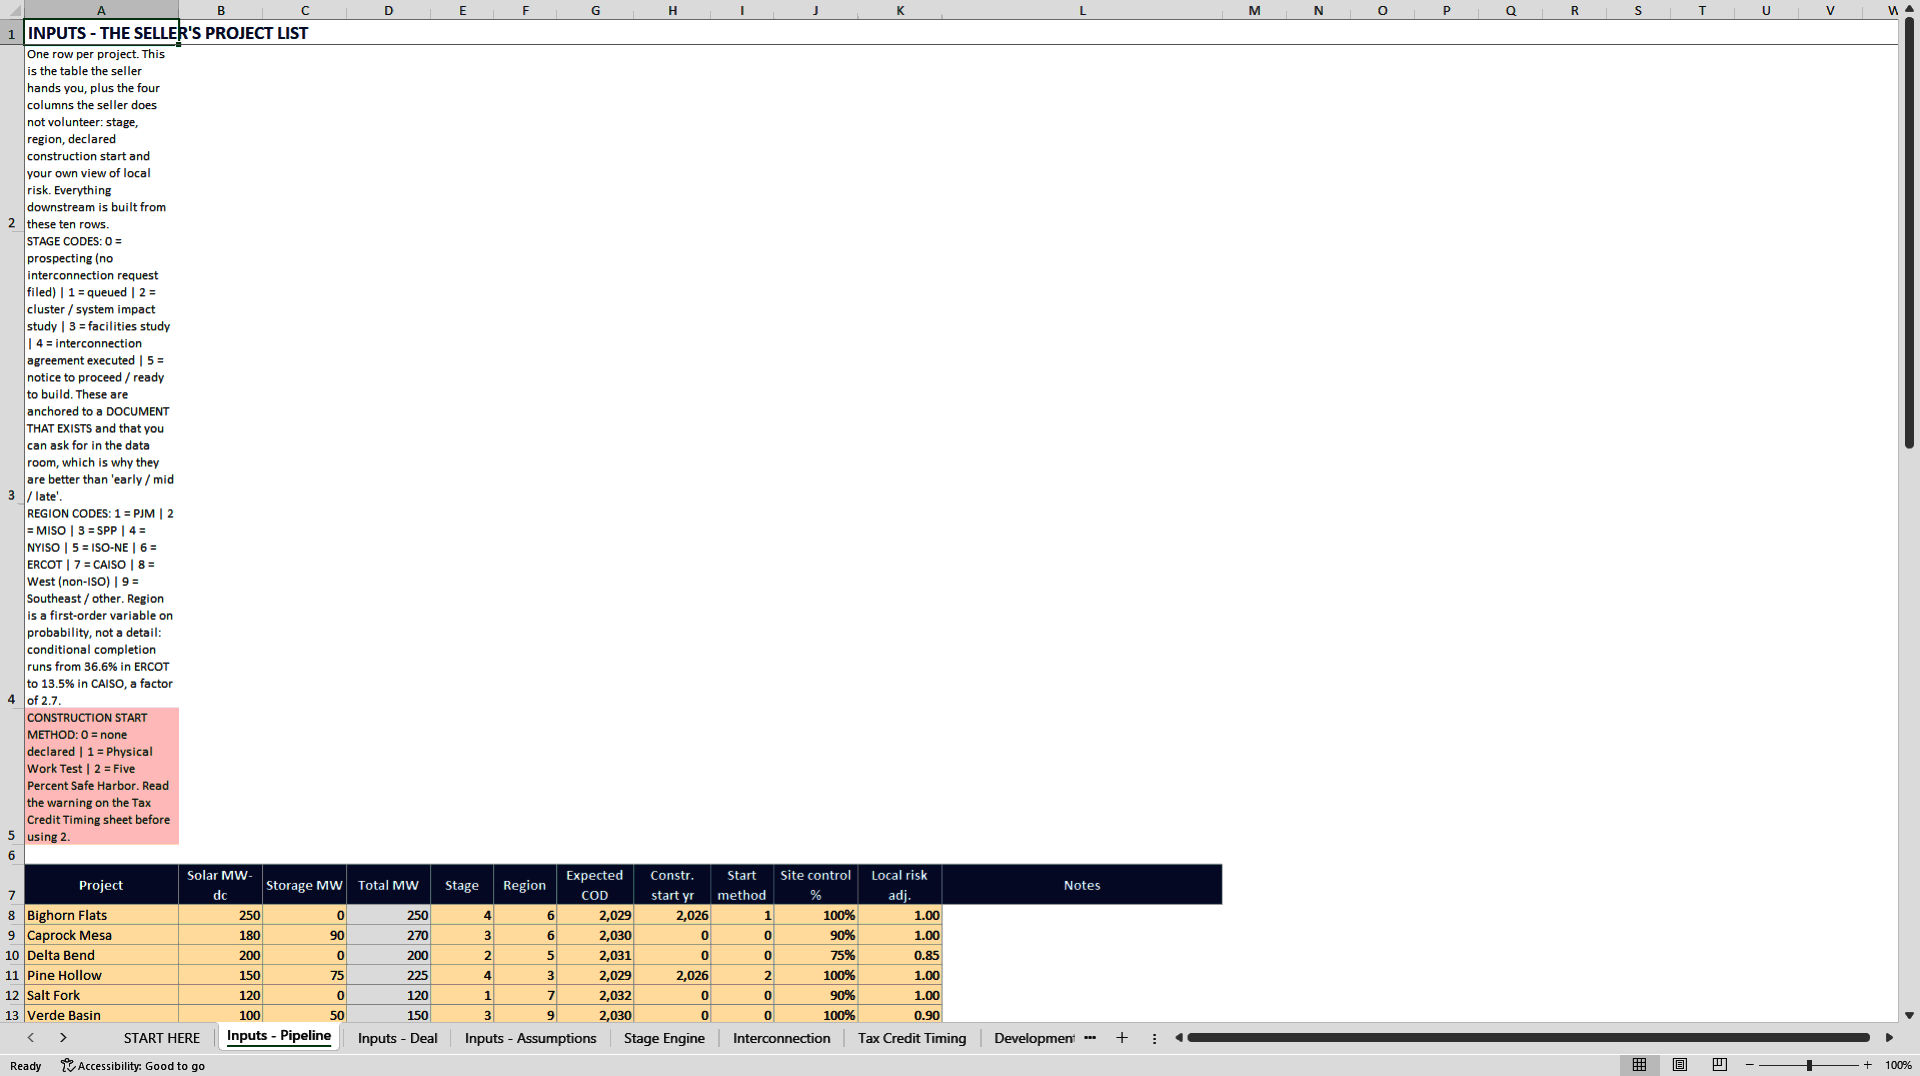
Every renewable financial model on the market forecasts one project for the developer who is building it. This one underwrites the purchase of a PIPELINE: a portfolio of solar and storage projects at different stages, in different markets, with different tax positions, and different odds of ever being built. It is a buy-side tool, written for the acquirer of a development platform rather than for its founder.
A seller hands you a page with a megawatt number on it and a price per watt. Both numbers are true. Neither is the number you should underwrite on, because between the megawatts on the page and the megawatts you will actually own sit four filters, and every one of them has been measured by a national laboratory rather than asserted by anyone.
Of interconnection requests filed in the United States between 2000 and 2020, about 19 percent of projects and 13 percent of capacity had reached commercial operation by the end of 2025. More than 70 percent were withdrawn. For solar on its own the completion rate is 10.9 percent of capacity, and for solar paired with a battery it is 9.0 percent. Signing the interconnection agreement does not end that risk, it halves it: 41 percent of the capacity that signed agreements between 2000 and 2022 had withdrawn by the end of 2025. And the median clock from request to commercial operation is 61 months, against 36 months in 2015 and 22 months in 2008.
THE SIGNATURE OUTPUT IS A BRIDGE, AND IT IS AN IDENTITY RATHER THAN AN ESTIMATE
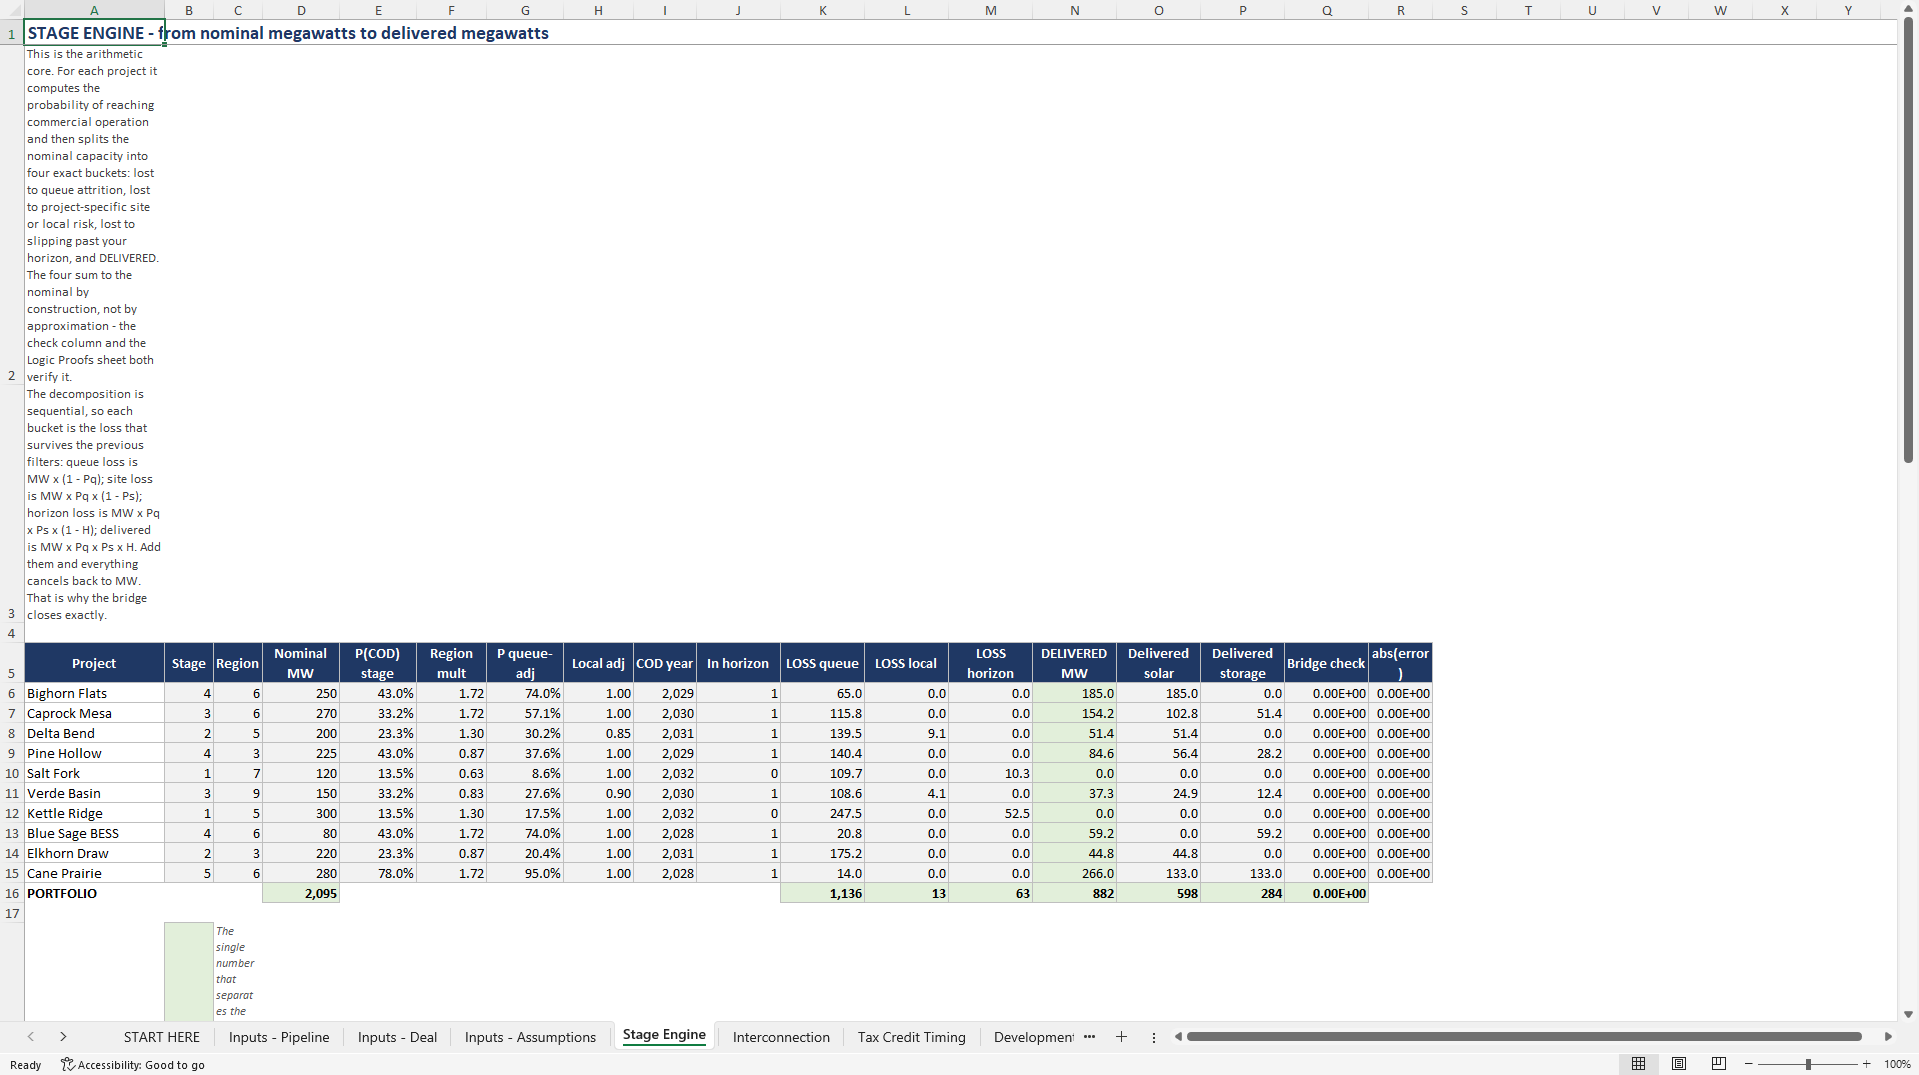
Nominal megawatts, less queue attrition, less site control and local risk, less capacity slipping past your investment horizon, equals risk-adjusted megawatts delivered. The four steps sum to the nominal exactly, because each is defined as the loss that survives the previous filters, and the workbook checks the identity project by project rather than only in aggregate, because an aggregate identity can hold while two projects cancel each other out. Set the risks to zero and the price per delivered watt collapses onto the price per nominal watt, which proves the gap is those four steps and nothing else.
THE TAX DEADLINE HAS ALREADY PASSED, AND IT SPLITS THE PORTFOLIO IN TWO
Under 26 U.S.C. 45Y(d)(4)(A) as amended by Public Law 119-21, a wind or solar facility loses the clean electricity credits if it is placed in service after 31 December 2027, unless construction began on or before 4 July 2026. That date is behind us. A portfolio bought today is therefore two populations worth different amounts, and this model prices them apart, project by project. It also separates solar megawatts from storage megawatts inside the same hybrid project, because storage is not an applicable facility under the statute and has no 2027 cliff at all: the battery has roughly eight more years of tax runway than the panel standing beside it, on the same site, under the same permit, behind the same point of interconnection.
THE QUEUE IS NINE MARKETS, NOT ONE
Cash required at the interconnection request runs from 17,000 dollars in ERCOT to 2,027,600 dollars in MISO for the same 200 megawatt project, a factor of 119, reproduced inside the model from each tariff's own fixed and per-megawatt schedule. Conditional completion runs from 36.6 percent in ERCOT to 13.5 percent in CAISO, a factor of 2.7 on the odds alone. Commercial readiness deposits are cumulative rather than additive, and adding them overstates the cash requirement by about 1.75 times. And the network upgrade cost is not a number but a distribution that is explicitly not normal: among projects completing studies in PJM, 30 percent came in under 5 dollars per kilowatt, 95 percent under 200 dollars, and one came in at 3,728 dollars.
THE BUYER DOES NOT PAY A PRICE, IT PAYS A FUNCTION OF THE OUTCOME
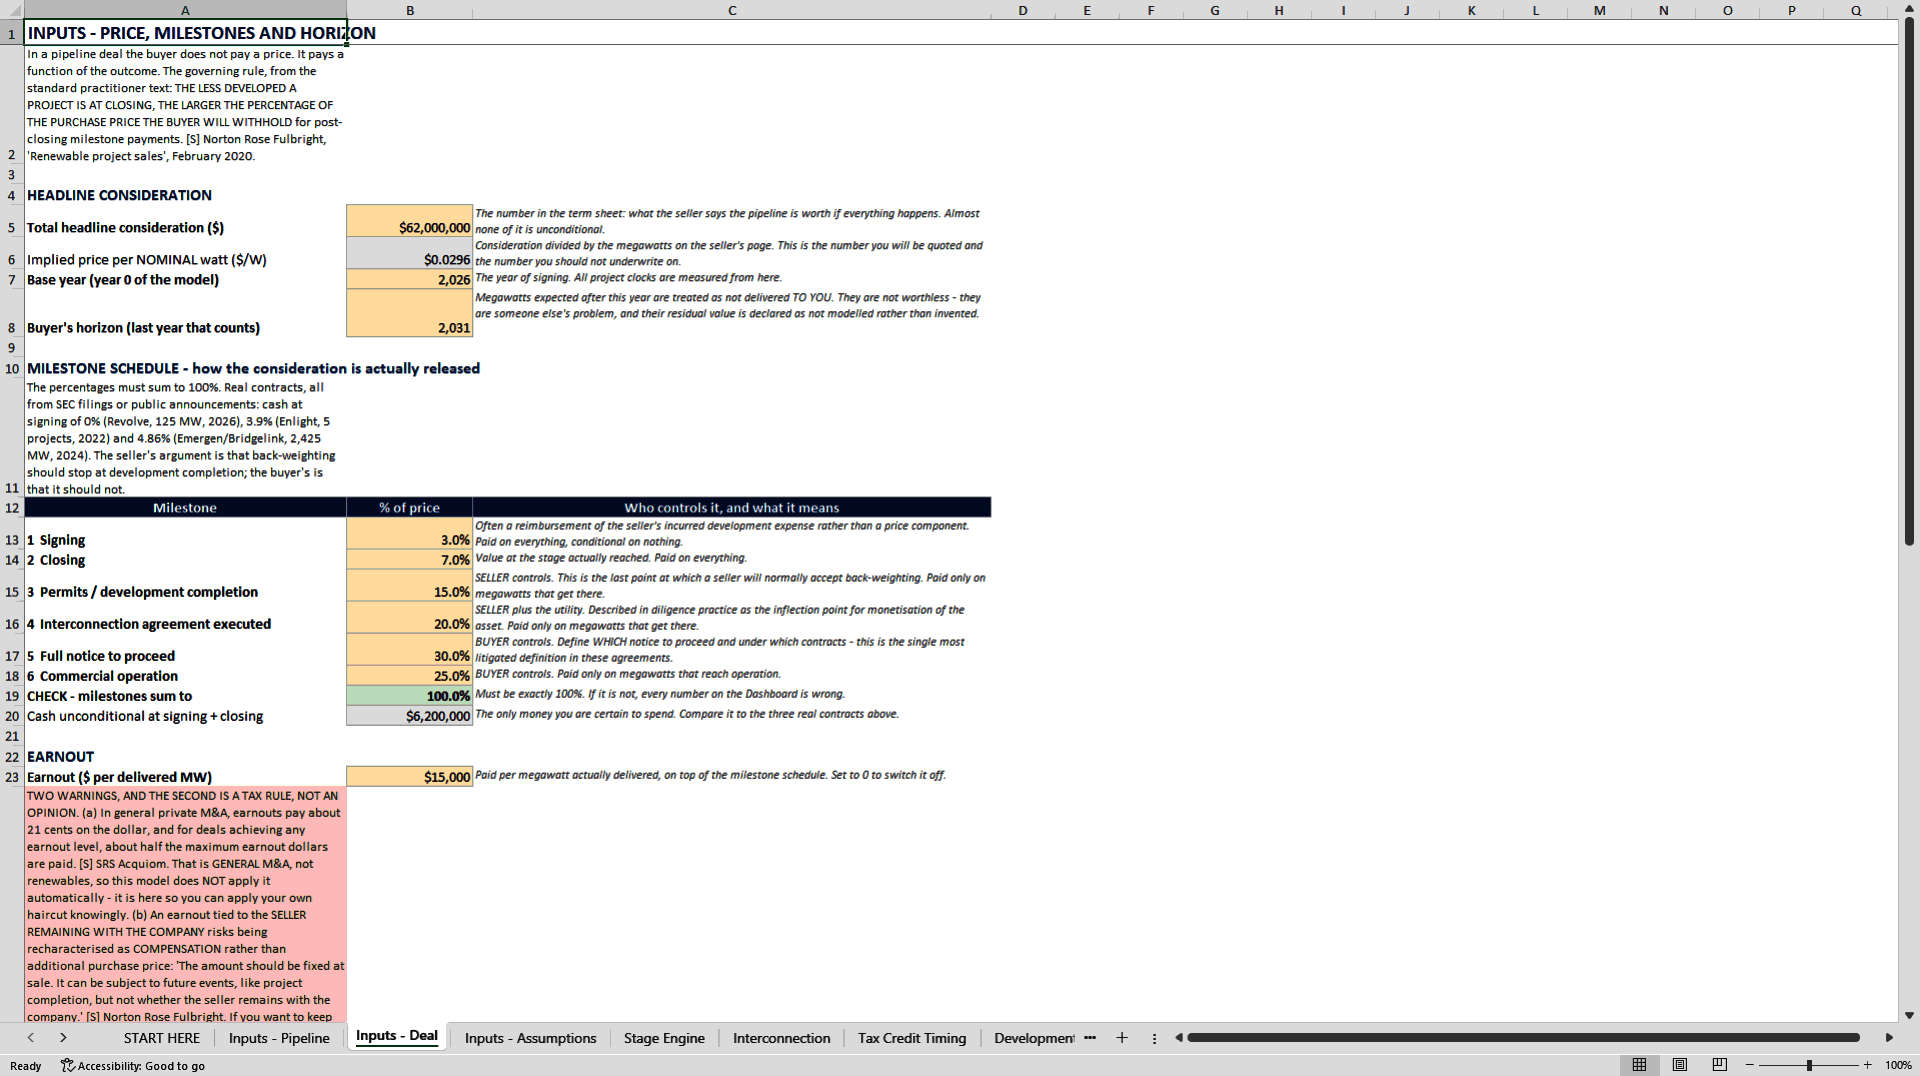
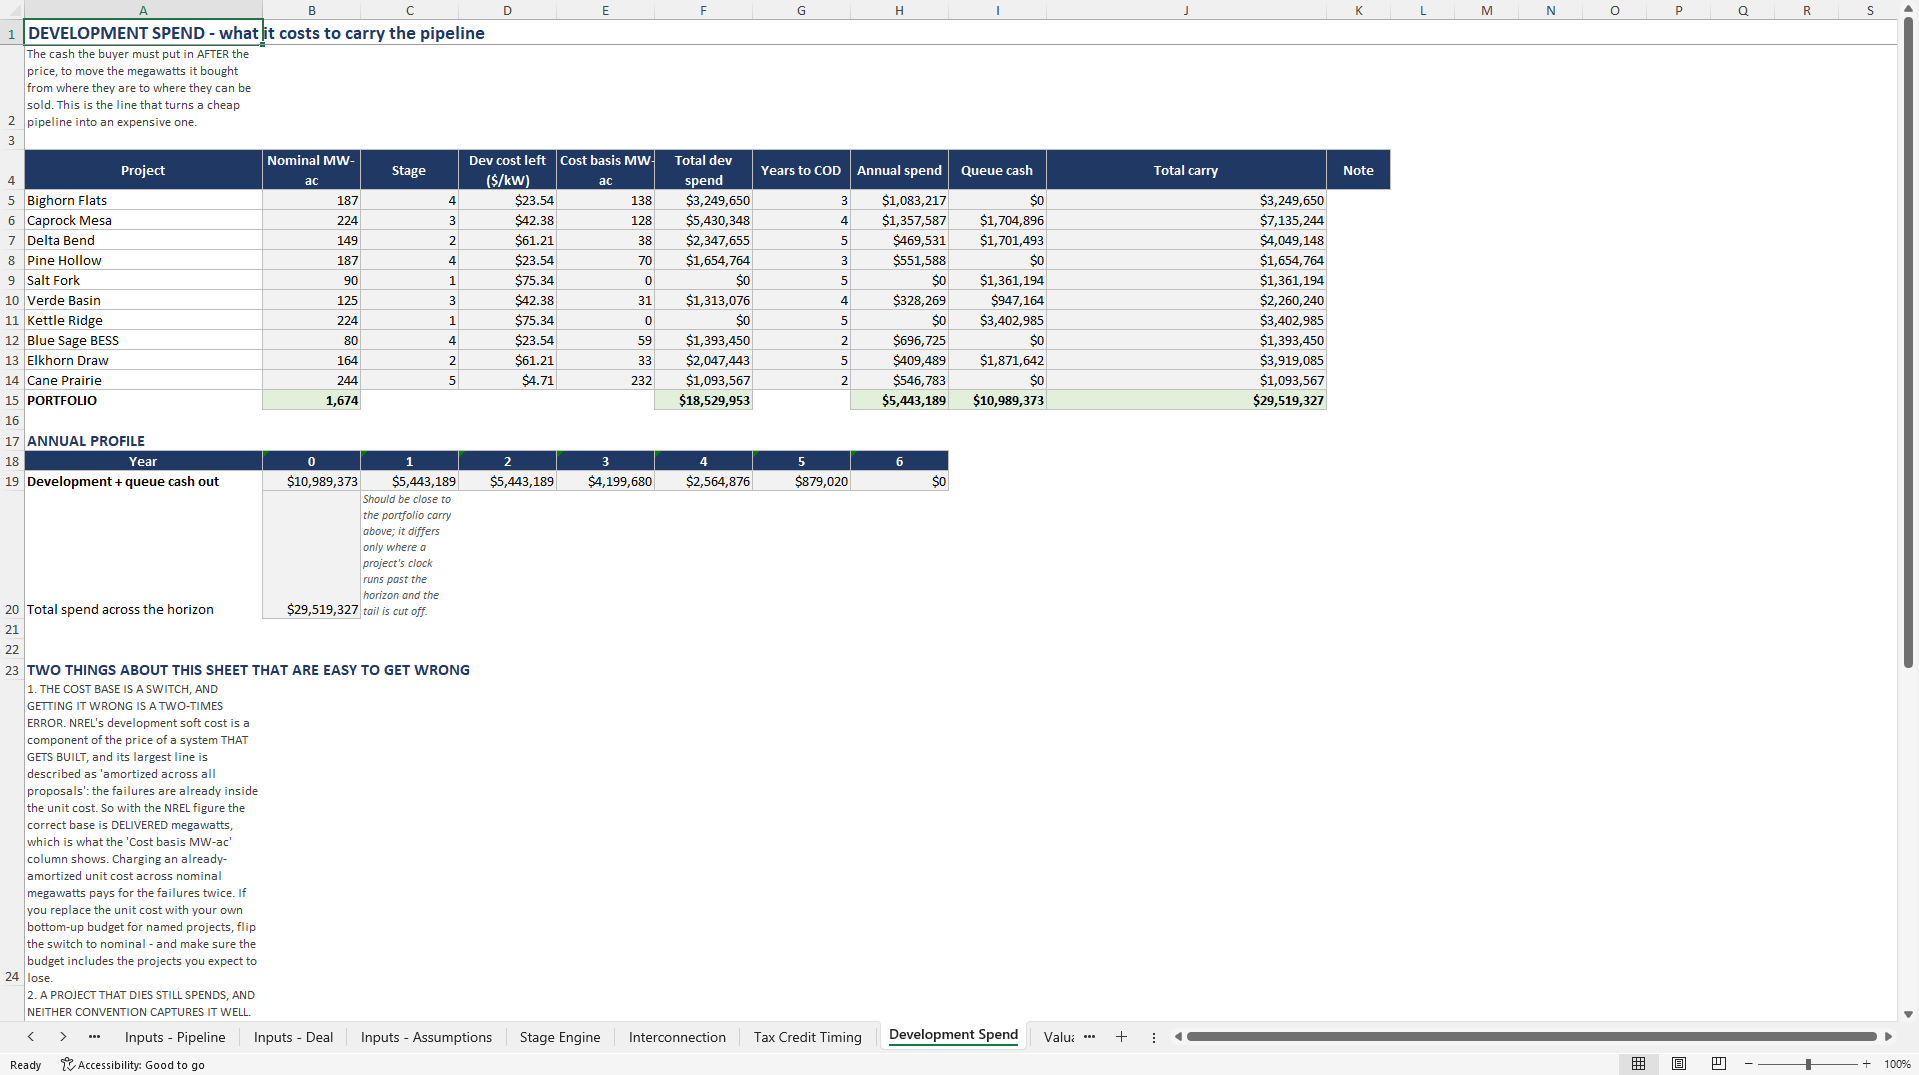
Signing, closing, permits, interconnection agreement, full notice to proceed and commercial operation, each tranche priced at the probability of reaching it, plus an earnout for every delivered megawatt. In real contracts filed with the Securities and Exchange Commission, cash at signing has been 0 percent, 3.9 percent and 4.86 percent of total consideration.
VALIDATION YOU CAN CHECK RATHER THAN TRUST
A cross-check against our own re-implementation cannot see a shared conceptual error, but a published example can. So the survival arithmetic the model applies to your projects is run, on a dedicated sheet, against Lawrence Berkeley National Laboratory's own published figures, and reproduces the percentages the laboratory prints, from the laboratory's inputs, with one operator applied consistently. Seventeen logic proofs compute live from your inputs. Sixteen must pass. One is designed to fail, and its failure is the lesson: the published median durations from request to agreement and from agreement to operation sum to 76 months, against a directly measured request-to-operation median of 61. They are three different samples, and a model that adds them is wrong by fifteen months.
WHAT IT REFUSES TO TELL YOU
It does not publish a standard probability of success by development stage, because no standard exists and the most cited source on pipeline diligence says so itself. Only two of the six stage probabilities are anchored to a measurement; the other four are conventions, pre-filled by interpolation and labelled as conventions in the cell beside them. It does not publish a market price per watt for pipeline, because the market says of itself that there is not a value mark; the reference points it offers are cited one by one with the caveat belonging to each. It does not tell you whether a project validly began construction, because that is a tax position resting on guidance a federal court vacated in June 2026 with no appeal, stay or replacement that could be confirmed, so you get a three-state switch and the answer under each state. And it does not publish a development hurdle rate, because none is published anywhere we could verify.
A DEFAULT CASE THAT IS DELIBERATELY MARGINAL
The base case lands somewhere instructive: the margin per delivered watt is positive and the internal rate of return is below the hurdle. The deal makes money and is still not worth doing, because a pipeline pays out years after it is bought. That is the most common way a pipeline acquisition goes wrong on a spreadsheet that contains no errors at all.
Fifteen sheets and 828 formulas. Microsoft Excel and Google Sheets, no macros, no external links, no iterative calculation. A 10-page user guide is included, with every source named in full.
Educational underwriting tool. Not financial, investment, tax or legal advice.
Got a question about the product? Email us at support@flevy.com or ask the author directly by using the "Ask the Author a Question" form. If you cannot view the preview above this document description, go here to view the large preview instead.
Source: Best Practices in Renewable Energy, Integrated Financial Model Excel: Renewable Development Pipeline Acquisition Model Excel (XLSX) Spreadsheet, ProformaWorks
ABOUT THE AUTHOR

ProformaWorks builds acquisition-grade financial models for Main Street and lower-middle-market businesses - the kind of deal financed with an SBA 7(a) loan or a small commercial facility.
Every model answers one question: does this deal pencil at the bank? That means SDE or NOI rebuilt from the seller's own numbers, the add-backs a lender will and will not accept, a debt-service
... [read more]
Ask the Author a Question
You must be logged in to contact the author.




























