
Private Equity Fund Projection Model (10-Year Forecast) – Excel XLSX
Excel (XLSX)
BENEFITS OF THIS DOWNLOADABLE EXCEL DOCUMENT
- Provides a comprehensive framework for building an institutional-grade Private Equity Fund Projection Model tailored to your fund strategy and investor base.
- Delivers a structured system for modeling LP/GP economics, waterfall distributions, and portfolio cash flows with institutional precision.
- Equips your team with a professional-grade financial architecture designed to support fundraising, due diligence, and GP performance analysis.
PRIVATE EQUITY EXCEL DESCRIPTION
Curated by McKinsey-trained Executives
🏦 Private Equity Fund Projection Model – Institutional-Grade LP/GP Returns & Cash Flow Analysis
Stop paying $50,000 for a fund model. Stop losing LPs because your waterfall doesn't tie. Stop guessing your IRR.
If you're raising, running, or investing in a private equity fund, your financial model is NOT a spreadsheet.
It's your #1 LP fundraising weapon. Your GP economics proof of concept. Your institutional due diligence armor.
And this model gives you – fully built and formula-verified – exactly what institutional LPs, fund-of-funds, and allocators demand to see before writing a check.
💼 What You Get
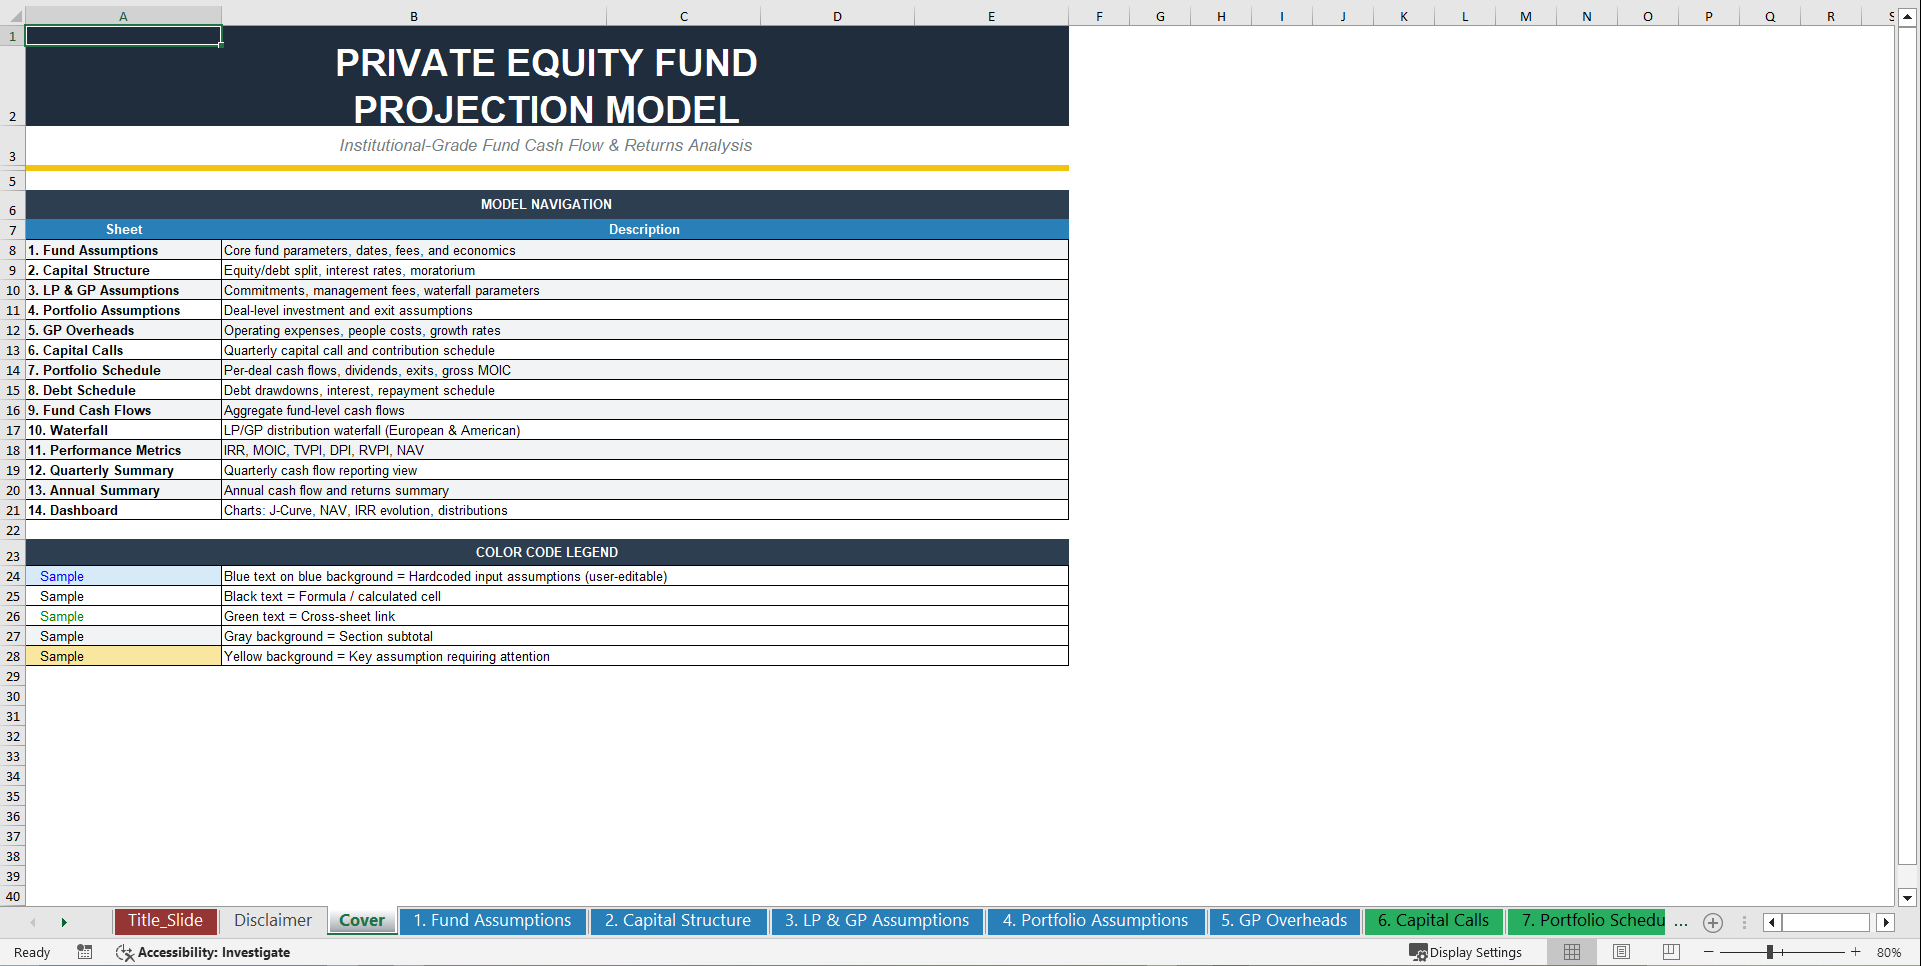
✅ 14 Fully Linked Excel Worksheets
✅ Complete Fund-Level & Deal-Level Cash Flow Architecture
✅ 10-Year Fund Life with Quarterly Granularity
✅ European & American Waterfall – Switchable with One Cell
✅ Full LP/GP Economics: Management Fees, Carried Interest, Clawback
✅ Deal-by-Deal Portfolio Schedule with Dividends & Exit Proceeds
✅ Debt Schedule per Deal with Drawdowns, Interest & Repayment
✅ Gross & Net IRR, MOIC, TVPI, DPI, and RVPI – Auto-Calculated
✅ J-Curve, NAV Roll-Forward & Benchmark Alpha Table
✅ Interactive Performance Dashboard – Investor-Ready on Day One
✅ Works in Microsoft Excel
This is not a generic fund template.
This is a complete, institutional-grade private equity fund projection system.
🎯 Who This Is For
• Emerging managers raising Fund I, II, or III from institutional LPs
• Private equity GPs modeling fund economics before the first close
• Fund-of-funds analysts underwriting GP commitments and fee structures
• LP investment teams stress-testing carry and preferred return structures
• IR professionals building data room–ready performance packages
• PE placement agents needing institutional-grade fund projections
• Family offices evaluating direct PE fund commitments
• Investment banking analysts modeling PE fund structures for clients
• MBA and CFA candidates learning PE fund mechanics and waterfall math
• CFOs and COOs of PE firms building operational budget models
If you raise capital, allocate capital, or analyze private equity fund structures – this was built for you.
🔥 Why Most PE Fund Models Fail
Generic templates focus on:
• Simple IRR calculations with no quarterly cash flow granularity
• No deal-by-deal portfolio build – just one blended return assumption
• No waterfall mechanics – LP and GP distributions are a guess
• No management fee step-down from commitment to harvest period
• No debt schedule per portfolio company
• No J-curve visualization or NAV roll-forward
• No clawback provision modeling
• No gross vs. net return split showing true LP economics
• No benchmark comparison vs. S&P 500, MSCI World, and PE quartiles
This model fixes every one of those failures – from the ground up.
📚 What's Inside
Tab 1: Fund Assumptions
Core fund parameters including fund name, fund size ($500mm default), investment period, fund life (10 years), discount rate, tax rate, setup costs, recycling provision and cap, target gross IRR (25%), and target net IRR (18%). Derived parameters auto-calculate commitment period end date, fund end date, total fund quarters, and investment quarters. Recurring fund expense schedule covers administration, audit & tax, legal fees, and insurance – all annually driven.
Tab 2: Capital Structure
Full equity/debt split at the deal level and fund level. Configure interest rates, moratorium periods, and debt allocation assumptions that feed directly into the per-deal debt schedule. Every leverage assumption flows through to fund-level cash flows and IRR calculations automatically.
Tab 3: LP & GP Assumptions
Total fund size linked from Tab 1. GP commitment percentage and dollar amount. LP commitment percentage and dollar amount. Management fee during commitment period (2.0% p.a. default) and harvest period (1.5% p.a. default) – both fully adjustable. Management fee basis switchable between committed capital and invested capital. Waterfall economics: preferred return/hurdle rate (8% default), catch-up rate (100% default), carried interest (20% default). Waterfall type selector: one cell switches between European (whole-fund) and American (deal-by-deal) distribution mechanics. Distribution timing and clawback provision with configurable GP clawback trigger.
Tab 4: Portfolio Assumptions
Deal-by-deal input table for up to 8 portfolio companies across Healthcare, Technology, Industrials, Consumer, Energy, and Business Services. Per-deal inputs: investment date, exit date, equity invested, debt allocated, exit multiple, dividend yield, revenue at entry, EBITDA at entry, and entry EV/EBITDA. Deal status tracks realized vs. unrealized positions. Portfolio summary auto-calculates: number of deals, total equity invested, total debt allocated, weighted average exit multiple, and equity invested as percentage of fund size. Change one row – the entire model updates.
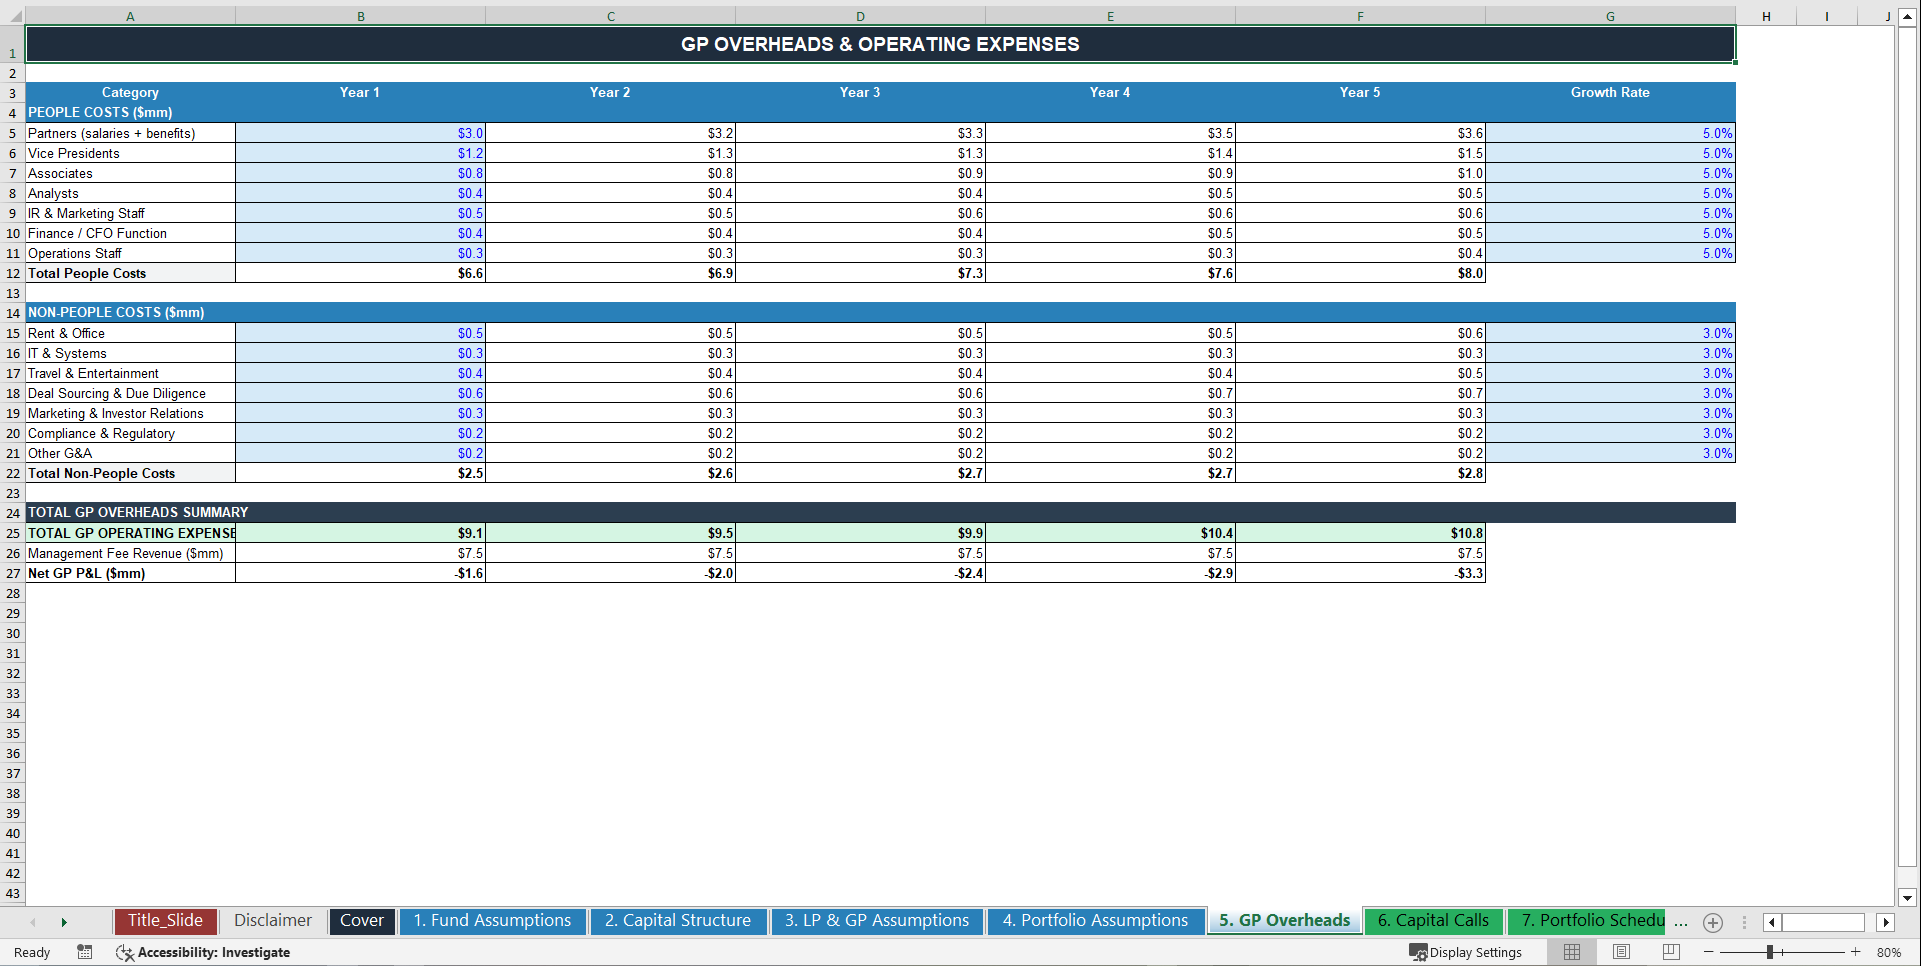
Tab 5: GP Overheads
Full GP operating expense schedule covering personnel costs, management company overhead, technology infrastructure, and growth rates. GP overhead feeds directly into net cash flows and carried interest calculations – ensuring your LP net returns reflect true cost of fund management.
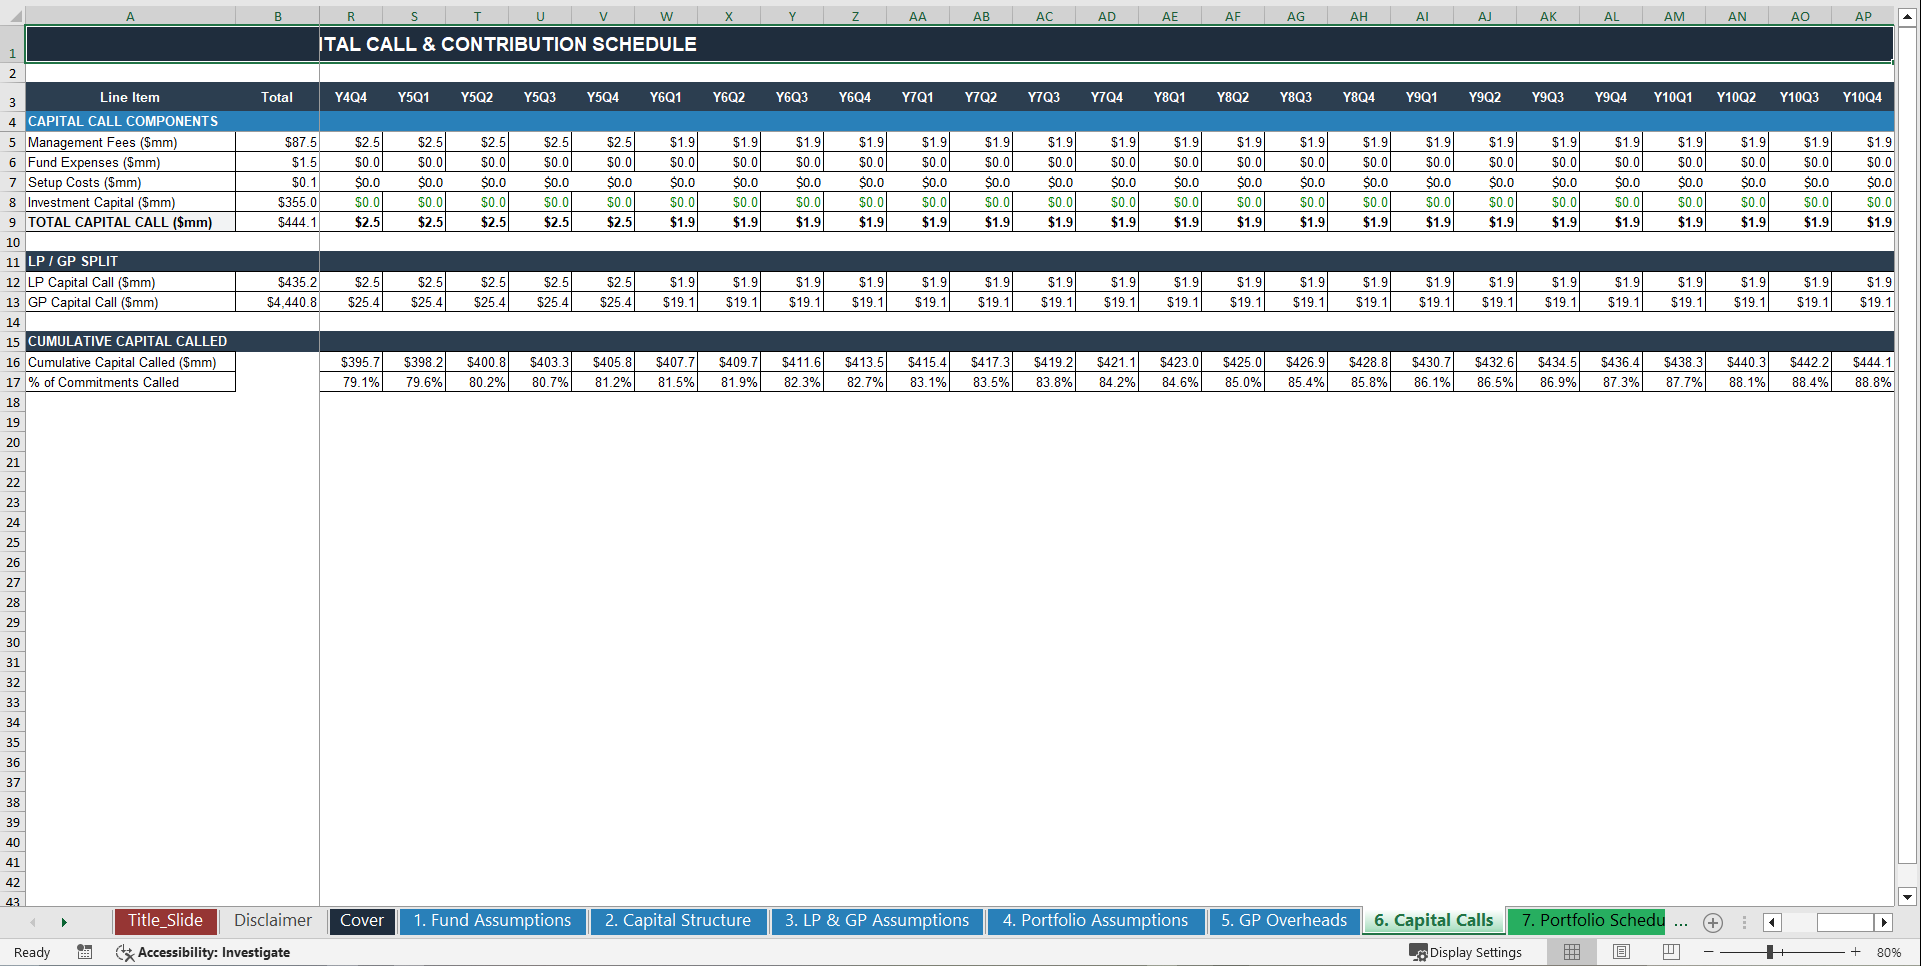
Tab 6: Capital Calls
Quarterly capital call schedule and LP contribution timeline built from portfolio investment dates and deal sizing. Every capital call is tied to a specific deal entry – no lump-sum approximations. Capital call schedule drives the J-curve construction, LP paid-in capital tracking, and DPI/RVPI calculations throughout the fund life.
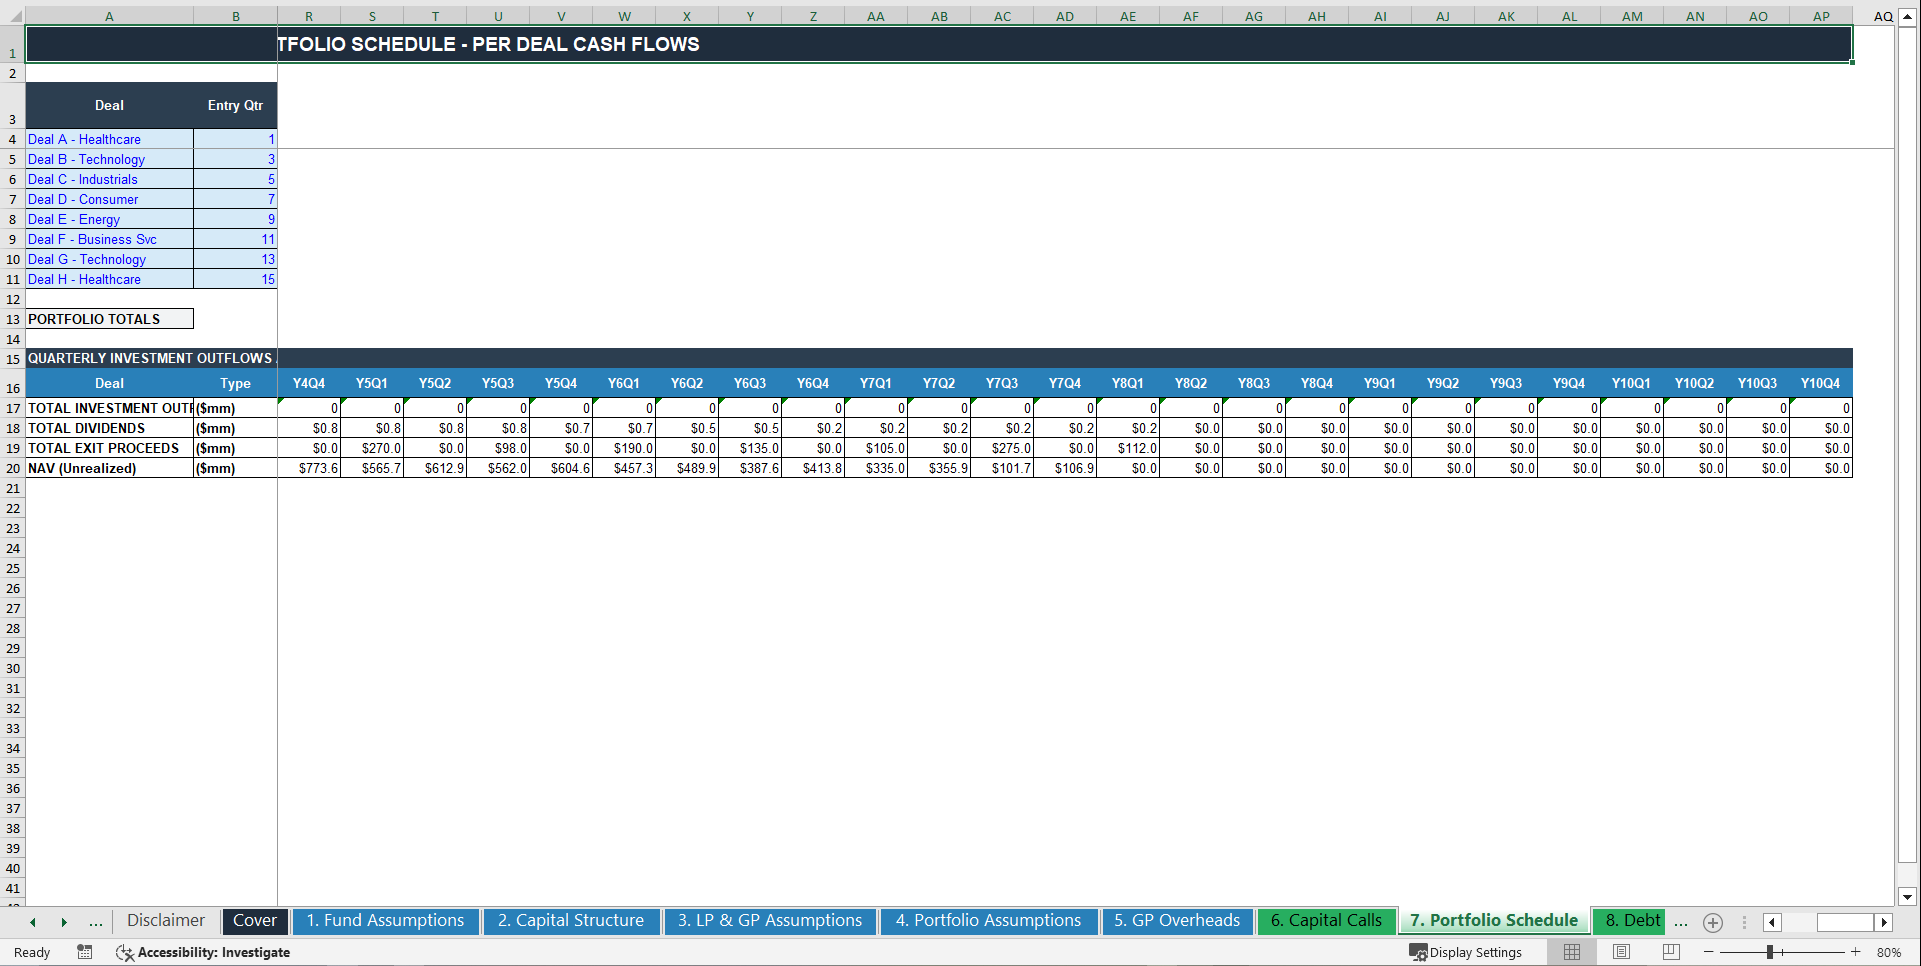
Tab 7: Portfolio Schedule
Per-deal cash flows for every quarter of the fund life: equity contributions, debt proceeds, portfolio company dividends, and exit proceeds. Gross MOIC per deal calculated automatically from equity invested and total proceeds. Dividend yield accrues quarterly from deal entry to exit. Exit proceeds calculated from exit multiple applied to invested equity plus debt return. Every deal's cash flows aggregate to fund-level totals in Tab 9.
Tab 8: Debt Schedule
Deal-level debt schedule covering drawdowns, interest accrual, and repayment for each portfolio company. Interest calculated on outstanding debt balance by quarter. Repayment tied to exit dates. Debt service feeds into fund-level cash flows and reduces distributions available for the waterfall.
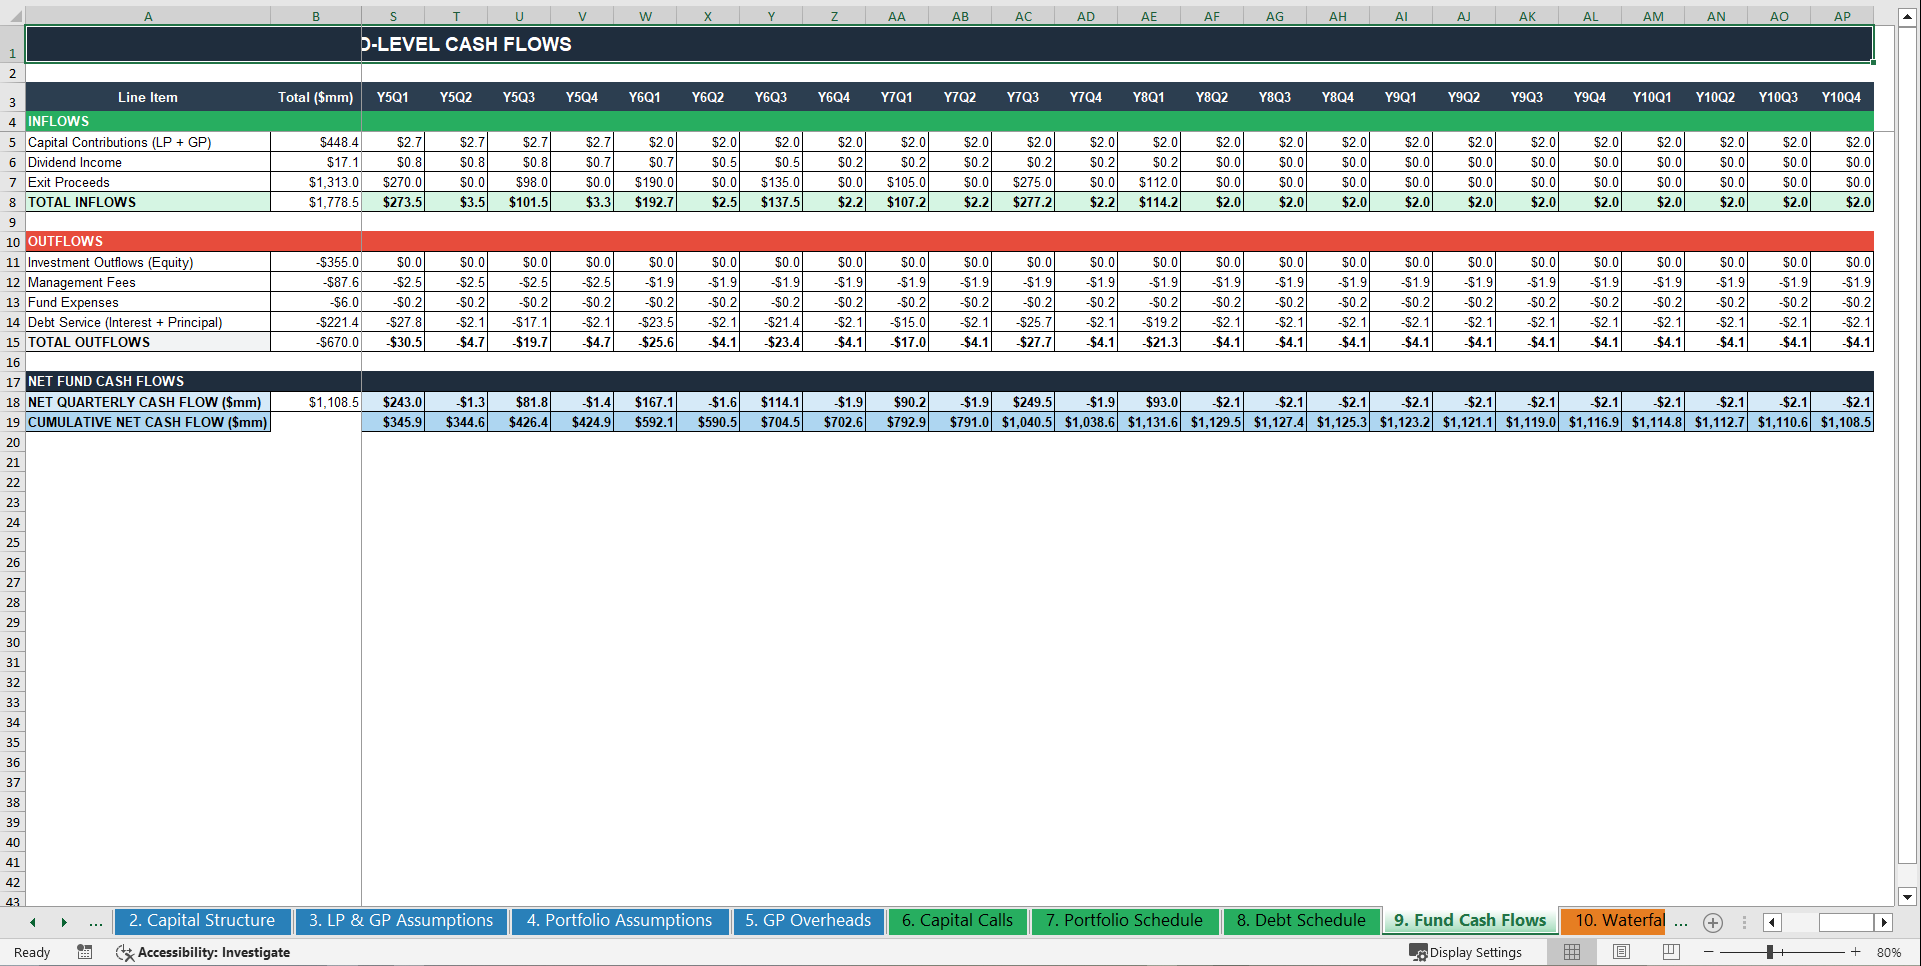
Tab 9: Fund Cash Flows
Aggregate fund-level cash flow statement consolidating all portfolio contributions, dividend income, exit proceeds, management fees, GP overhead, and debt flows. Net fund cash flow by quarter drives the J-curve, IRR calculation, and waterfall distribution. This is the single sheet every LP will audit first in due diligence.
Tab 10: Waterfall
Full LP/GP distribution waterfall – European and American mechanics both built and switchable. Return of capital to LPs. Preferred return at 8% p.a. (configurable) distributed to LPs before any carry. GP catch-up at 100% (configurable) until GP reaches full carried interest percentage. Carried interest split (20% default) on remaining profits. Clawback provision with configurable trigger percentage. Every distribution tranche auto-calculates from fund cash flows – no manual overrides.
Tab 11: Performance Metrics
Gross and net returns side-by-side: Gross MOIC 3.74x, Net MOIC 2.37x. Gross IRR 45.8%, Net IRR 34.4%. TVPI, DPI, RVPI calculated from fund cash flows and NAV. LP vs. GP split on all return metrics. Total capital committed, called, and distributed. Carried interest accrued ($167.8mm). Management fees total ($87.5mm). Benchmark comparison table: fund net IRR vs. S&P 500, MSCI World, PE top-quartile, PE median, and MSCI Private Equity Index with alpha calculated automatically.
Tab 13: Annual Summary
Annual cash flow and returns summary rolled up from quarterly detail. Fund performance by year: capital calls, distributions, NAV, cumulative MOIC, and IRR progression. Designed for LP annual reporting, board presentations, and placement agent marketing materials.
Tab 14: Dashboard
Interactive performance dashboard with J-curve visualization (quarterly cumulative cash flows), NAV over time, cumulative MOIC progression, and fund-level KPI cards. Fully formula-driven – present directly to LPs on day one without rebuilding a single chart.
💰 Why This Model Is Different
✔ Quarterly cash flow granularity – not annual approximations that hide J-curve dynamics
✔ Deal-by-deal portfolio build – every LP will drill into individual position returns
✔ True gross-to-net waterfall – management fees and carry calculated correctly, not estimated
✔ European AND American waterfall in one model – switchable with a single cell
✔ Institutional benchmark comparison table – answer the "vs. public markets" question before LPs ask it
✔ Clawback provision modeled – critical for institutional LP compliance and side letter negotiations
✔ Zero formula errors – every metric ties from portfolio deal level to fund performance dashboard
Built for private equity GPs raising institutional capital, LP teams running fund due diligence, and placement agents marketing fund economics – not generic investment return calculators.
🧠 Built for Real Capital Decisions
This model helps you:
• Close institutional LPs by presenting a credible, quarterly-detailed fund cash flow model
• Negotiate GP economics with confidence – know exactly what 20% carry on a 2.37x net MOIC looks like
• Answer every LP due diligence question about waterfall, clawback, and management fee step-down
• Stress-test exit multiples and hold periods before committing capital to deals
• Build your data room financial package – ready for fund-of-funds, endowments, and pension allocators
• Compress weeks of fund modeling work into hours
🚨 The Cost of NOT Having This
Every LP meeting you run without a proper fund model risks:
• Losing a first close because your waterfall math doesn't withstand institutional scrutiny
• Misquoting your net IRR to LPs because your gross-to-net conversion is wrong
• Failing due diligence because your J-curve doesn't tie to your capital call schedule
• Spending $40,000–$75,000 on a placement agent or consultant to build what you can own and reuse across every fund you raise
One institutional LP commitment modeled correctly could return this investment thousands of times over.
⚡ Stop Building From Scratch. Start Closing LPs.
If you're serious about:
• Raising Fund I, II, or III with an institutional-grade fund projection model
• Running GP economics analysis before you finalize your fund terms
• Presenting LP/GP return splits that survive allocator due diligence
• Saving weeks of fund modeling time on your next raise
This model is your shortcut.
👉 Get the Private Equity Fund Projection Model the Right Way
No hardcoded IRR assumptions.
No broken waterfall logic.
No deal-by-deal cash flows that don't roll up to fund level.
Just a complete, verified, institutional-grade private equity fund projection model – ready for your next LP close, fund launch, or GP economics analysis.
Download the PE Fund Projection Model today – and raise your next fund with institutional confidence.
Key Words:
Strategy & Transformation, Growth Strategy, Strategic Planning, Strategy Frameworks, Innovation Management, Pricing Strategy, Core Competencies, Strategy Development, Business Transformation, Marketing Plan Development, Product Strategy, Breakout Strategy, Competitive Advantage, Mission, Vision, Values, Strategy Deployment & Execution, Innovation, Vision Statement, Core Competencies Analysis, Corporate Strategy, Product Launch Strategy, BMI, Blue Ocean Strategy, Breakthrough Strategy, Business Model Innovation, Business Strategy Example, Corporate Transformation, Critical Success Factors, Customer Segmentation, Customer Value Proposition, Distinctive Capabilities, Enterprise Performance Management, KPI, Key Performance Indicators, Market Analysis, Market Entry Example, Market Entry Plan, Market Intelligence, Market Research, Market Segmentation, Market Sizing, Marketing, Michael Porter's Value Chain, Organizational Transformation, Performance Management, Performance Measurement, Platform Strategy, Product Go-to-Market Strategy, Reorganization, Restructuring, SWOT, SWOT Analysis, Service 4.0, Service Strategy, Service Transformation, Strategic Analysis, Strategic Plan Example, Strategy Deployment, Strategy Execution, Strategy Frameworks Compilation, Strategy Methodologies, Strategy Report Example, Value Chain, Value Chain Analysis, Value Innovation, Value Proposition, Vision Statement, Corporate Strategy, Business Development, Business plan pdf, business plan, PDF, Business Plan DOC, Business Plan Template, PPT, Market strategy playbook, strategic market planning, competitive analysis tools, market segmentation frameworks, growth strategy templates, product positioning strategy, market execution toolkit, strategic alignment playbook, KPI and OKR frameworks, business growth strategy guide, cross-functional strategy templates, market risk management, market strategy PowerPoint doc, guide, ebook, e-book ,McKinsey Change Playbook, Organizational change management toolkit, Change management frameworks 2025, Influence model for change, Change leadership strategies, Behavioral change in organizations, Change management PowerPoint templates, Transformational leadership in change, supply chain KPIs, supply chain KPI toolkit, supply chain PowerPoint template, logistics KPIs, procurement KPIs, inventory management KPIs, supply chain performance metrics, manufacturing KPIs, supply chain dashboard, supply chain strategy KPIs, reverse logistics KPIs, sustainability KPIs in supply chain, financial supply chain KPIs, warehouse KPIs, digital supply chain KPIs, 1200 KPIs, supply chain scorecard, KPI examples, supply chain templates, Corporate Finance SOPs, Finance SOP Excel Template, CFO Toolkit, Finance Department Procedures, Financial Planning SOPs, Treasury SOPs, Accounts Payable SOPs, Accounts Receivable SOPs, General Ledger SOPs, Accounting Policies Template, Internal Controls SOPs, Finance Process Standardization, Finance Operating Procedures, Finance Department Excel Template, FP&A Process Documentation, Corporate Finance Template, Finance SOP Toolkit, CFO Process Templates, Accounting SOP Package, Tax Compliance SOPs, Financial Risk Management Procedures.
NOTE: Our digital products are sold on an "as is" basis, making returns and refunds unavailable post-download. Please preview and inquire before purchasing. Please contact us before purchasing if you have any questions! This policy aligns with the standard Flevy Terms of Usage.
Got a question about the product? Email us at support@flevy.com or ask the author directly by using the "Ask the Author a Question" form. If you cannot view the preview above this document description, go here to view the large preview instead.
Source: Best Practices in Private Equity Excel: Private Equity Fund Projection Model (10-Year Forecast) Excel (XLSX) Spreadsheet, SB Consulting
ABOUT THE AUTHOR
SB Consulting is dedicated to empowering businesses to communicate their ideas with impact. This consulting firm specializes in teaching organizations how to create effective corporate and management presentations. With training from top-tier global consulting firms, including McKinsey, BCG, and Porsche Consulting, extensive expertise in presentation design and ... [read more]
Ask the Author a Question
You must be logged in to contact the author.
