
Parking Lot 10-Year 3 Statement Financial Model – Excel XLSX
Excel (XLSX)
BENEFITS OF THIS DOWNLOADABLE EXCEL DOCUMENT
- Delivers a complete operational and financial modeling system for underwriting Parking Lot and Parking Garage investments with the rigor expected by lenders, equity partners, and institutional funds.
- Enables consultants, developers, and investors to build a credible, assumption-driven 10-Year Parking Business Forecast -- from revenue and CapEx through to a fully balanced Balance Sheet and verified Cash Flow Statement.
- Provides a ready-to-use Excel framework for building a fully integrated 3-Statement Financial Model for any Parking Lot or Parking Garage business.
INTEGRATED FINANCIAL MODEL EXCEL DESCRIPTION
Curated by McKinsey-trained Executives
🅿️ Parking Lot & Parking Garage Financial Model – 10-Year Forecast
The Ultimate Excel Financial Model for Parking Developers, Investors & Operators
Stop guessing your numbers. Stop paying $25,000 for a consultant to build what you can own forever.
If you're developing, acquiring, or financing a parking asset, your financial model is NOT a spreadsheet.
It's your #1 underwriting tool. Your capital-raising engine. Your investor-ready proof of concept.
And this model gives you – fully built and formula-verified – exactly what institutions expect to see.
💼 What You Get
✅ 13 Fully Linked Excel Worksheets
✅ 1,879+ Active, Verified Excel Formulas
✅ 10-Year Annual Forecast (Year 1 – Year 10)
✅ Complete 3-Statement Model: Income Statement, Balance Sheet & Cash Flow
✅ 6 Separate Revenue Streams Built from Operational Drivers
✅ Full CapEx & PP&E Depreciation Schedule
✅ Project Finance Debt Schedule with Amortization
✅ Sensitivity Analysis & 6-Scenario Comparison Table
✅ Executive Dashboard with KPI Cards & 3 Embedded Charts
✅ 73 Blue-Coded Assumption Inputs – Change One Cell, Everything Updates
✅ Zero Formula Errors – Verified by Automated Recalculation Scan
✅ Works in Microsoft Excel & Google Sheets
This is not a generic financial model template.
This is a complete, parking-specific financial modeling system.
🎯 Who This Is For
• Parking lot developers and structured garage developers
• Private equity firms and infrastructure funds underwriting parking acquisitions
• Project finance lenders evaluating parking asset debt coverage
• REITs and institutional investors building parking portfolios
• Real estate financial analysts and consultants
• Parking operators building board-ready financial plans
• MBA and CFA candidates learning real estate financial modeling
• Urban developers and municipalities modeling mixed-use garage economics
• Fractional CFOs and boutique advisory firms serving parking clients
If you analyze, develop, finance, or operate parking assets – this was built for you.
🔥 Why Most Parking Financial Models Fail
Generic templates focus on:
• Simple revenue = last year × growth percentage
• No concept of parking spaces or utilization rates
• No ground lease or land lease economics
• No utilization ramp for newly opened facilities
• No event surge pricing or dynamic rate logic
• No garage construction CapEx per space
• No PP&E roll-forward or depreciation schedules
• No parking-specific KPIs or unit economics
This model fixes all of that – from the ground up.
📚 What's Inside – Every Tab, Every Formula
Tab 1: Dashboard
• 10 auto-updating KPI cards: Total Revenue, EBITDA, Net Income, Cash Balance, Total Spaces, Gross Margin %, EBITDA Margin %, Utilization Rate, Revenue per Space, Total Facilities
• 3 embedded charts: Revenue & EBITDA bar chart, Net Income & Cash line chart, Utilization rate trend
• Fully formula-driven – no manual data entry required
• Designed for investor presentations and board reporting
Tab 2: Assumptions
• 73 blue-coded input cells – the single source of truth for the entire model
• Section A – Deployment & Facility Metrics: facilities Year 1, new facilities per year, spaces per facility, % structured garages, operating hours, operating days
• Section B – Utilization & Pricing: Year 1–4 utilization ramp, hourly rate, daily rate, monthly permit fee, event premium multiplier, annual rate escalation, weekend demand premium, event days per year
• Section C – Cost of Revenue: ground rent per space, rent escalation rate, utilities per space, property tax rate, maintenance per space, security per facility, insurance per facility, payment processing rate, revenue share to landlord, cleaning costs
• Section D – Operating Expenses: headcount per facility, salaries by role, benefits percentage, corporate FTE count, technology costs, marketing as % of revenue, G&A as % of revenue
• Section E – CapEx & Depreciation: surface lot cost per space, structured garage cost per space, technology CapEx per facility, EV charger CapEx, maintenance CapEx as % of gross PP&E, useful lives for structures / equipment / technology
• Section F – Financing & Working Capital: opening equity raise, debt as % of CapEx, interest rate, loan amortization term, tax rate, DSO, DPO, deferred revenue months, minimum cash balance threshold
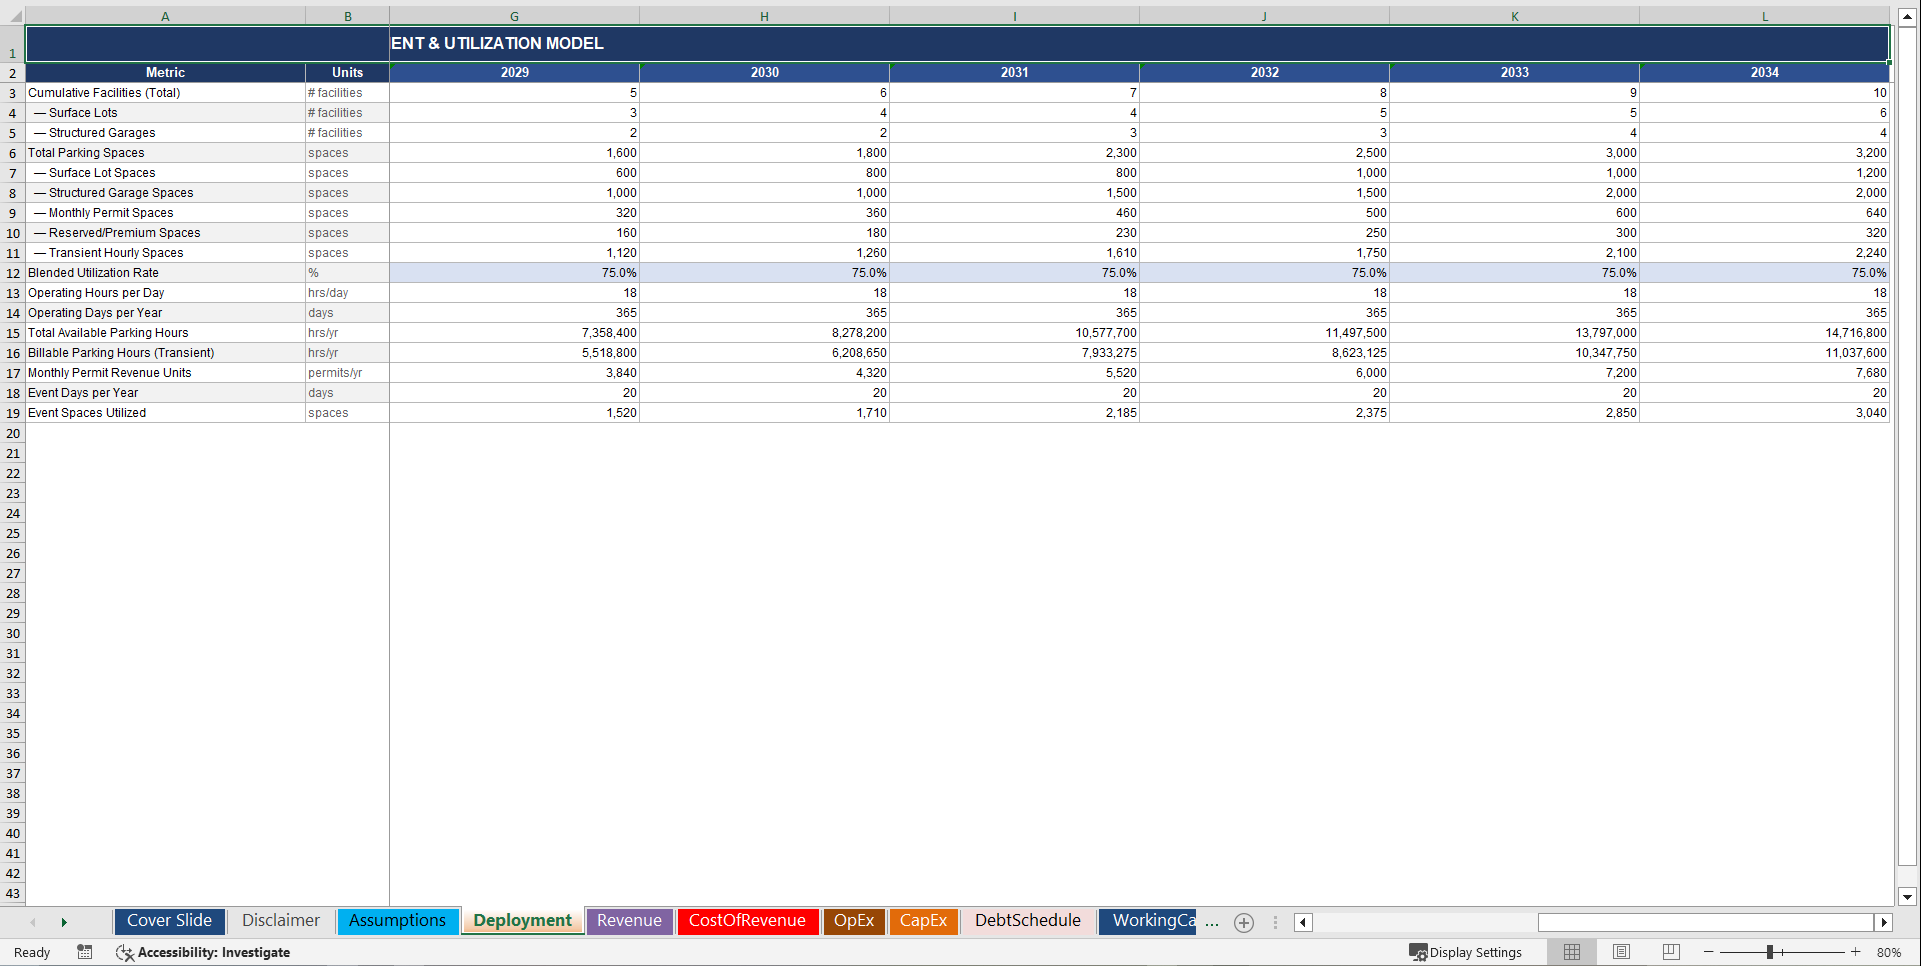
Tab 3: Deployment & Utilization Model
• Cumulative facility rollout schedule for all 10 years
• Automatic surface lot vs. structured garage split by year
• Total spaces broken out: transient hourly, monthly permit, reserved/premium
• Blended utilization rate per year with 4-year ramp curve
• Total available parking hours and total billable parking hours
• Monthly permit unit count for revenue calculation
• Event days and event space utilization per year
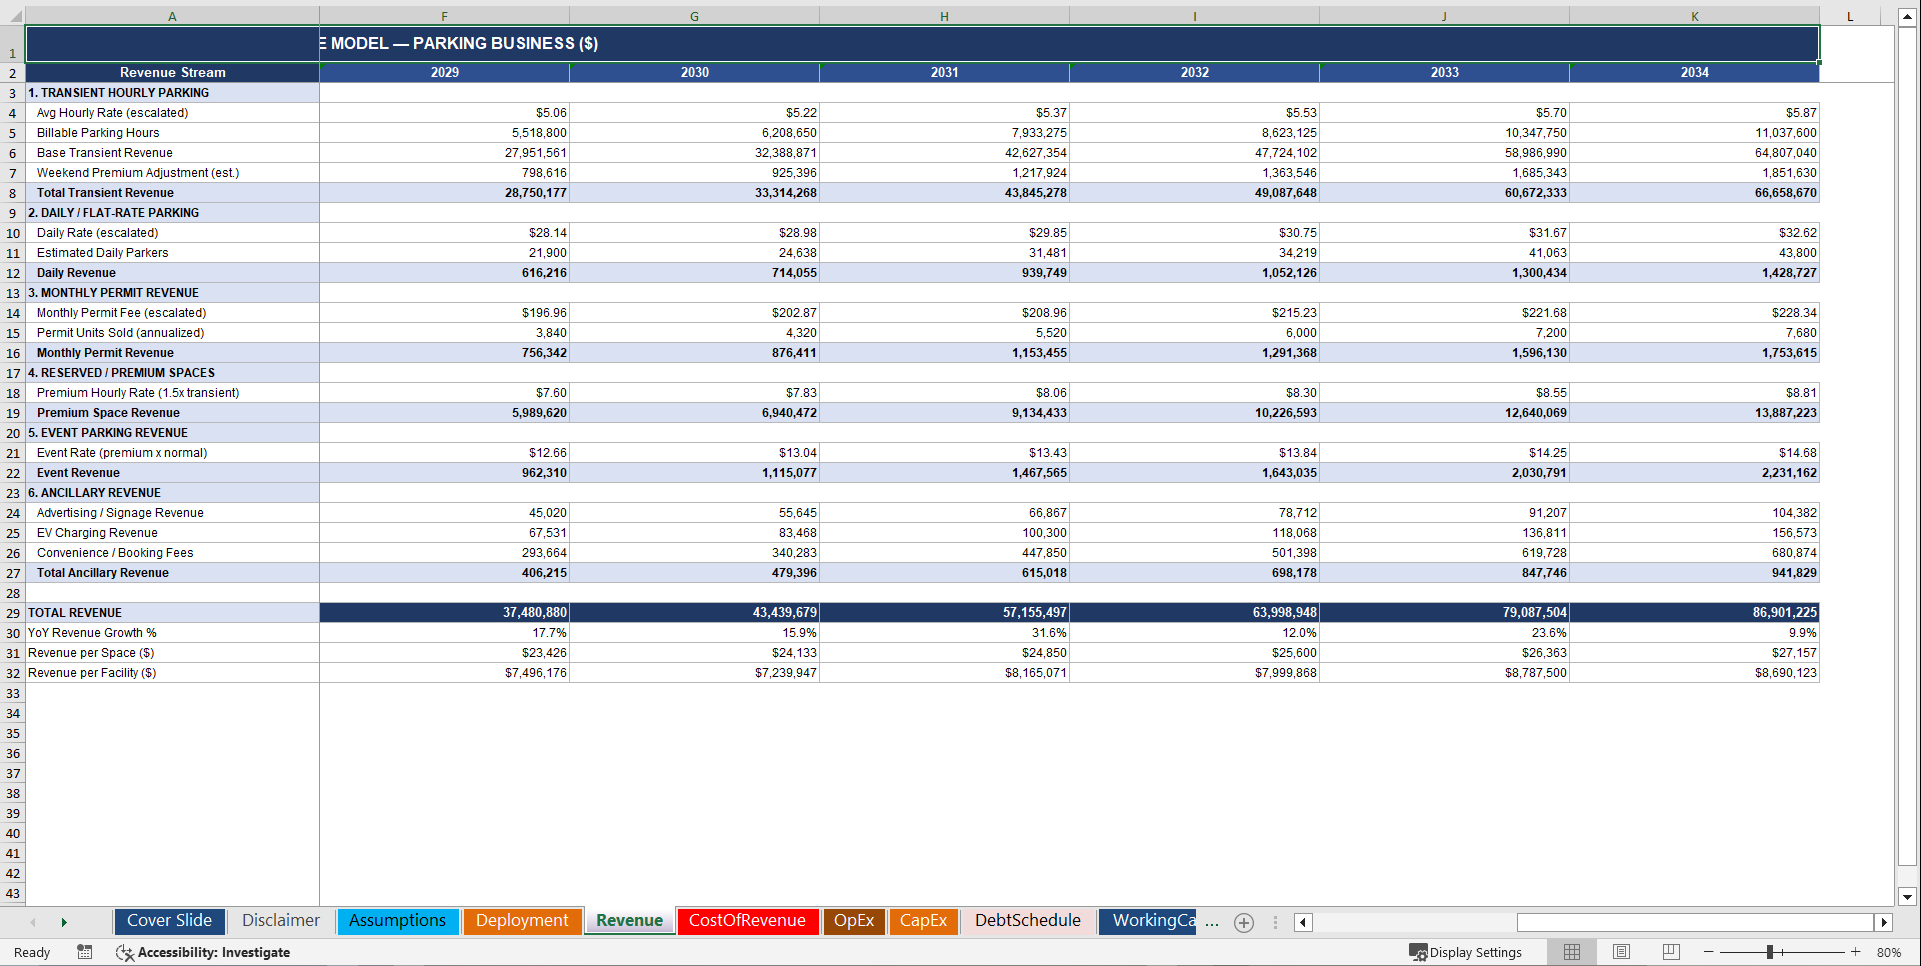
Tab 4: Revenue Model
• Revenue Stream 1 – Transient Hourly Parking: Spaces × Utilization % × Operating Hours × Days × Rate × Escalation Factor, plus weekend premium adjustment
• Revenue Stream 2 – Daily Flat-Rate Parking: Daily spaces × utilization × days × daily rate cap, escalated annually
• Revenue Stream 3 – Monthly Permit Revenue: Permit spaces × 12 × monthly fee × annual escalation – high-quality contracted income
• Revenue Stream 4 – Reserved / Premium Spaces: Reserved space count × hours × utilization × 1.5× standard rate
• Revenue Stream 5 – Event Parking: Event spaces × event days × average stay × (rate × event premium multiplier)
• Revenue Stream 6 – Ancillary Revenue: In-garage advertising ($8K/facility), EV charging revenue ($12K/facility), convenience & booking fees (1% of transient + daily revenue)
• Year-over-year revenue growth percentage
• Revenue per space and revenue per facility for benchmarking
Tab 5: Cost of Revenue Schedule
• 10 line-item COGS schedule fully driven by operational metrics
• Ground rent / lease cost escalated annually at configurable rate
• Property taxes as percentage of facility assessed value
• Utilities per space per year
• Maintenance cost per space per year
• Security cost per facility per year
• Insurance per facility per year
• Cleaning cost per facility per year
• Credit card and payment processing fees as % of revenue
• Revenue share payments to landlords as % of revenue
• Dynamic gross profit and gross margin % calculated automatically
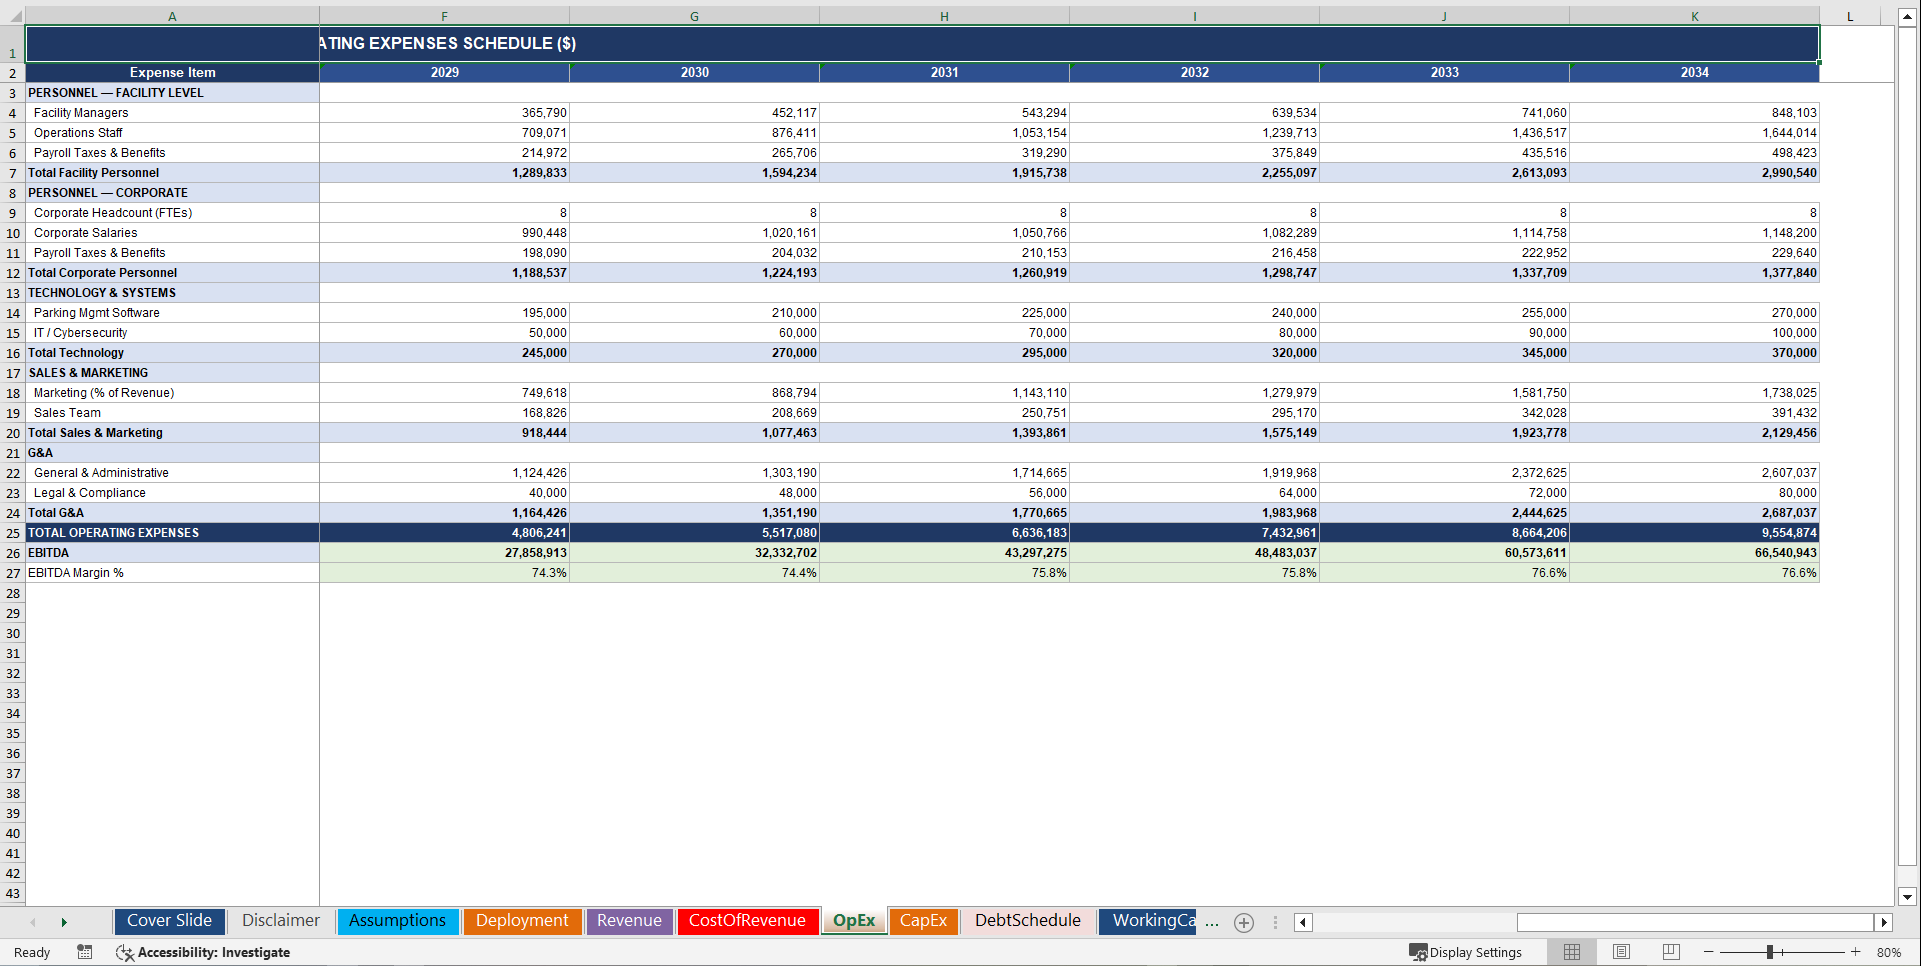
Tab 6: Operating Expenses
• Facility-level personnel: managers per facility × salary × headcount growth × benefits
• Operations staff per facility × salary × annual raises × benefits
• Corporate headcount with automatic FTE growth formula (adds 1 FTE per 3 new facilities)
• Corporate salary expense with annual escalation
• Technology & software: base cost + incremental per-facility growth
• IT and cybersecurity costs per facility
• Sales team costs with salary escalation
• Marketing expense as configurable % of revenue
• G&A expense as configurable % of revenue plus fixed legal & compliance
• EBITDA and EBITDA margin % output for every year
Tab 7: CapEx & Depreciation Schedule
• New facilities opened each year calculated automatically from deployment tab
• Surface lot paving CapEx: new surface facilities × spaces × cost per space
• Structured garage construction CapEx: new garage facilities × spaces × cost per space
• Technology CapEx per new facility (LPR systems, gate equipment, kiosks, cameras)
• EV charger installation CapEx per new facility
• Maintenance and replacement CapEx: % of prior year gross PP&E
• Total CapEx per year
• Full PP&E roll-forward: Beginning Gross PP&E + CapEx Additions = Ending Gross PP&E
• Cumulative accumulated depreciation roll-forward
• Net PP&E book value for all 10 years
• Depreciation Detail: Structures at 40-year straight-line, Equipment at 10-year straight-line, Technology at 5-year straight-line
Tab 8: Debt Schedule
• New project finance debt raised each year as % of CapEx
• Loan amortization repayment schedule over configurable term
• Beginning and ending debt balance roll-forward
• Average debt balance for interest calculation
• Annual interest expense linked directly to Income Statement
• Current portion of long-term debt separated for Balance Sheet
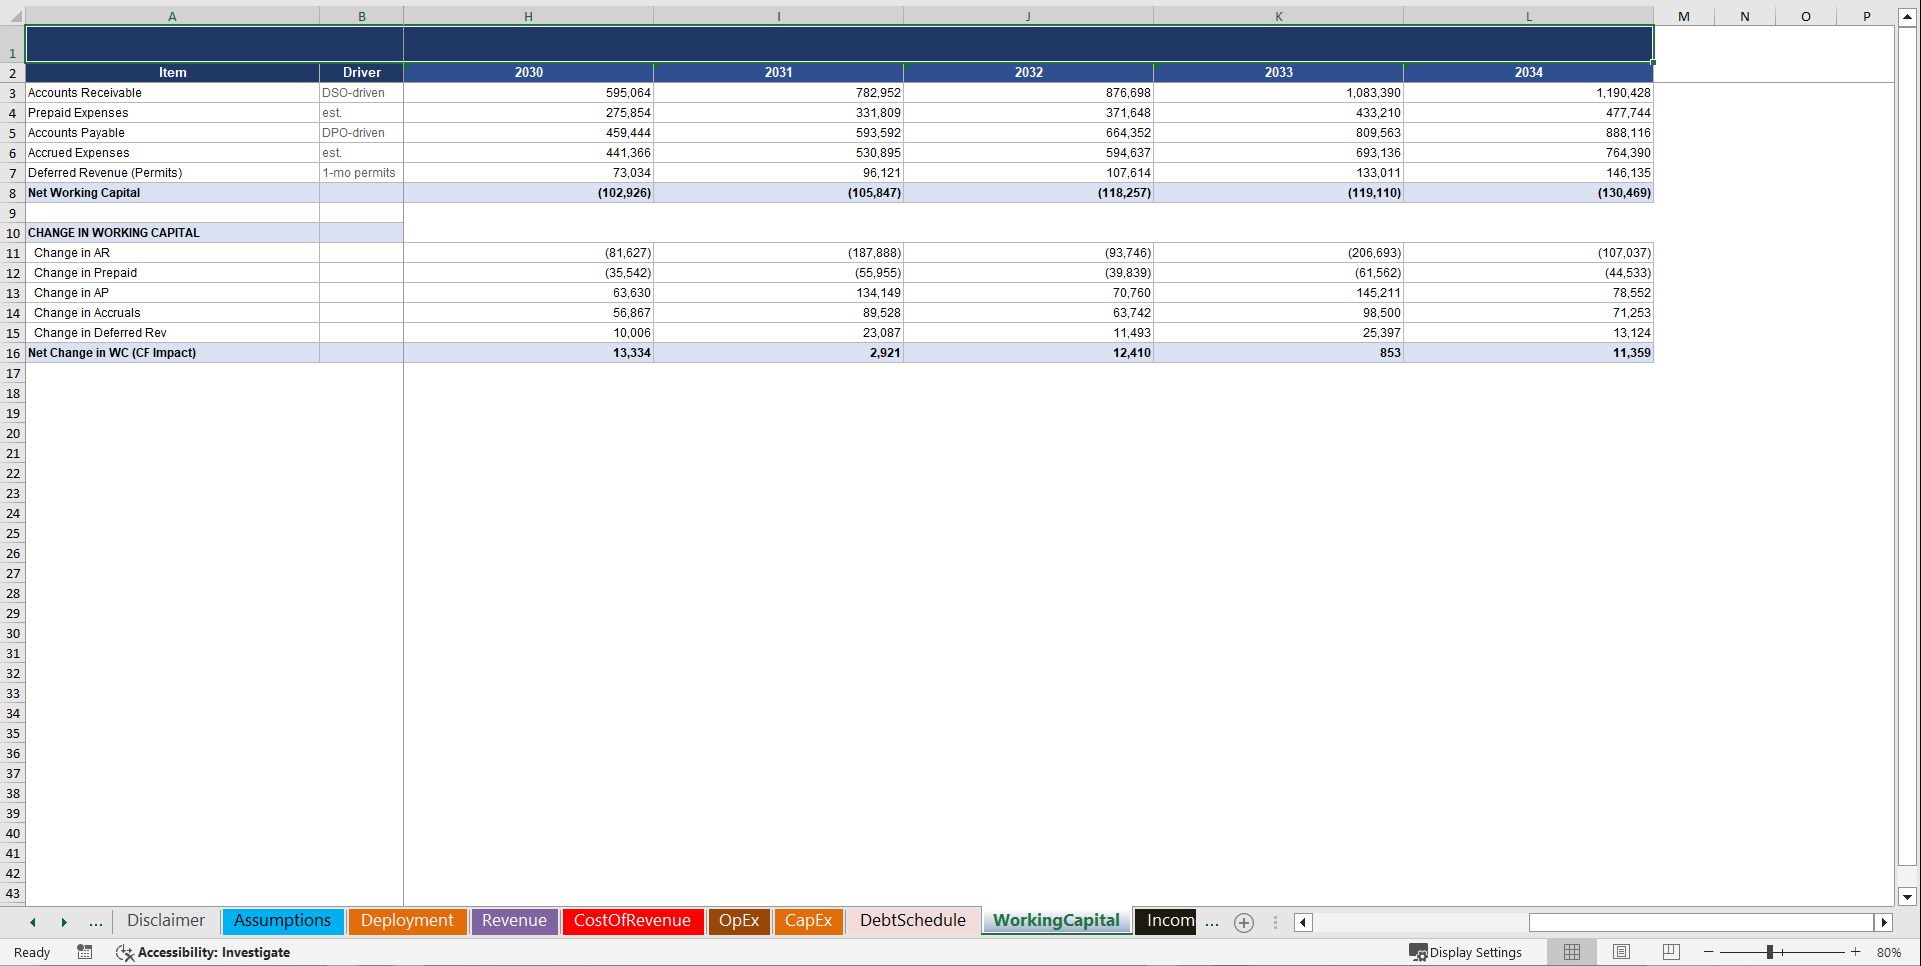
Tab 9: Working Capital Schedule
• Accounts Receivable: Revenue ÷ 365 × DSO days
• Prepaid Expenses: 5% of total operating expenses
• Accounts Payable: COGS ÷ 365 × DPO days
• Accrued Expenses: 8% of total operating expenses
• Deferred Revenue: monthly permit revenue ÷ 12 × deferred months assumption
• Net working capital balance for all 10 years
• Year-over-year changes in all working capital line items for cash flow statement
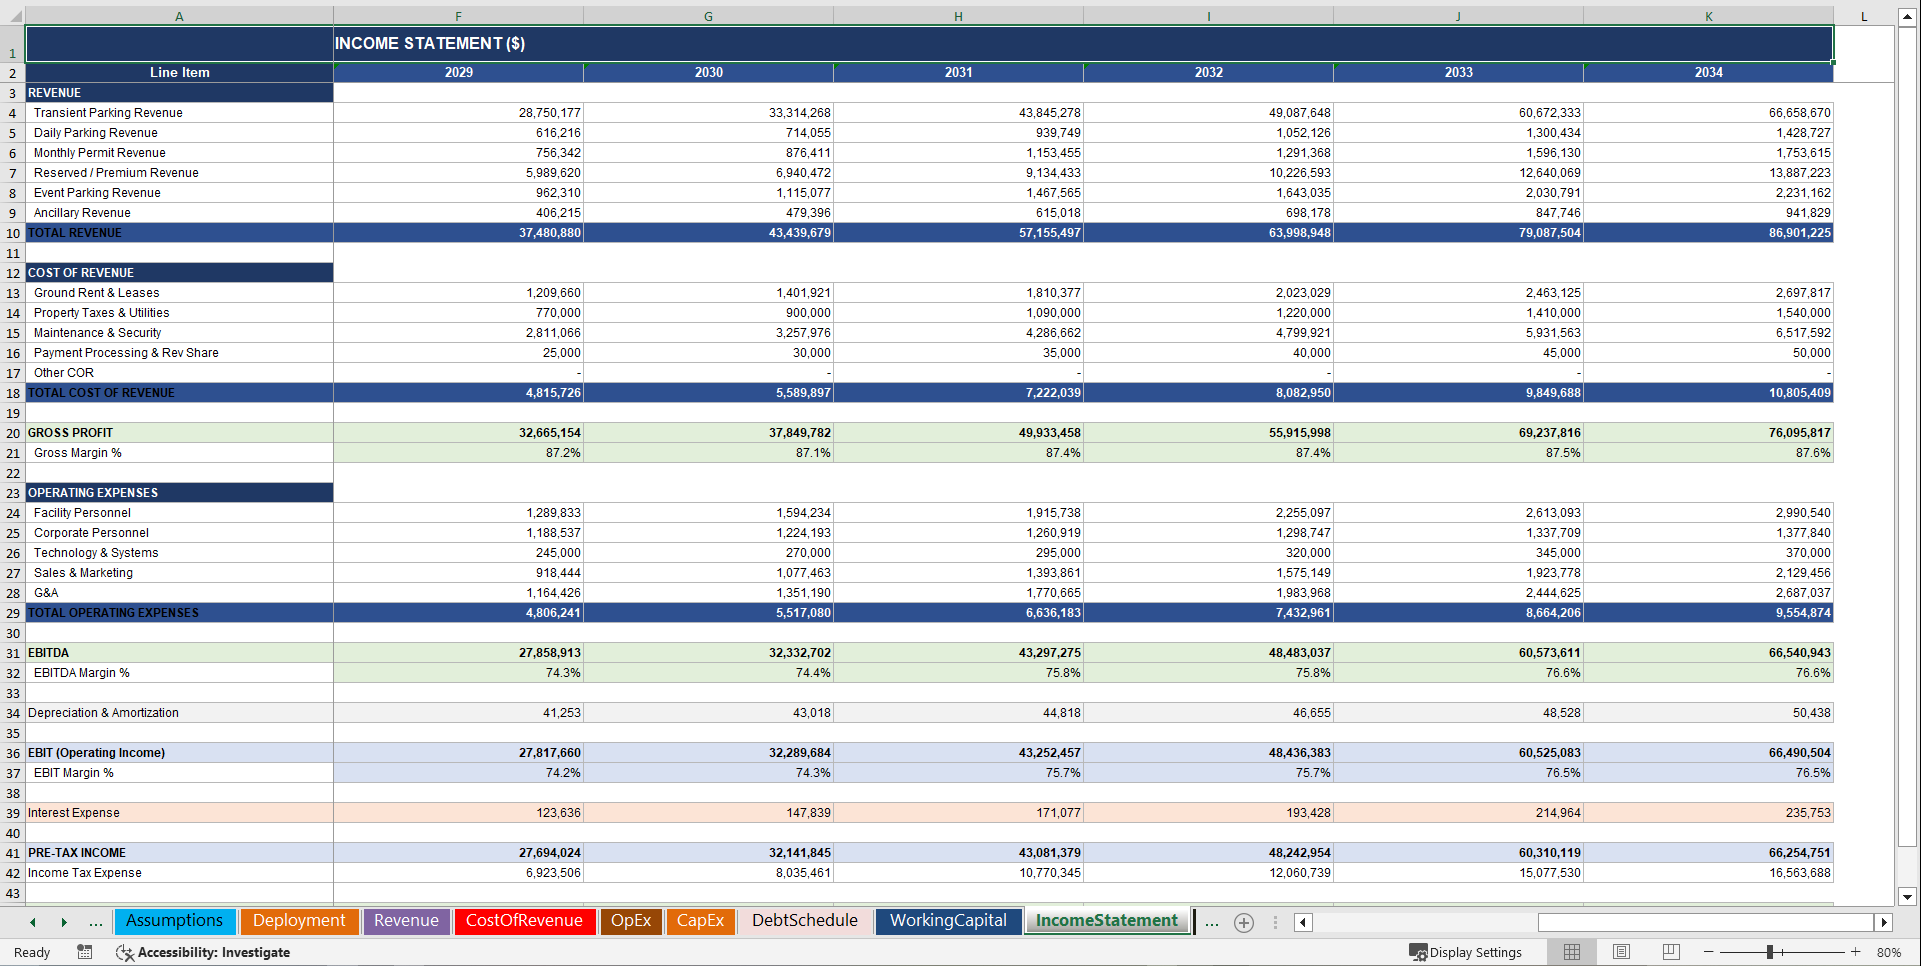
Tab 10: Income Statement
• Full GAAP-format P&L for Years 1–10
• Revenue: 6 streams aggregated from Revenue tab
• Cost of Revenue: 10 line items from COR schedule
• Gross Profit and Gross Margin %
• Total Operating Expenses from OpEx schedule
• EBITDA and EBITDA Margin %
• Depreciation & Amortization from CapEx schedule
• EBIT (Operating Income) and EBIT Margin %
• Interest Expense from Debt Schedule
• Pre-Tax Income
• Income Tax Expense at configurable rate
• Net Income and Net Margin %
Tab 11: Cash Flow Statement (Indirect Method)
• Operating Activities: Net Income + D&A + 5 working capital line adjustments
• Investing Activities: Total CapEx outflows
• Financing Activities: New debt raised, principal repayment, equity raise
• Net change in cash per year
• Beginning cash balance roll-forward
• Ending cash balance – hard-linked to Balance Sheet cash line
Tab 12: Balance Sheet
• Current Assets: Cash (from CFS), Accounts Receivable, Prepaid Expenses
• Non-Current Assets: Gross PP&E, Accumulated Depreciation, Net PP&E
• Current Liabilities: Accounts Payable, Accrued Expenses, Deferred Revenue, Current Debt
• Long-Term Debt
• Equity: Paid-in Capital, Retained Earnings (cumulative net income roll-forward)
• Total Assets = Total Liabilities + Equity – verified by built-in balance check formula every year
Tab 13: Sensitivity Analysis
• Table 1 – Utilization Rate × Hourly Rate EBITDA Matrix: 7 utilization scenarios (50%–90%) × 6 hourly rate scenarios ($3.00–$5.50) = 42-cell output matrix, color-coded by performance tier
• Table 2 – 6-Scenario Comparison: Base Case, High Occupancy, Recession / Low Demand, Construction Cost Inflation, Urban Demand Boom, Remote Work Impact – each showing Year 10 Revenue, EBITDA, EBITDA Margin, Net Income, Total Spaces, and Cash Balance
🔢 Excel Functions & Formula Mechanics Used
• SUM / SUMIF – revenue aggregation, CapEx totals, OpEx rollups
• IF / nested IF – year-1 ramp logic, zero-guard formulas eliminating all #DIV/0! errors, balance check pass/fail
• Power operator (^) – compound rate escalation: (1 + rate)^(Year − 1) for pricing, rents, and salaries
• MAX / MIN – debt repayment floor, utilization cap logic, CapEx floor calculations
• ROUND – whole-number facility counts and headcount to eliminate fractional spaces
• Cross-sheet formula links – every forecast tab references Assumptions!, Revenue!, CapEx!, DebtSchedule!, Deployment!
• PP&E roll-forward – Beginning + Additions − Depreciation = Ending, chained across all 10 years
• Retained earnings roll-forward – prior year balance + current year net income, auto-chained
• Working capital delta calculations – change in AR, AP, accruals, and deferred revenue for indirect CFS
• Balance check formula – =IF(ABS(Total Assets − Total Liabilities & Equity) < 1, "✓ Balanced", "✗ ERROR")
• Dynamic chart data table – dashboard charts reference a linked summary table that auto-refreshes
💎 PLUS: Sensitivity & Scenario Analysis Built In
This is NOT a static model with one set of outputs.
It includes:
1️⃣ Utilization × Rate EBITDA Sensitivity Table
42-cell matrix showing Year 5 EBITDA across every combination of utilization rate and hourly parking rate. Color-coded: green for high performance, orange for caution zones. Instantly reveals your breakeven utilization rate.
2️⃣ Six Full Business Scenarios
Base Case – conservative stabilized projections
High Occupancy – urban market with strong transient demand
Recession / Low Demand – stress test for downside protection
Construction Cost Inflation – CapEx overrun impact analysis
Urban Demand Boom – aggressive growth and expansion case
Remote Work Impact – reduced commuter and monthly permit demand
💰 Why This Model Is Different
This model delivers:
✔ Revenue built from parking spaces, utilization rates, and actual pricing – not guesswork
✔ Parking-specific cost structure: ground leases, maintenance cycles, security, enforcement
✔ Institutional-grade 3-statement integration – every number ties
✔ Fully transparent assumption architecture – one tab controls everything
✔ Project finance debt modeling with proper amortization schedules
✔ Sensitivity analysis for investor Q&A and lender stress testing
✔ Zero formula errors – verified by automated scan across all 1,879 formulas
It's built for real estate funds, infrastructure investors, project lenders, and parking developers – not generic business owners.
🧠 Built for Real Capital Decisions
This model helps you:
• Underwrite parking lot and garage acquisitions with institutional rigor
• Build a lender-ready financial package for project finance
• Present to private equity with a clean, fully linked 3-statement model
• Stress-test your assumptions before committing capital
• Understand your unit economics: revenue per space, EBITDA per facility, ROIC
• Compress months of modeling work into hours
Your financial model should answer investor questions before they ask them.
Now it does.
🚨 The Cost of NOT Having This
Every deal you analyze without a proper model risks:
• Overpaying for an asset due to weak underwriting
• Failing lender due diligence because your CFS doesn't tie
• Losing a raise because your projections aren't credible
• Spending $10,000–$25,000 on a consultant to build what you can own forever
One parking acquisition modeled correctly could return this investment hundreds of times over.
⚡ Stop Building From Scratch. Start Closing Deals.
If you're serious about:
• Underwriting parking investments with confidence
• Raising capital with an institutional-quality model
• Saving weeks of financial modeling time
• Presenting to lenders and investors with credibility
This model is your shortcut.
👉 Get the Parking Financial Model the Right Way
No hardcoded numbers.
No broken formulas.
No wasted weekends rebuilding from scratch.
Just a complete, verified, parking-specific 3-statement financial model – ready to use on your next deal.
Download the Parking Lot & Parking Garage Financial Model today – and underwrite your next deal with institutional confidence.
Keywords:
Parking lot financial model Excel, parking garage financial model template, parking financial model, parking business plan Excel, parking investment analysis spreadsheet, parking lot revenue model, structured parking garage model, parking 3-statement financial model, parking real estate underwriting model, parking EBITDA model, parking facility cash flow model, parking IRR analysis, parking acquisition model, parking permit revenue model, event parking revenue model, parking CapEx model, parking operating model, parking developer financial model, parking project finance model, parking sensitivity analysis, parking scenario analysis, parking investor model, parking lender model, parking fund model, parking PP&E depreciation model, real estate financial model Excel, real estate 3-statement model, real estate cash flow model, infrastructure financial model, real estate development model, real estate private equity model, real estate underwriting Excel, real estate project finance template, institutional financial model Excel, Excel financial model template, 3-statement financial model Excel, financial model with sensitivity analysis, financial model with scenario analysis, financial model with debt schedule, financial model with working capital, financial model with PP&E roll-forward, financial model with dashboard, advanced Excel financial model, parking lot investment, parking garage investment, parking asset acquisition, parking real estate, parking development pro forma, parking occupancy model, parking utilization model, parking dynamic pricing model, ground lease financial model, land lease financial model, surface lot model, structured garage model, airport parking model, urban parking model, mixed-use parking model, Strategy & Transformation, Growth Strategy, Strategic Planning, Strategy Frameworks, Innovation Management, Pricing Strategy, Core Competencies, Strategy Development, Business Transformation, Marketing Plan Development, Product Strategy, Breakout Strategy, Competitive Advantage, Mission, Vision, Values, Strategy Deployment & Execution, Innovation, Vision Statement, Core Competencies Analysis, Corporate Strategy, Product Launch Strategy, BMI, Blue Ocean Strategy, Breakthrough Strategy, Business Model Innovation, Business Strategy Example, Corporate Transformation, Critical Success Factors, Customer Segmentation, Customer Value Proposition, Distinctive Capabilities, Enterprise Performance Management, KPI, Key Performance Indicators, Market Analysis, Market Entry Example, Market Entry Plan, Market Intelligence, Market Research, Market Segmentation, Market Sizing, Marketing, Michael Porter's Value Chain, Organizational Transformation, Performance Management, Performance Measurement, Platform Strategy, Product Go-to-Market Strategy, Reorganization, Restructuring, SWOT, SWOT Analysis, Service 4.0, Service Strategy, Service Transformation, Strategic Analysis, Strategic Plan Example, Strategy Deployment, Strategy Execution, Strategy Frameworks Compilation, Strategy Methodologies, Strategy Report Example, Value Chain, Value Chain Analysis, Value Innovation, Value Proposition, Vision Statement, Corporate Strategy, Business Development, Business plan pdf, business plan, PDF, Business Plan DOC, Business Plan Template, PPT, Market strategy playbook, strategic market planning, competitive analysis tools, market segmentation frameworks, growth strategy templates, product positioning strategy, market execution toolkit, strategic alignment playbook, KPI and OKR frameworks, business growth strategy guide, cross-functional strategy templates, market risk management, market strategy PowerPoint doc, guide, ebook, e-book ,McKinsey Change Playbook, Organizational change management toolkit, Change management frameworks 2025, Influence model for change, Change leadership strategies, Behavioral change in organizations, Change management PowerPoint templates, Transformational leadership in change, supply chain KPIs, supply chain KPI toolkit, supply chain PowerPoint template, logistics KPIs, procurement KPIs, inventory management KPIs, supply chain performance metrics, manufacturing KPIs, supply chain dashboard, supply chain strategy KPIs, reverse logistics KPIs, sustainability KPIs in supply chain, financial supply chain KPIs, warehouse KPIs, digital supply chain KPIs, 1200 KPIs, supply chain scorecard, KPI examples, supply chain templates, Corporate Finance SOPs, Finance SOP Excel Template, CFO Toolkit, Finance Department Procedures, Financial Planning SOPs, Treasury SOPs, Accounts Payable SOPs, Accounts Receivable SOPs, General Ledger SOPs, Accounting Policies Template, Internal Controls SOPs, Finance Process Standardization, Finance Operating Procedures, Finance Department Excel Template, FP&A Process Documentation, Corporate Finance Template, Finance SOP Toolkit, CFO Process Templates, Accounting SOP Package, Tax Compliance SOPs, Financial Risk Management Procedures.
NOTE: Our digital products are sold on an "as is" basis, making returns and refunds unavailable post-download. Please preview and inquire before purchasing. Please contact us before purchasing if you have any questions! This policy aligns with the standard Flevy Terms of Usage.
Got a question about the product? Email us at support@flevy.com or ask the author directly by using the "Ask the Author a Question" form. If you cannot view the preview above this document description, go here to view the large preview instead.
Source: Best Practices in Integrated Financial Model Excel: Parking Lot 10-Year 3 Statement Financial Model Excel (XLSX) Spreadsheet, SB Consulting
ABOUT THE AUTHOR
SB Consulting is dedicated to empowering businesses to communicate their ideas with impact. This consulting firm specializes in teaching organizations how to create effective corporate and management presentations. With training from top-tier global consulting firms, including McKinsey, BCG, and Porsche Consulting, extensive expertise in presentation design and ... [read more]
Ask the Author a Question
You must be logged in to contact the author.
