
 Click main image to view in full screen. Unlock all 14 preview images:
Oil & Gas Upstream and Downstream Model – Excel XLSX
Excel (XLSX) + supplemental PDF


BENEFITS OF THIS DOWNLOADABLE EXCEL DOCUMENT
- Provides a complete 30-year integrated oil and gas financial model covering upstream production, downstream refining, financial statements, valuation, and investor returns.
- Helps users analyze commodity price exposure, refining margin sensitivity, CapEx requirements, debt serviceability, project NPV, project IRR, equity NPV, and equity IRR.
- Includes dashboards, sensitivity analysis, and automated audit checks to support investment review, lender analysis, and management decision-making.
OIL & GAS EXCEL DESCRIPTION
🛢️ Oil & Gas Upstream and Downstream 30-Year Financial Model
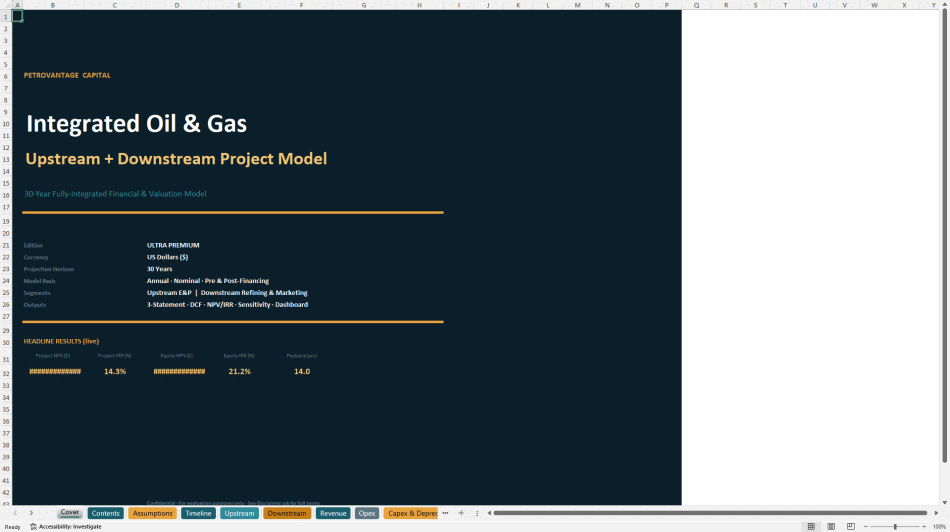
The Oil & Gas Upstream and Downstream 30-Year Financial Model is a premium Excel-based financial model built for analyzing an integrated oil and gas business across both upstream exploration and production and downstream refining and marketing operations.
This model is designed for users who need a structured way to evaluate long-term petroleum project economics, production volumes, refinery throughput, commodity price exposure, operating costs, capital expenditure, financing structure, working capital, 3-statement financial performance, valuation, and investor returns.
Unlike a simple revenue forecast, this workbook connects operational drivers with financial outputs. It allows users to model oil production, gas production, decline curves, royalties, lifting costs, refinery utilization, crack spreads, marketing margins, product revenue, crude feedstock cost, OPEX, CapEx, debt financing, cash flow, balance sheet impact, valuation, and return metrics over a 30-year forecast horizon.
⚡ What This Model Is Used For
This model is used to assess the financial feasibility, commercial attractiveness, funding requirement, and investment return profile of an integrated oil and gas project.
It helps users answer important questions such as:
✅ What are the projected upstream oil and gas volumes over the forecast period?
✅ How do production plateau and decline assumptions affect long-term revenue?
✅ What is the impact of Brent crude price, gas price, and commodity escalation?
✅ How much revenue is generated from upstream production and downstream refining?
✅ How do refinery utilization, crack spread, and marketing margin drive downstream EBITDA?
✅ What is the full CapEx, depreciation, debt, and working capital impact?
✅ What are the projected income statement, cash flow, and balance sheet outputs?
✅ What are the project NPV, project IRR, equity NPV, equity IRR, payback, and DSCR?
✅ How sensitive is valuation to Brent crude price and refining crack spread?
✅ Does the model pass internal audit and integrity checks?
🔥 Core Model Features
1. 30-Year Integrated Forecast
The workbook includes a 30-year forecast structure that supports long-term oil and gas project evaluation. This is especially useful because oil and gas assets often require long development timelines, capital-intensive infrastructure, multi-year production profiles, and extended operating lives.
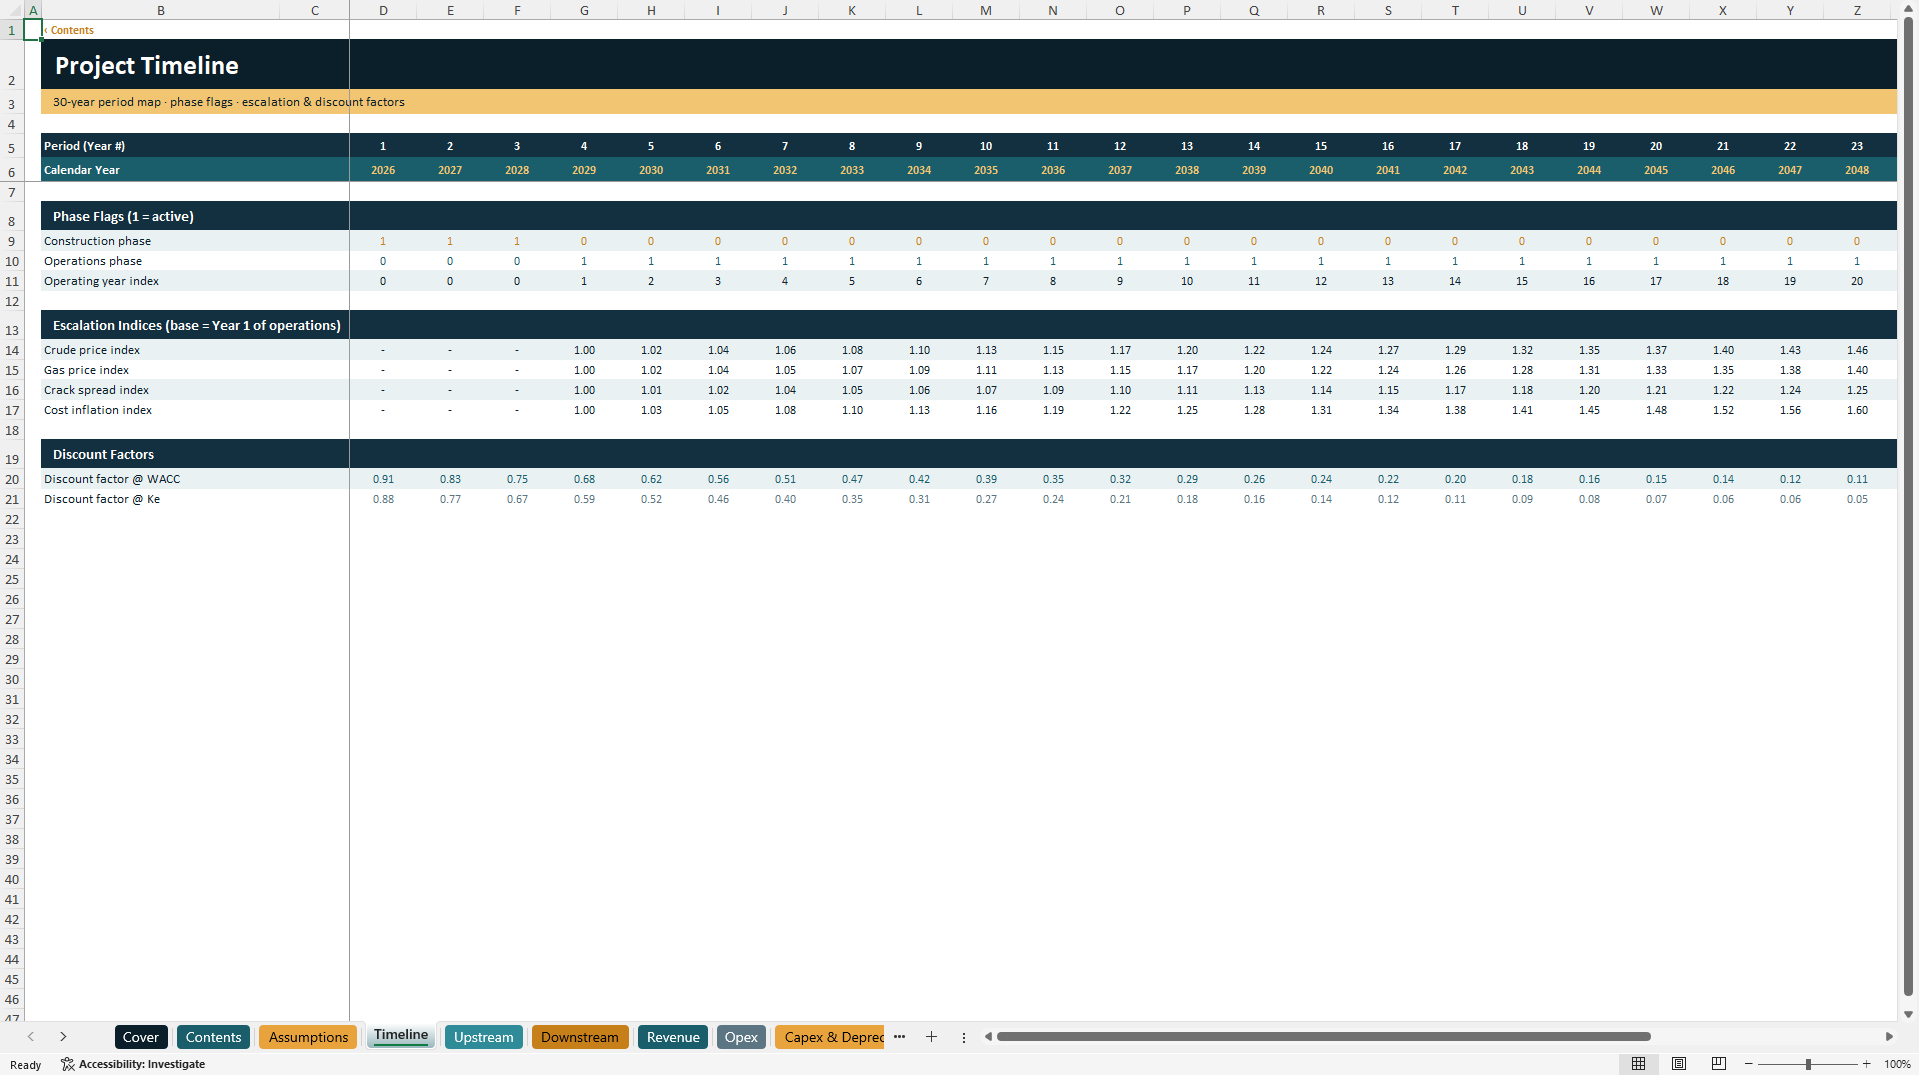
The model includes a timeline sheet that separates development, construction, ramp-up, operating years, and long-term forecast years.
2. Upstream Exploration and Production Module
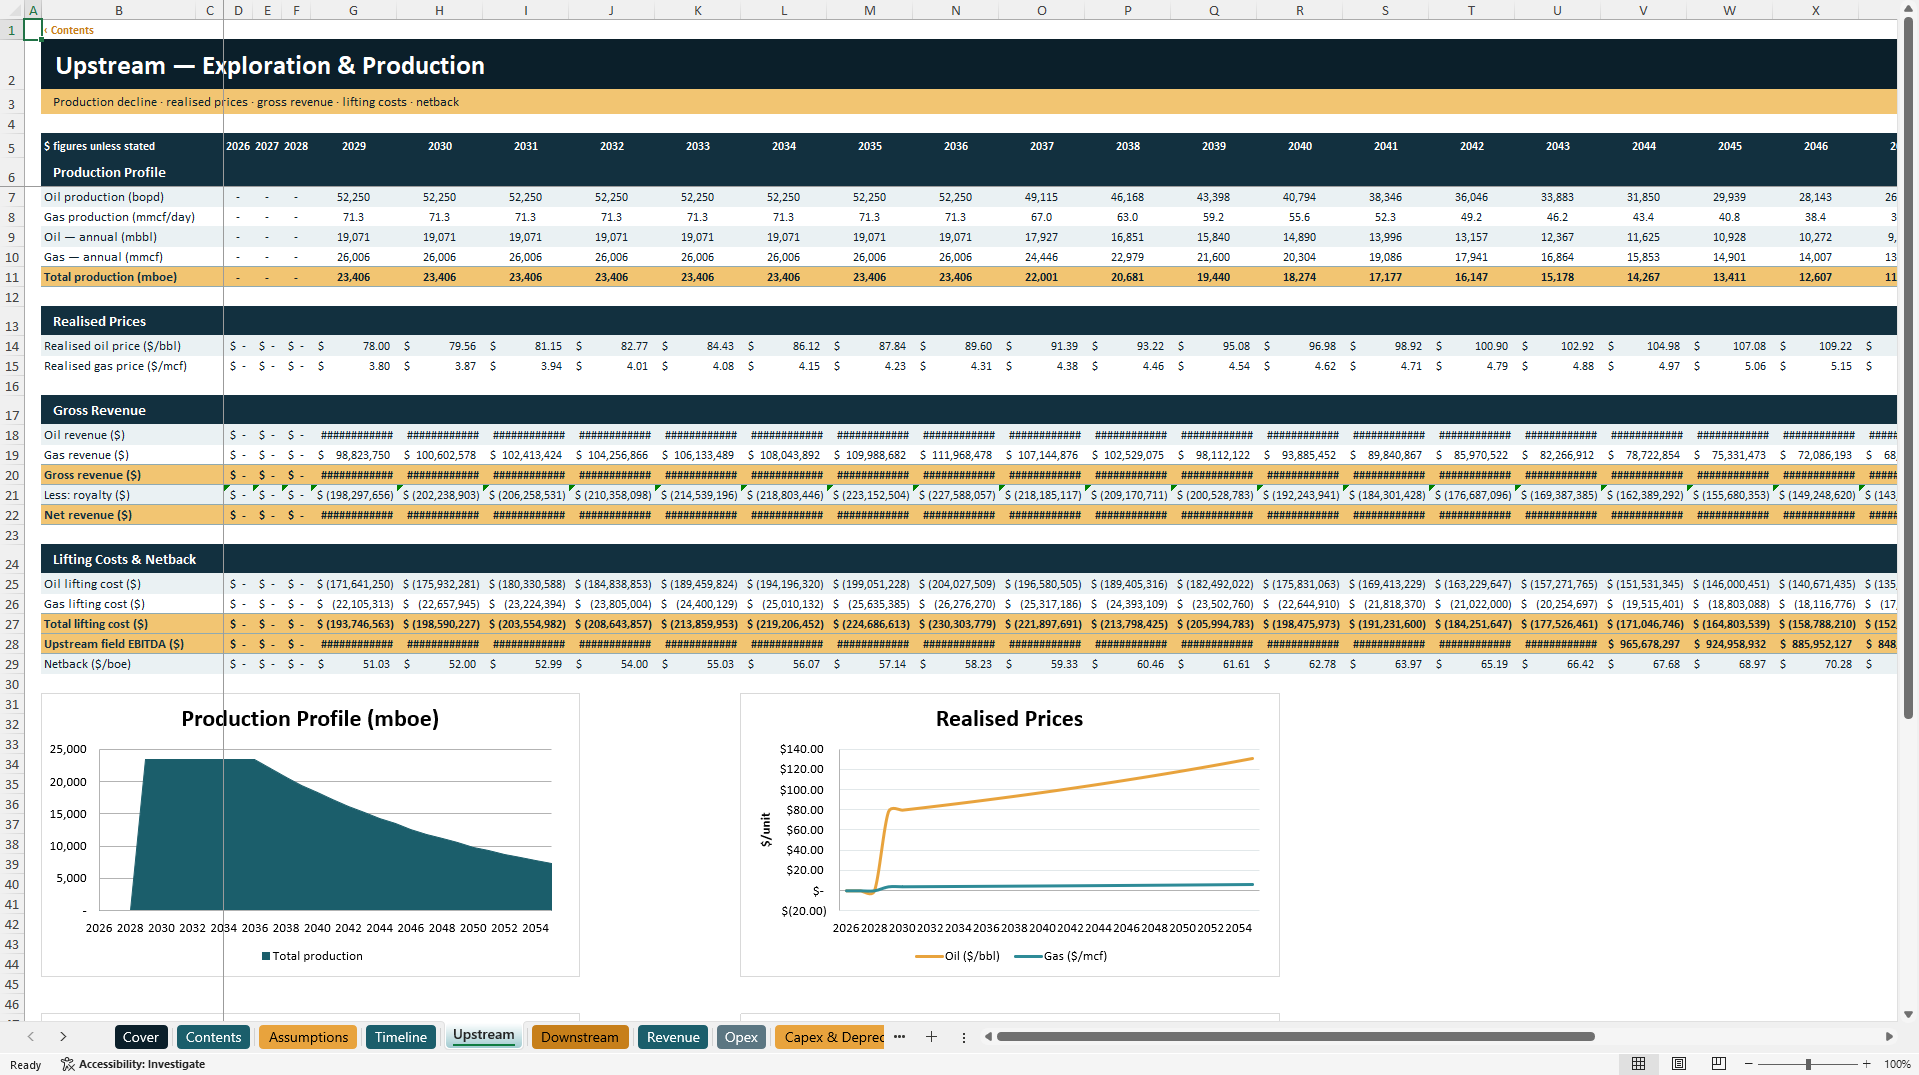
The upstream module models oil and gas production based on operating assumptions such as:
🔹 Initial oil production
🔹 Initial gas production
🔹 Plateau period
🔹 Post-plateau annual decline rate
🔹 Uptime / availability
🔹 Oil annual production
🔹 Gas annual production
🔹 Total production in mboe
🔹 Realized oil and gas prices
🔹 Royalty deduction
🔹 Lifting cost
🔹 Upstream field EBITDA
🔹 Netback per boe
This allows users to understand how upstream production performance flows into revenue, operating margin, EBITDA, and valuation.
3. Downstream Refining and Marketing Module
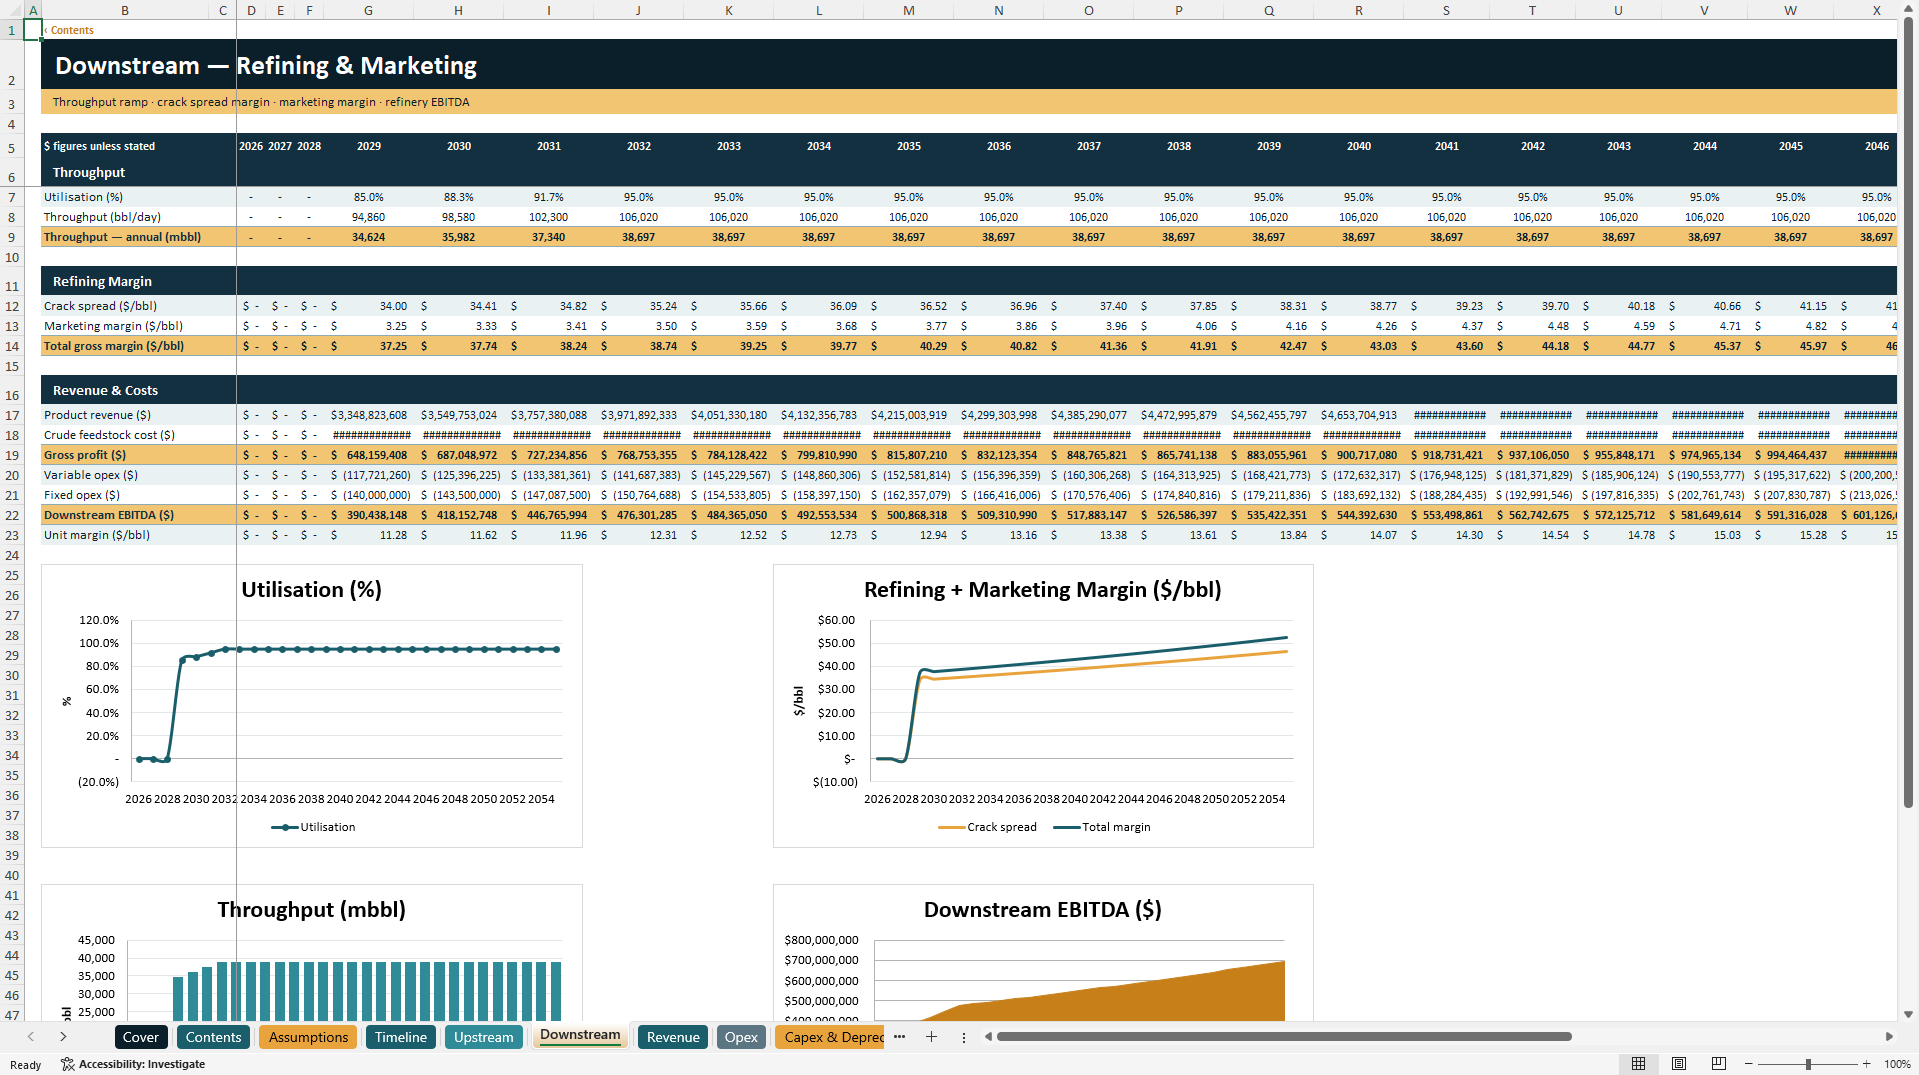
The downstream module analyzes refinery operations and marketing economics. It includes refinery nameplate capacity, utilization ramp-up, throughput, crack spread, marketing margin, product revenue, crude feedstock cost, variable OPEX, fixed OPEX, gross profit, downstream EBITDA, and unit margin.
This is important because downstream economics are driven by throughput, utilization, crude input cost, product pricing, refining margins, and operating efficiency.
4. Commodity Price and Margin Assumptions
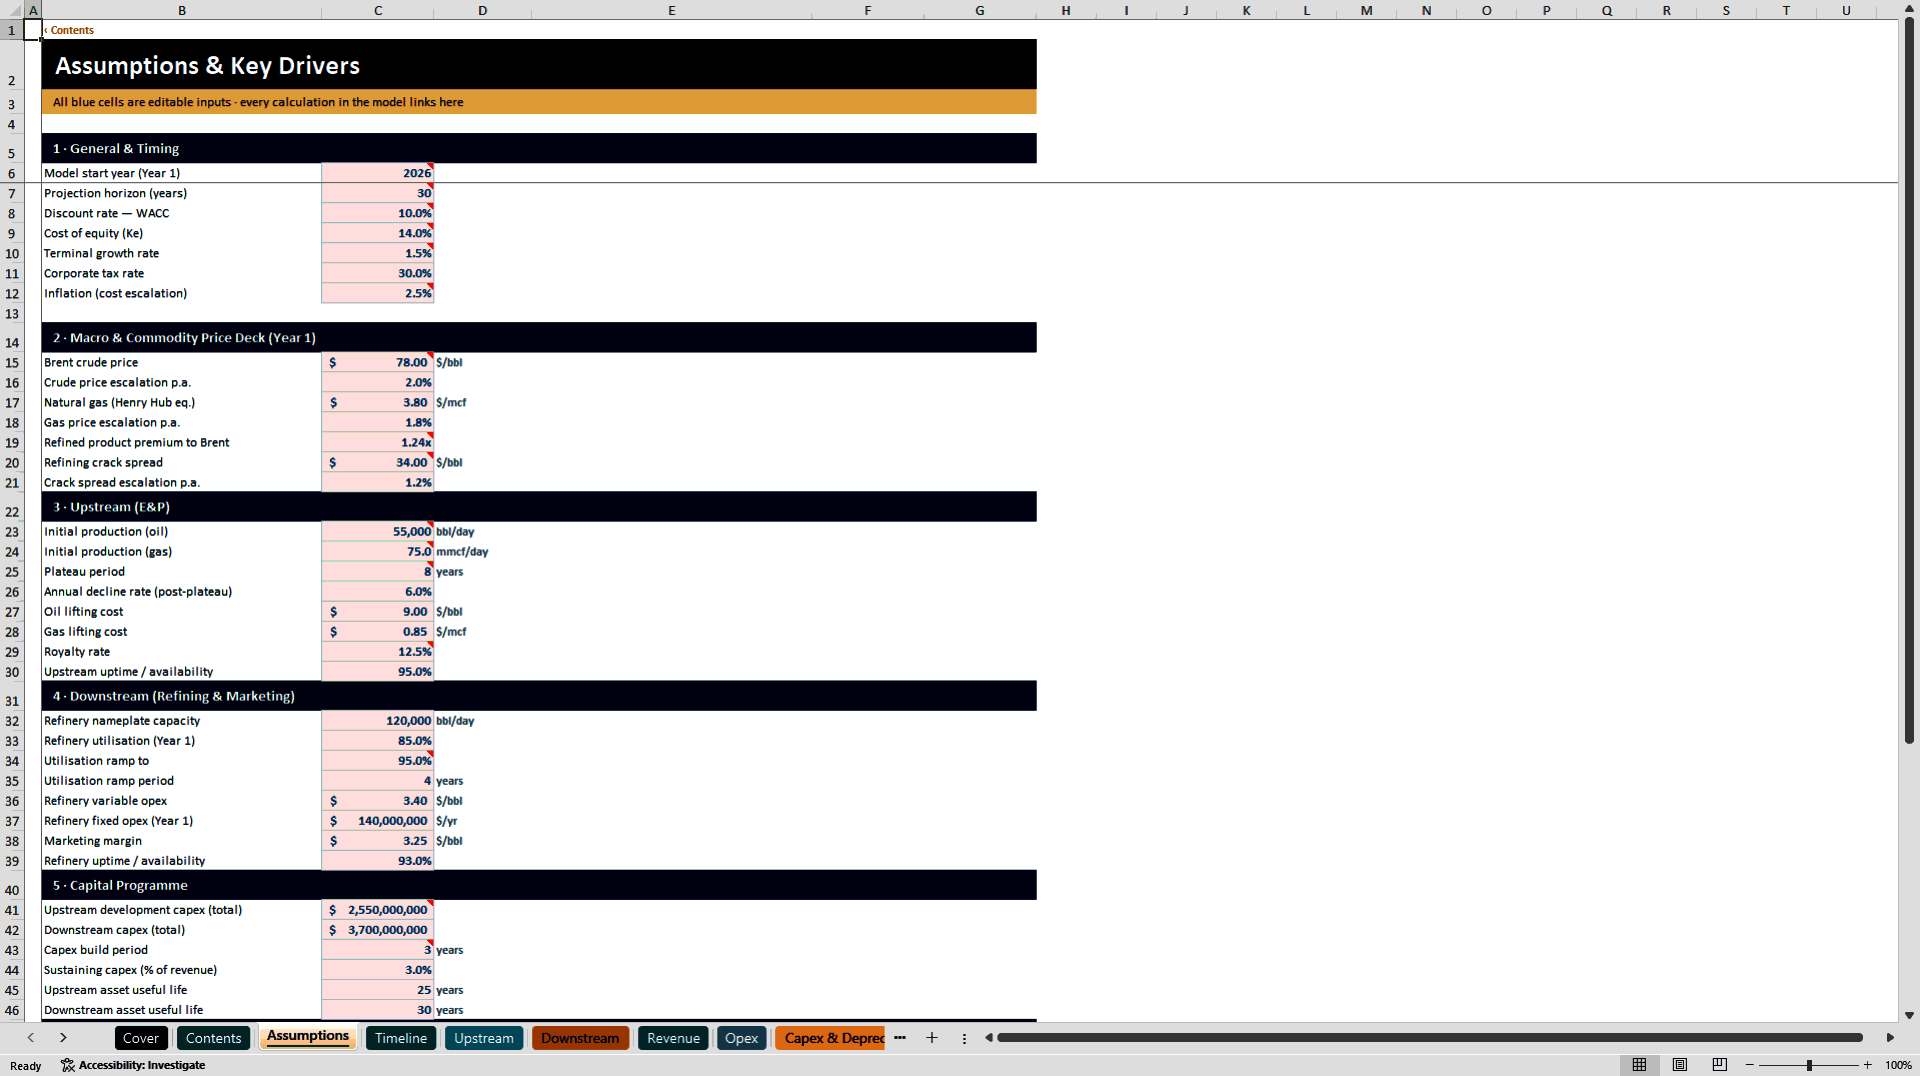
The assumptions section includes a macro and commodity price deck covering Brent crude price, crude price escalation, natural gas pricing, gas price escalation, refined product premium to Brent, refining crack spread, and crack spread escalation.
This gives users a transparent way to test how oil price, gas price, and refining margin assumptions affect project economics.
5. Revenue, OPEX, CapEx, and Depreciation
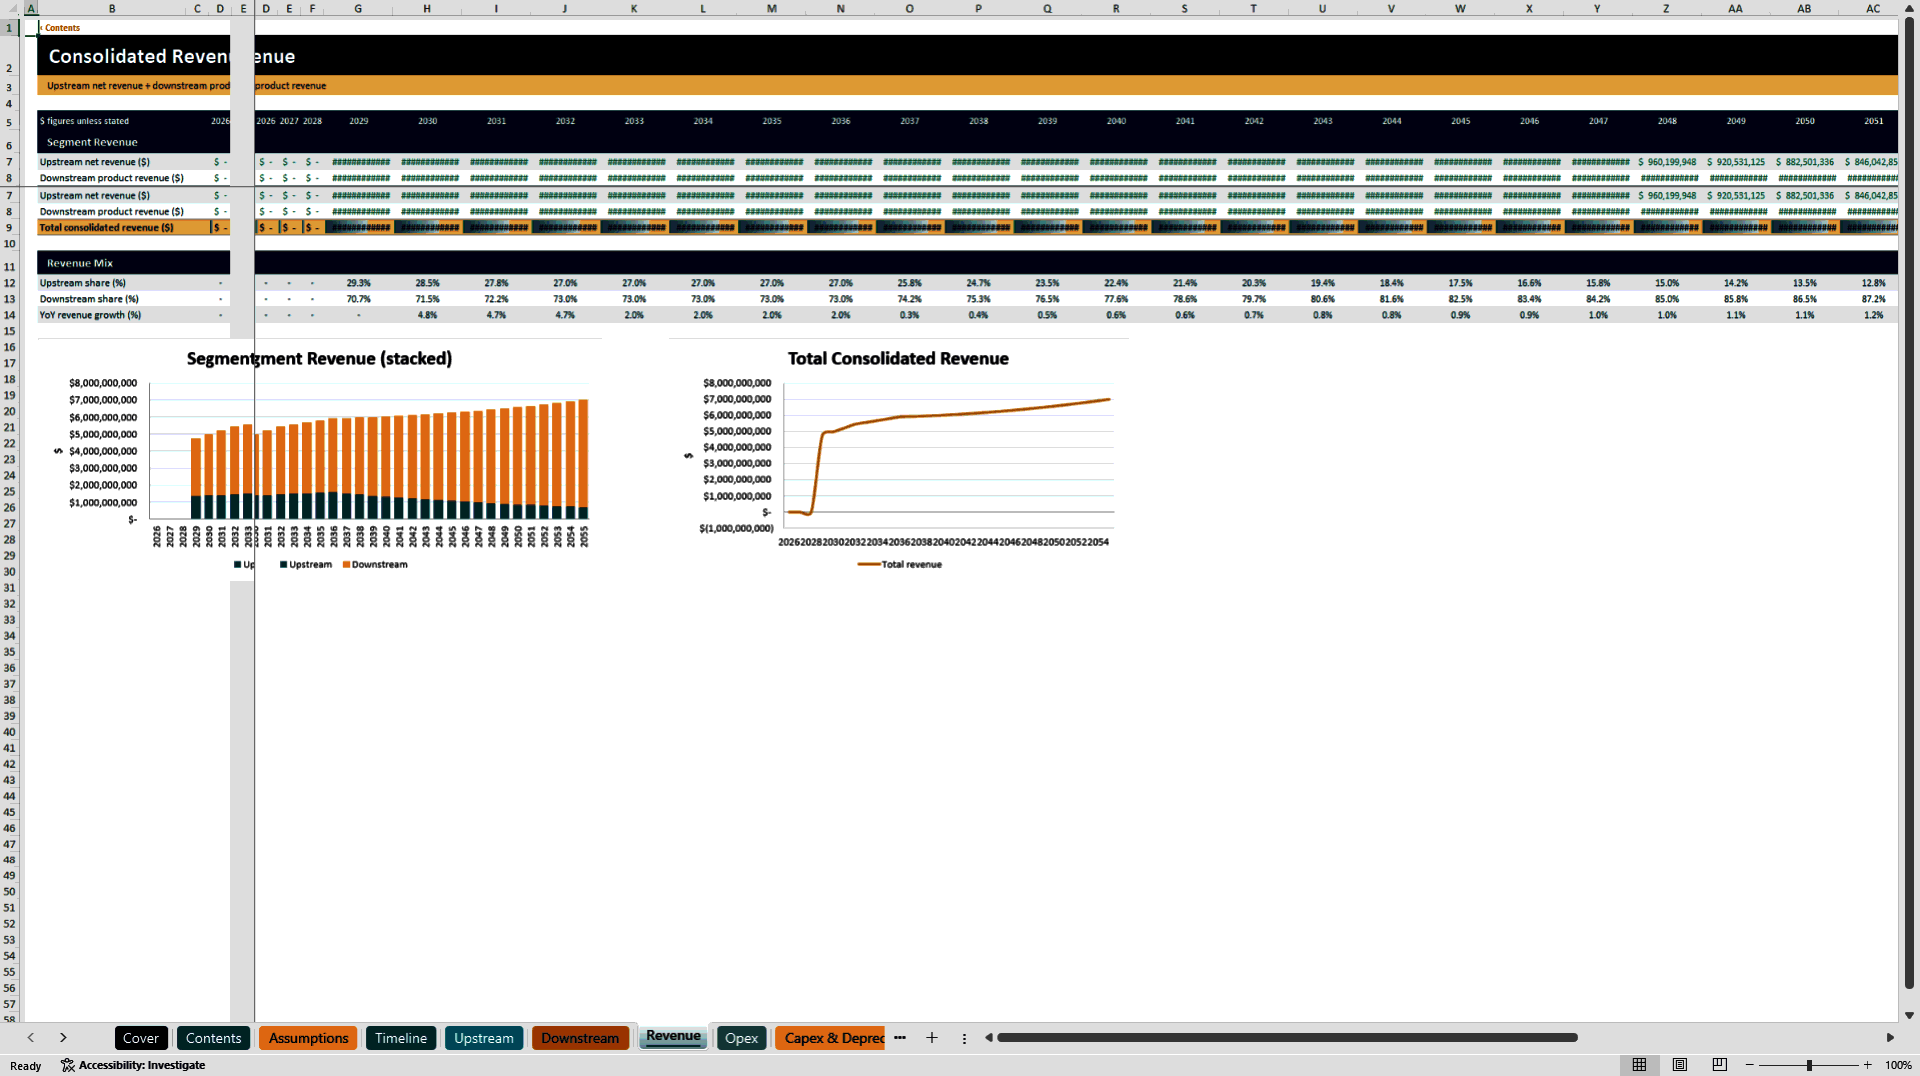
The model includes dedicated sheets for revenue build-up, operating cost build-up, CapEx, and depreciation. This structure allows users to review the drivers behind the forecast instead of seeing only final financial statements.
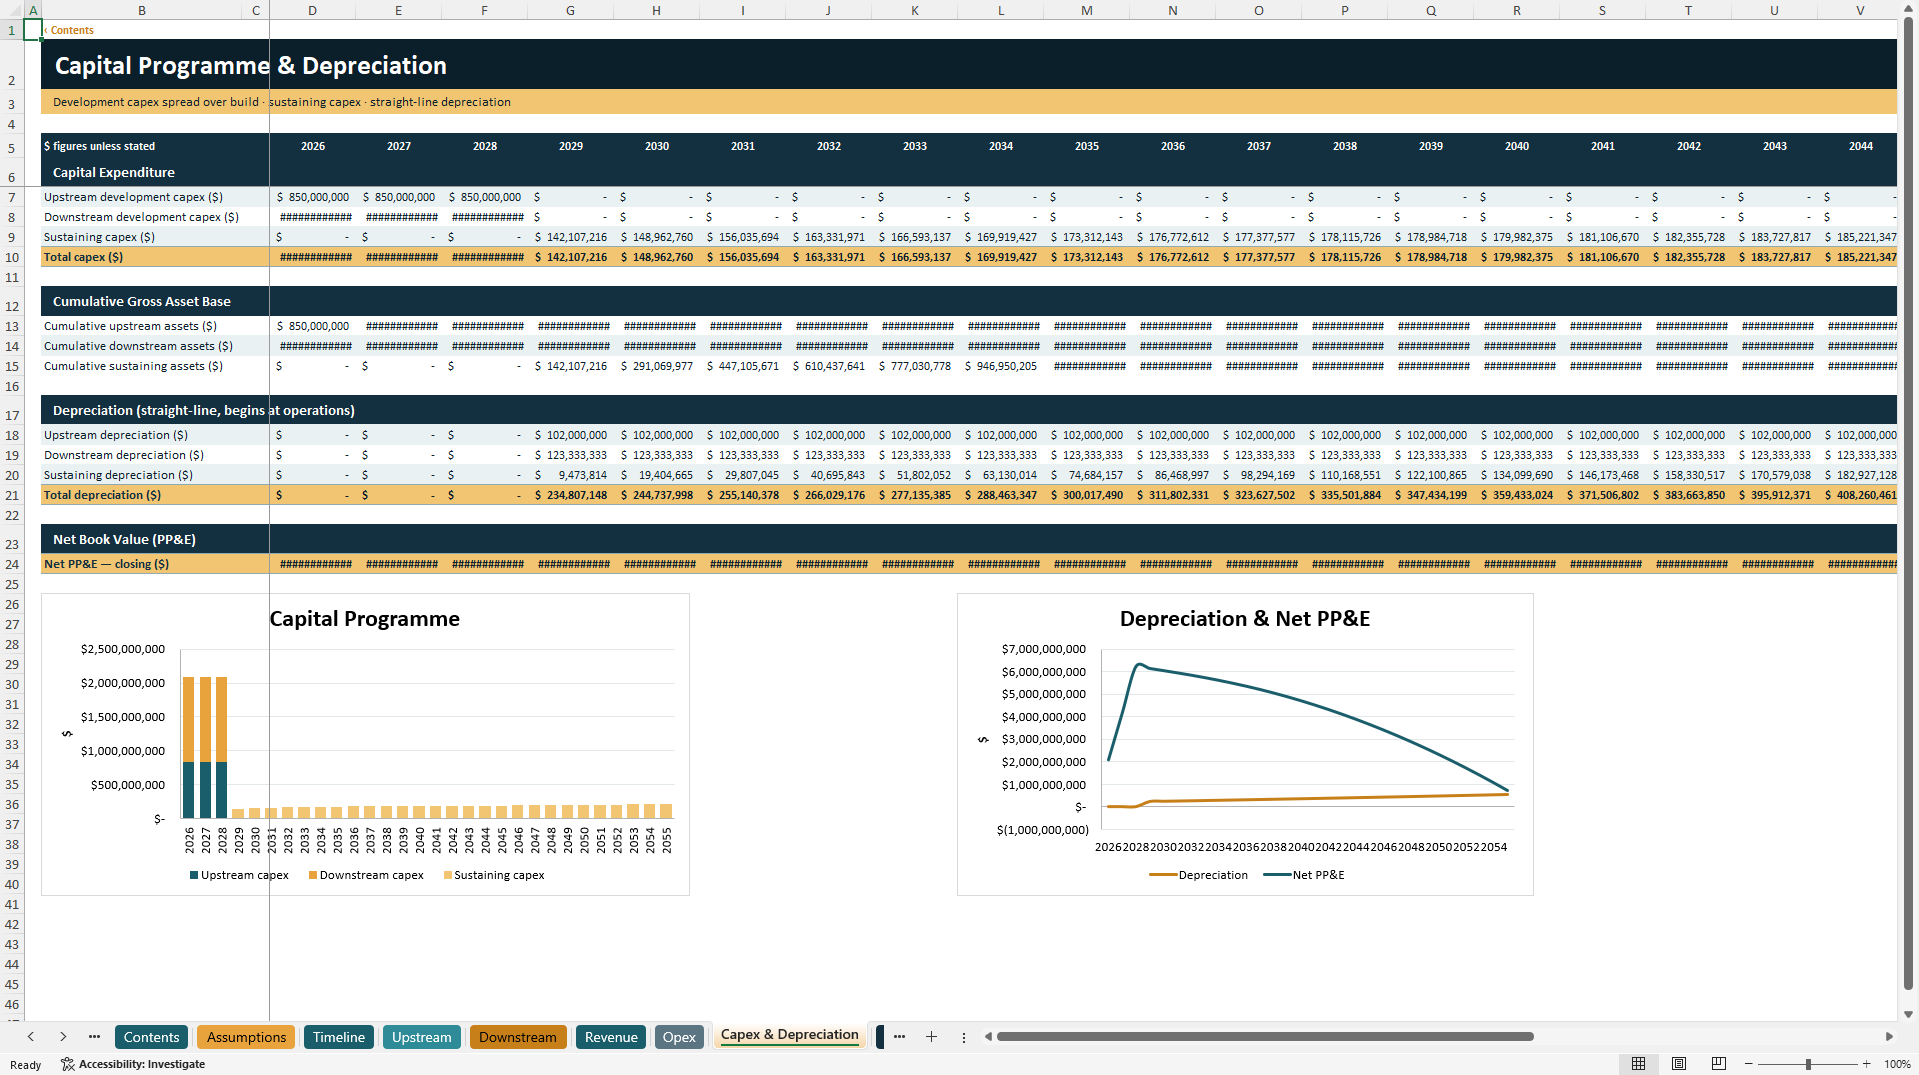
The CapEx and depreciation module supports long-term capital planning and asset base forecasting, while the OPEX module helps separate upstream and downstream operating cost drivers.
6. Financing and Working Capital
The financing module helps users evaluate project debt, equity contribution, debt facility size, interest, amortization, and debt service coverage.
The working capital module connects operating activity to balance sheet and cash flow outcomes. This is important for oil and gas businesses because receivables, payables, inventory, and working capital timing can materially affect cash flow.
7. Integrated 3-Statement Forecast
The workbook includes a full financial statement structure:
📌 Income Statement
📌 Cash Flow Statement
📌 Balance Sheet
This makes the model more useful than a simple project cash flow file. Users can review revenue, EBITDA, depreciation, EBIT, interest, tax, net income, operating cash flow, investing cash flow, financing cash flow, debt, cash, PP&E, equity, and balance sheet integrity.
8. Valuation and Investor Returns
The valuation sheet includes project-level and equity-level return outputs, including:
💰 Project NPV
💰 Project IRR
💰 Equity NPV
💰 Equity IRR
💰 Terminal value
💰 Undiscounted FCFF
💰 Lifetime revenue
💰 Total CapEx program
💰 Peak funding requirement
💰 NPV / CapEx multiple
💰 Discounted payback
💰 Minimum DSCR
💰 Average operating EBITDA margin
These outputs help users assess whether the integrated oil and gas project creates value and whether the debt structure is serviceable.
9. Sensitivity Analysis
The model includes a sensitivity analysis sheet with a two-way NPV grid for Brent crude price and refining crack spread.
It also includes single-variable valuation swings to help users understand the impact of commodity prices and refining margins on project NPV.
This is essential because oil and gas projects are highly exposed to market pricing, commodity cycles, refining spreads, and margin volatility.
10. Dashboard and Automated Audit Checks
The model includes an executive dashboard summarizing key project KPIs, segment economics, returns, and long-term trajectory.
It also includes an automated audit sheet with integrity checks covering balance sheet balance, closing cash, debt amortization, DSCR, IRR versus WACC, positive NPV, revenue linkage, cash linkage, and PP&E logic.
This gives users more confidence when reviewing the model outputs.
🧭 How to Use This Model
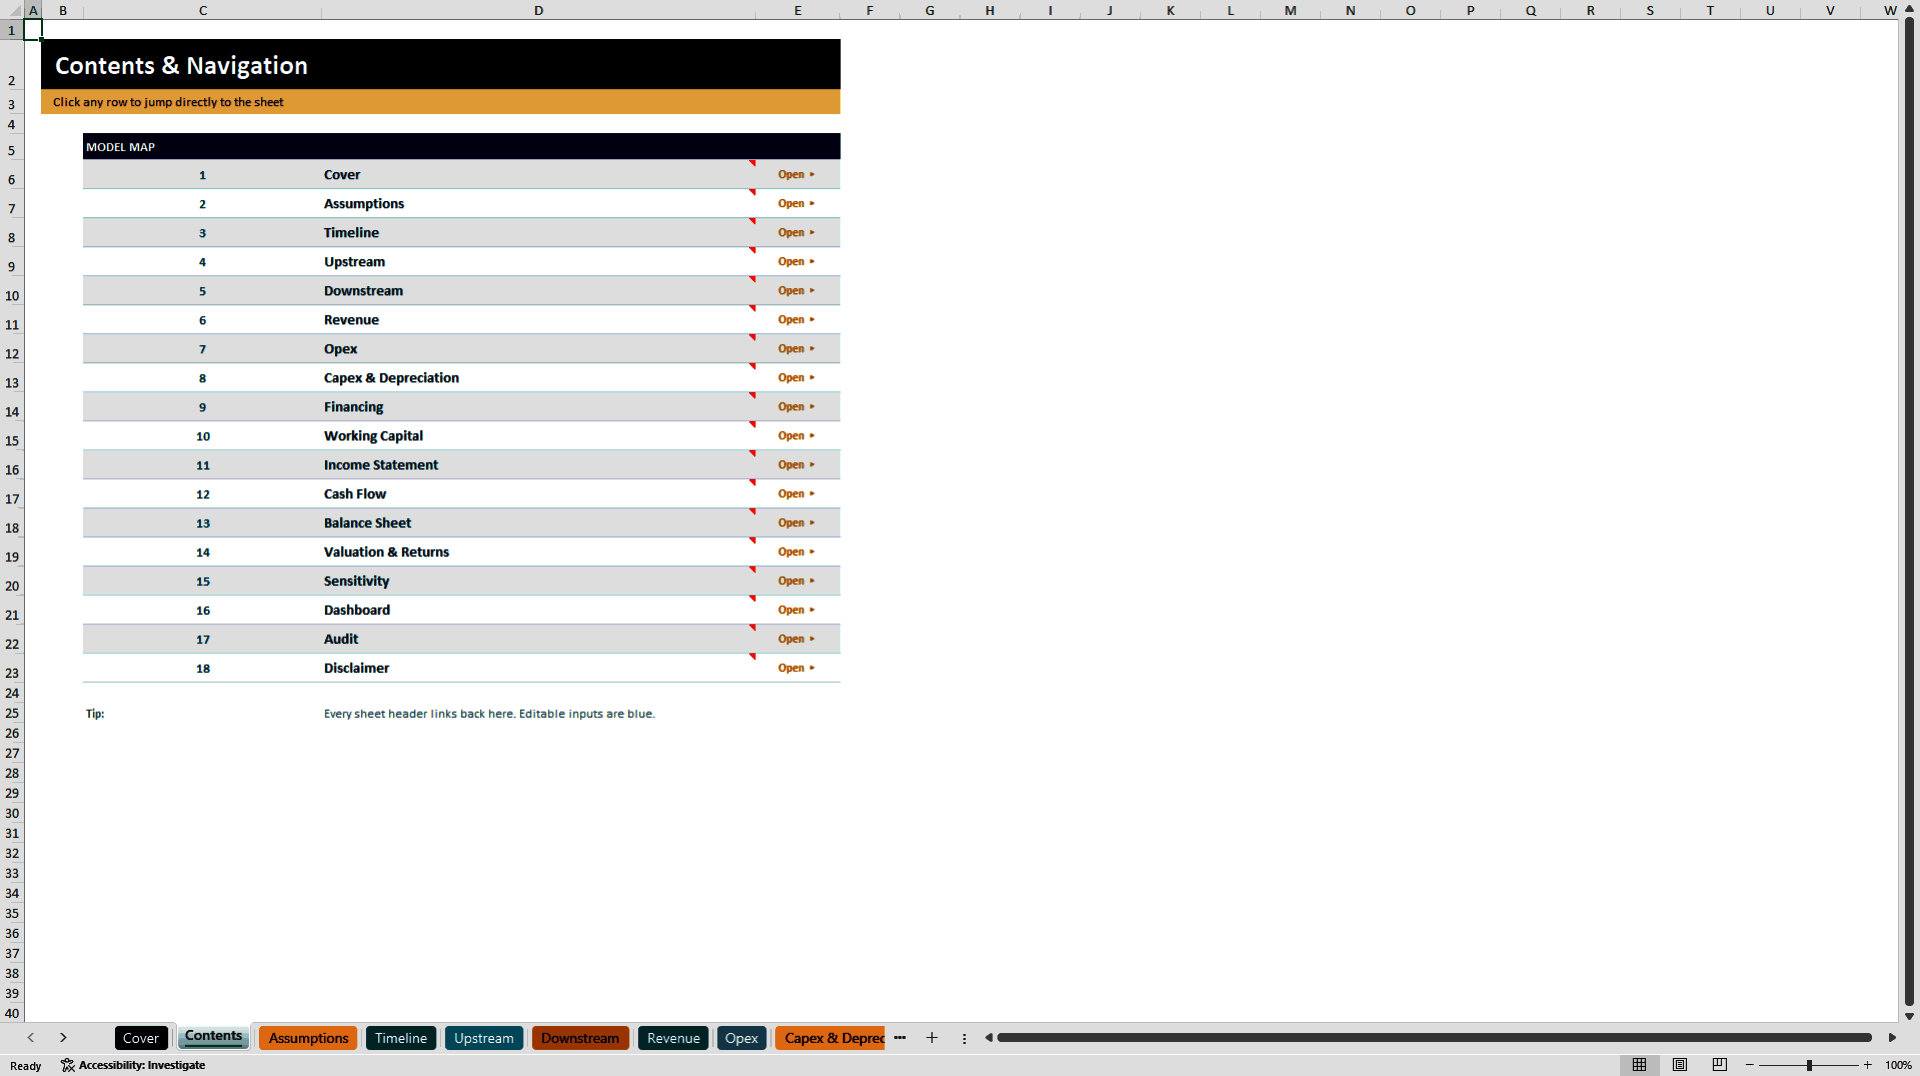
Start with the Contents sheet to navigate the workbook.
Then move to the Assumptions sheet and update the main operating and financial assumptions, including model start year, forecast horizon, WACC, cost of equity, tax rate, inflation, Brent crude price, gas price, crack spread, upstream production assumptions, refinery utilization, cost assumptions, CapEx assumptions, and financing assumptions.
Next, review the Timeline, Upstream, and Downstream sheets to understand how operational assumptions flow into production, throughput, revenue, costs, and EBITDA.
Then review the Revenue, Opex, Capex & Depreciation, Financing, and Working Capital sheets.
Finally, analyze the financial outputs through the Income Statement, Cash Flow, Balance Sheet, Valuation & Returns, Sensitivity, Dashboard, and Audit sheets.
🎯 Who Should Buy This Model?
This model is suitable for:
✅ Oil and gas project developers
✅ E&P companies
✅ Refining and downstream operators
✅ Petroleum analysts
✅ Corporate finance teams
✅ Investment analysts
✅ Private equity and infrastructure investors
✅ Project finance teams
✅ Energy consultants
✅ CFO offices
✅ Business planning teams
✅ Valuation professionals
✅ Financial modeling professionals
💡 Why You Need This Model
Oil and gas projects require careful modeling because value depends on production volumes, decline curves, commodity prices, refinery economics, CapEx, debt structure, working capital, taxes, and long-term asset performance.
A generic business forecast will not properly capture the relationship between upstream production and downstream refining economics.
This model provides a professional framework for analyzing the full integrated oil and gas value chain in one workbook.
It is designed to support investment review, project feasibility, business planning, financial forecasting, valuation, lender review, investor communication, and strategic decision-making.
Got a question about the product? Email us at support@flevy.com or ask the author directly by using the "Ask the Author a Question" form. If you cannot view the preview above this document description, go here to view the large preview instead.
Source: Best Practices in Oil & Gas, Integrated Financial Model Excel: Oil & Gas Upstream and Downstream Model Excel (XLSX) Spreadsheet, PDMM Financial Models
ABOUT THE AUTHOR

PDMM Financial Models develops professional, decision-ready Excel models for business owners, entrepreneurs, investors, consultants, analysts, and finance teams. Our objective is to transform complex business assumptions into clear, structured analysis that supports better planning and investment decisions.
Our models cover business planning, forecasting, budgeting, feasibility analysis,
... [read more]
Ask the Author a Question
You must be logged in to contact the author.




























