
 Click main image to view in full screen.
Mobile Home Park Acquisition and Underwriting Model – Excel XLSX
Excel (XLSX) + supplemental PDF


BENEFITS OF THIS DOWNLOADABLE EXCEL DOCUMENT
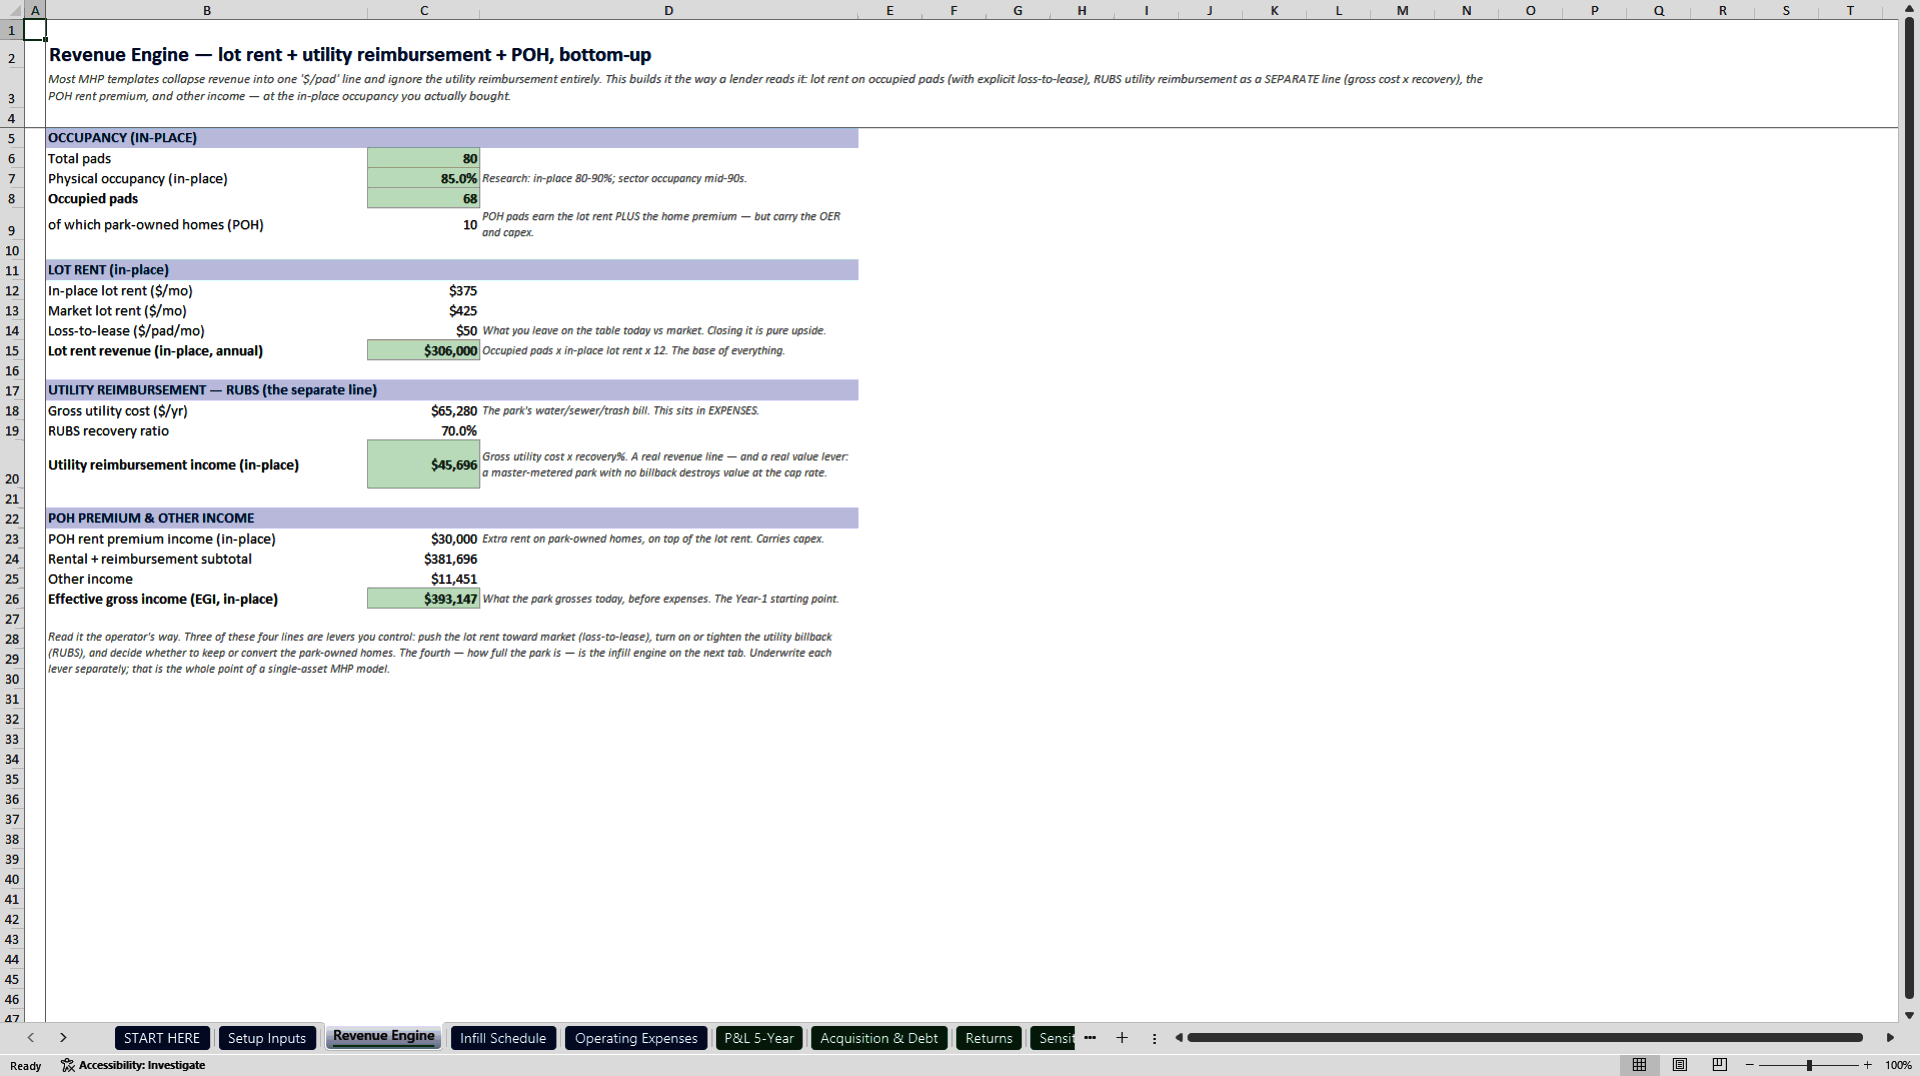
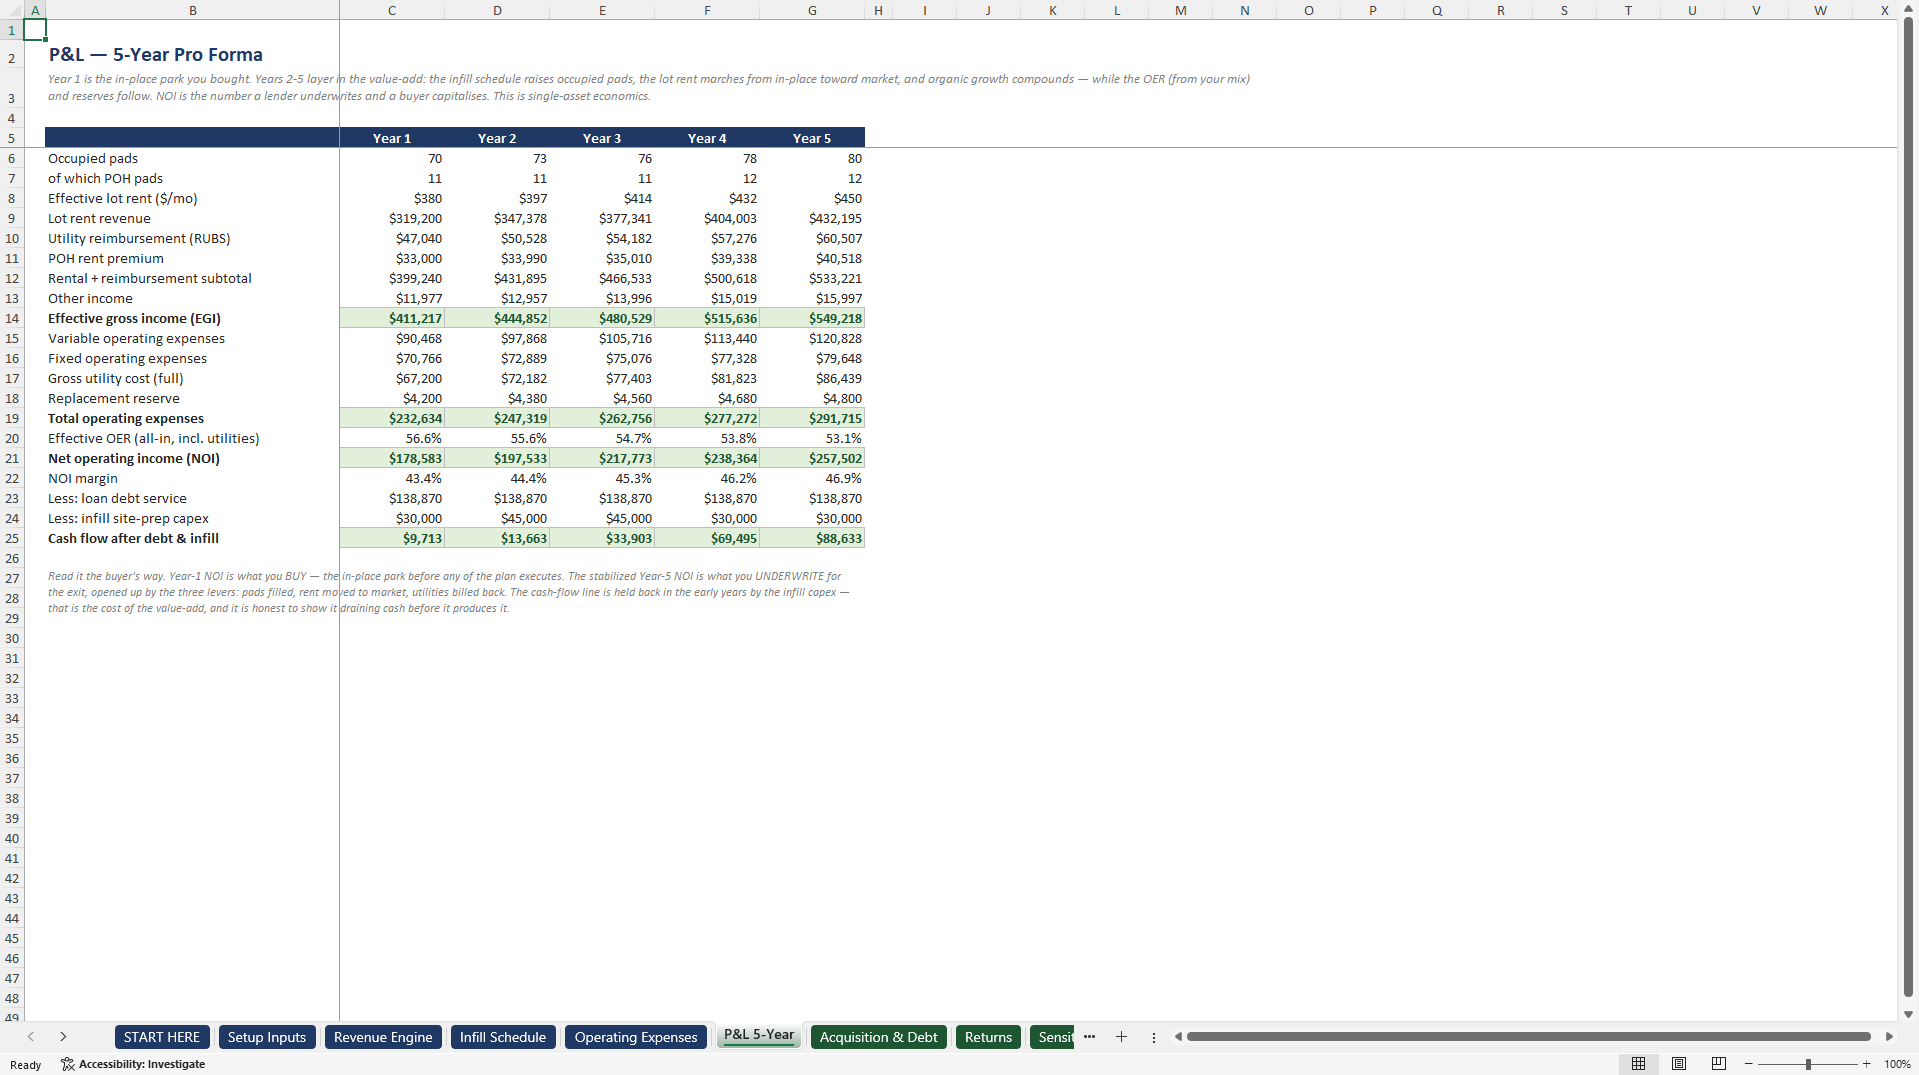
- EGI is built from three separate levers, lot rent, a distinct RUBS recovery line and the park-owned-home premium, so $393,147 of in-place income is traceable pad by pad instead of blended into one rate.
- The infill engine fills vacant pads from 68 to 80 across Years 1 to 5, booking about $15,000 of site-prep capex in the year each pad turns on, so the upside is earned on a timeline rather than assumed.
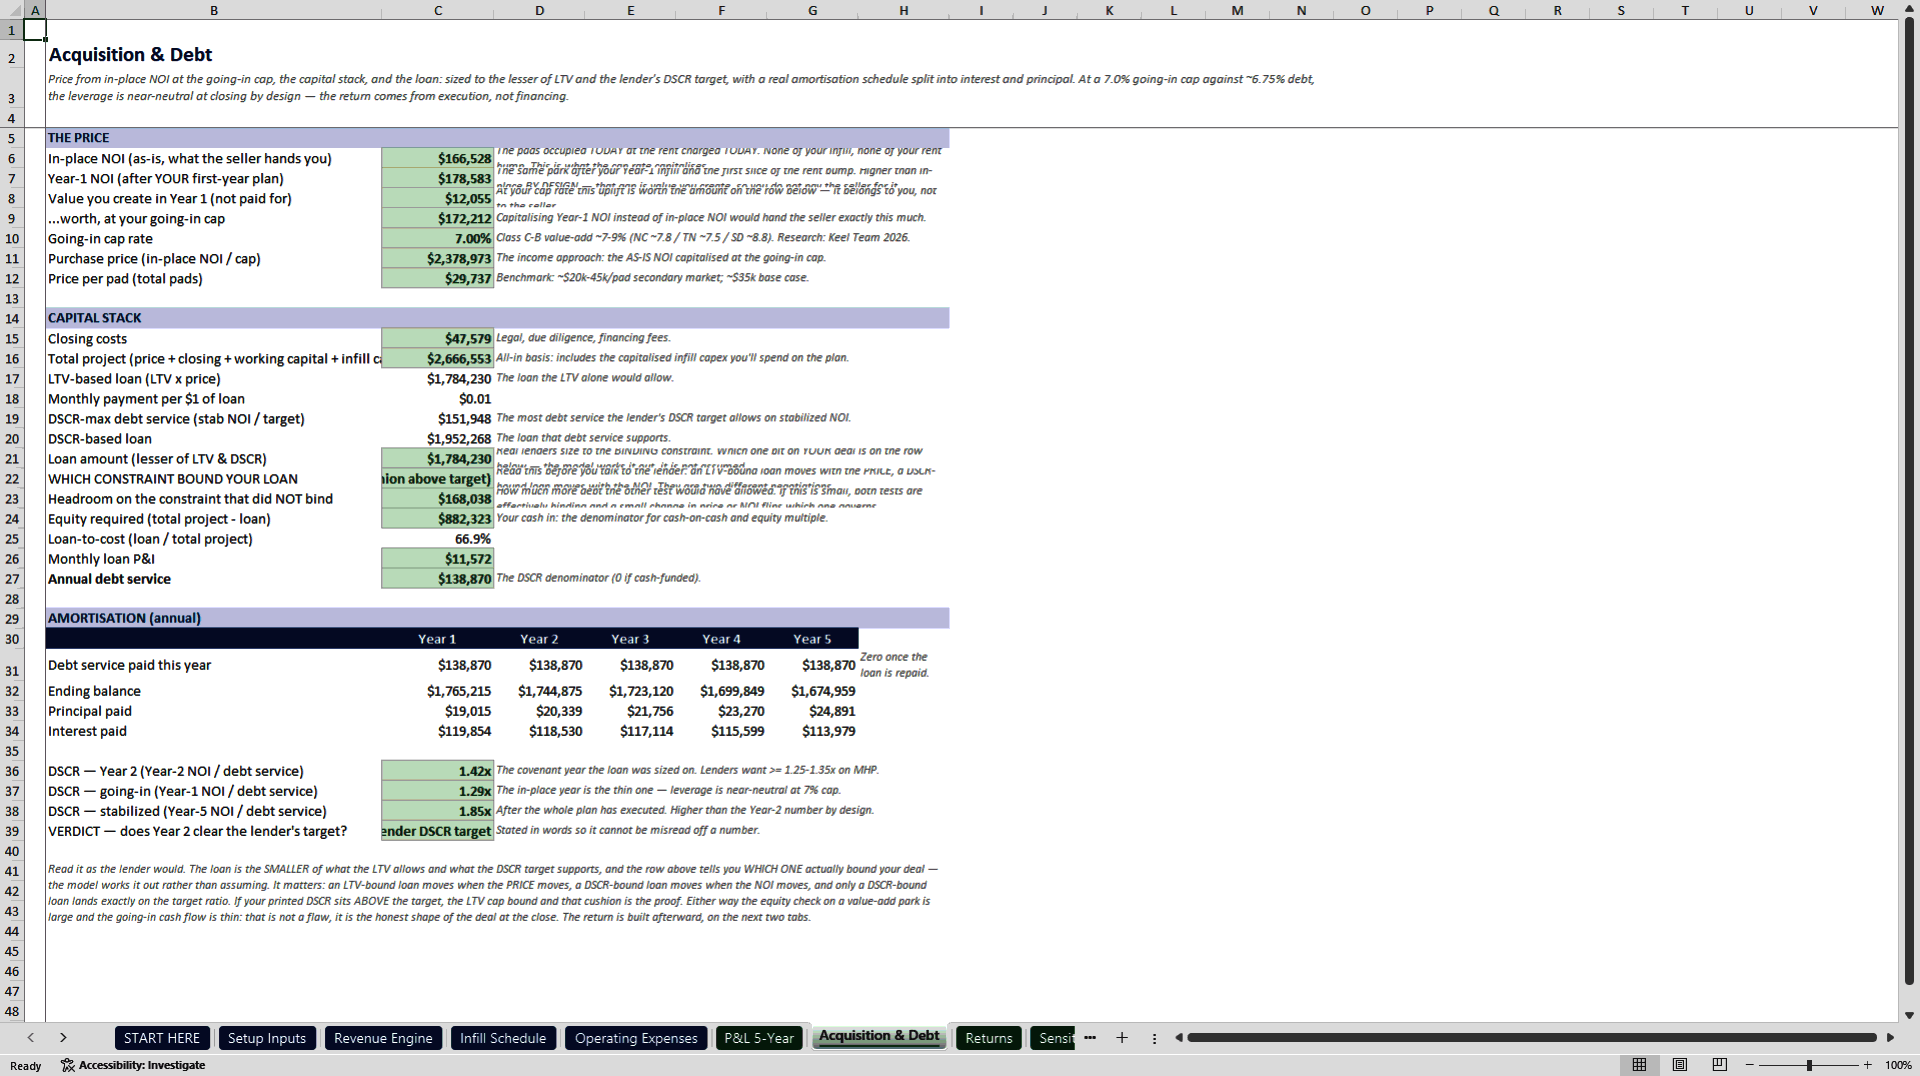
- The loan is always sized on the lesser of the LTV cap and the DSCR constraint under either an Agency or a Bank/SBA toggle, which is how a lender actually sizes debt on a low-cap asset.
REAL ESTATE EXCEL DESCRIPTION
This model underwrites the purchase of a single mobile home park, at single-asset level, for a buyer who needs to know whether the deal covers its debt before the value-add lands.
The valuation error it intercepts is the instant-upside pro forma. Most park templates either price forty parks at once, borrowing a roll-up's scale margin that a single asset never gets, or collapse revenue into one invented dollar-per-pad figure and assume the vacant pads fill on day one. Infill is real, but it costs money and it takes years; treating it as free and immediate is how a park gets overpriced.
The engine builds effective gross income bottom-up from three separate lines: lot-rent revenue (occupied pads times in-place lot rent times twelve), a separate utility-reimbursement line (gross utility cost times your recovery ratio) and the park-owned-home rent premium. On the default that is 80 pads with 68 occupied, $306,000 of lot rent, a $45,696 RUBS line and a $30,000 POH premium, giving $393,147 of in-place EGI with every dollar traceable to a pad. The infill engine then fills vacant pads across Years 1 to 5 at the pace you set, moving occupancy from 68 to 80 pads, booking about $15,000 of site-prep capex in the year each pad is filled and adding roughly $4,260 of NOI once it is online, for $180,000 of infill capex over the hold. A separate loss-to-lease bridge captures the move from in-place rent of $375 toward a $425 market rent, so the rent-bump upside stays distinct from the infill upside.
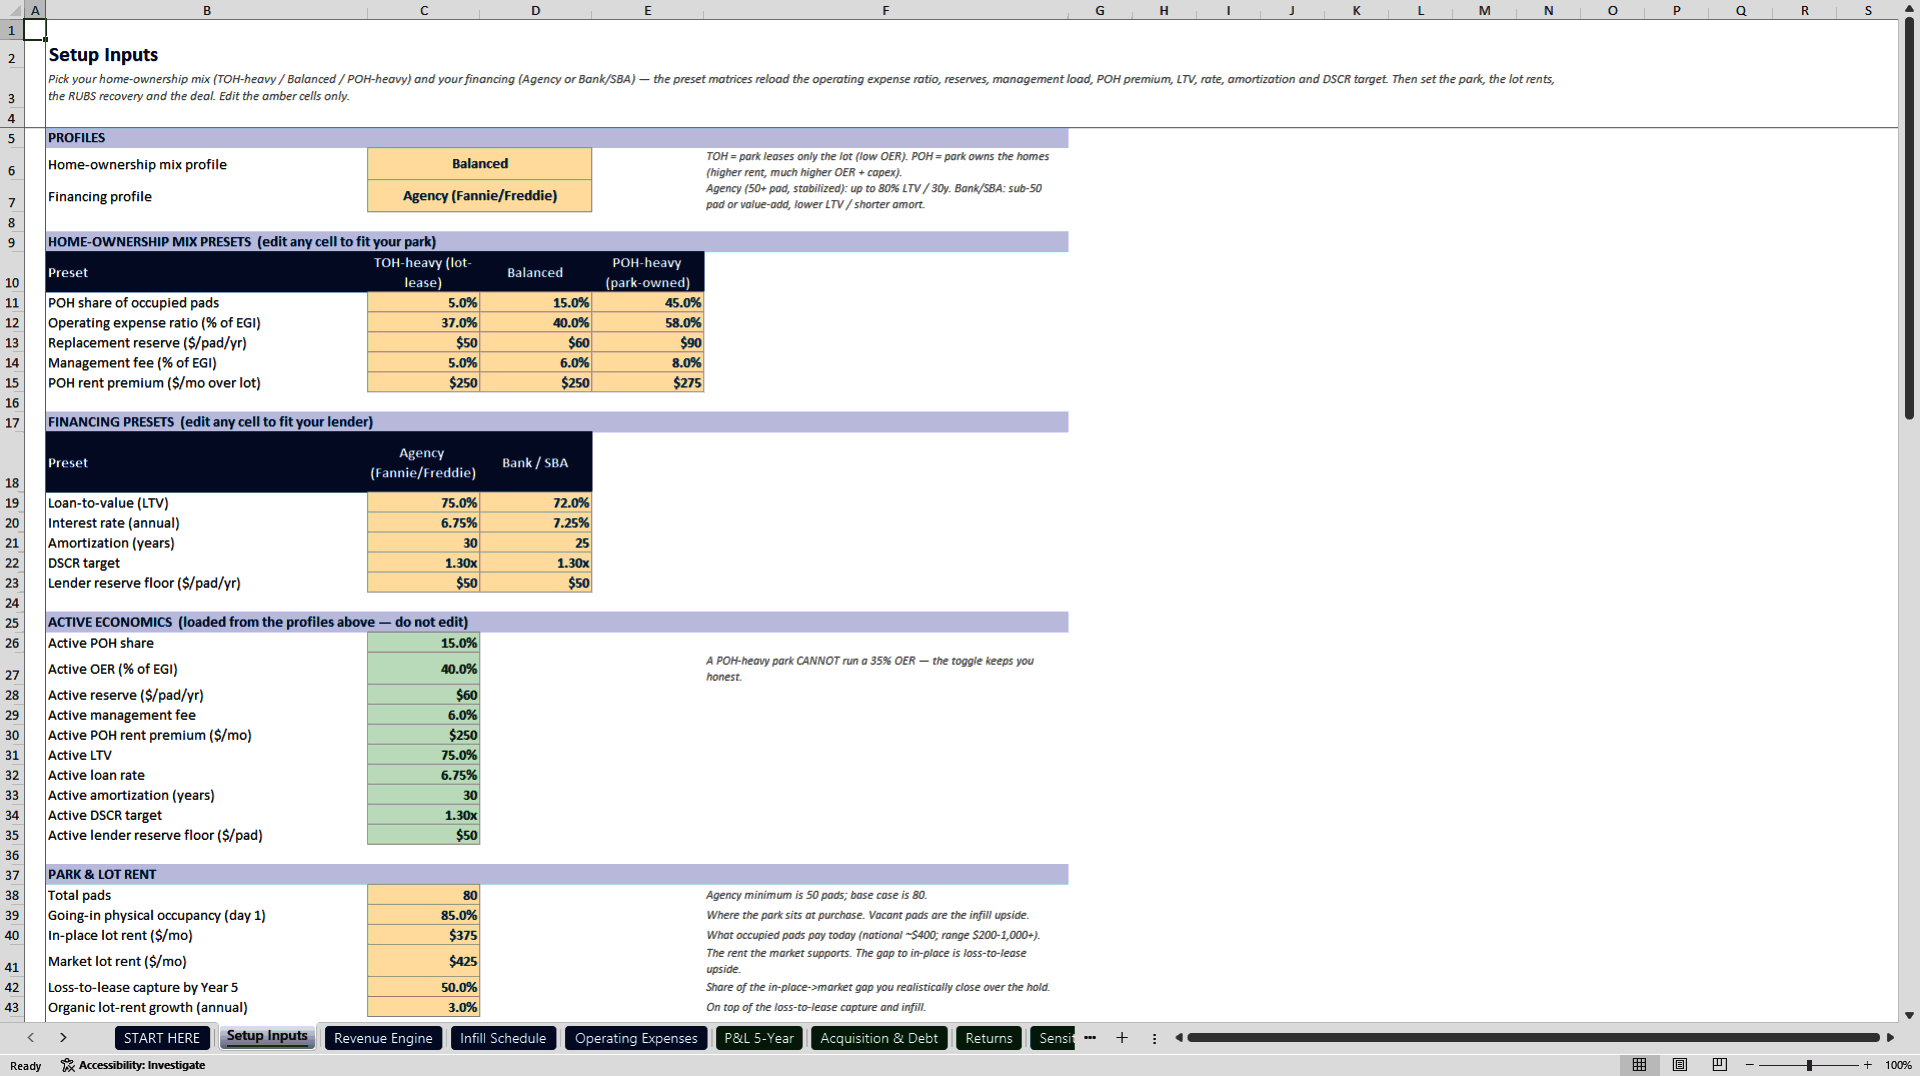
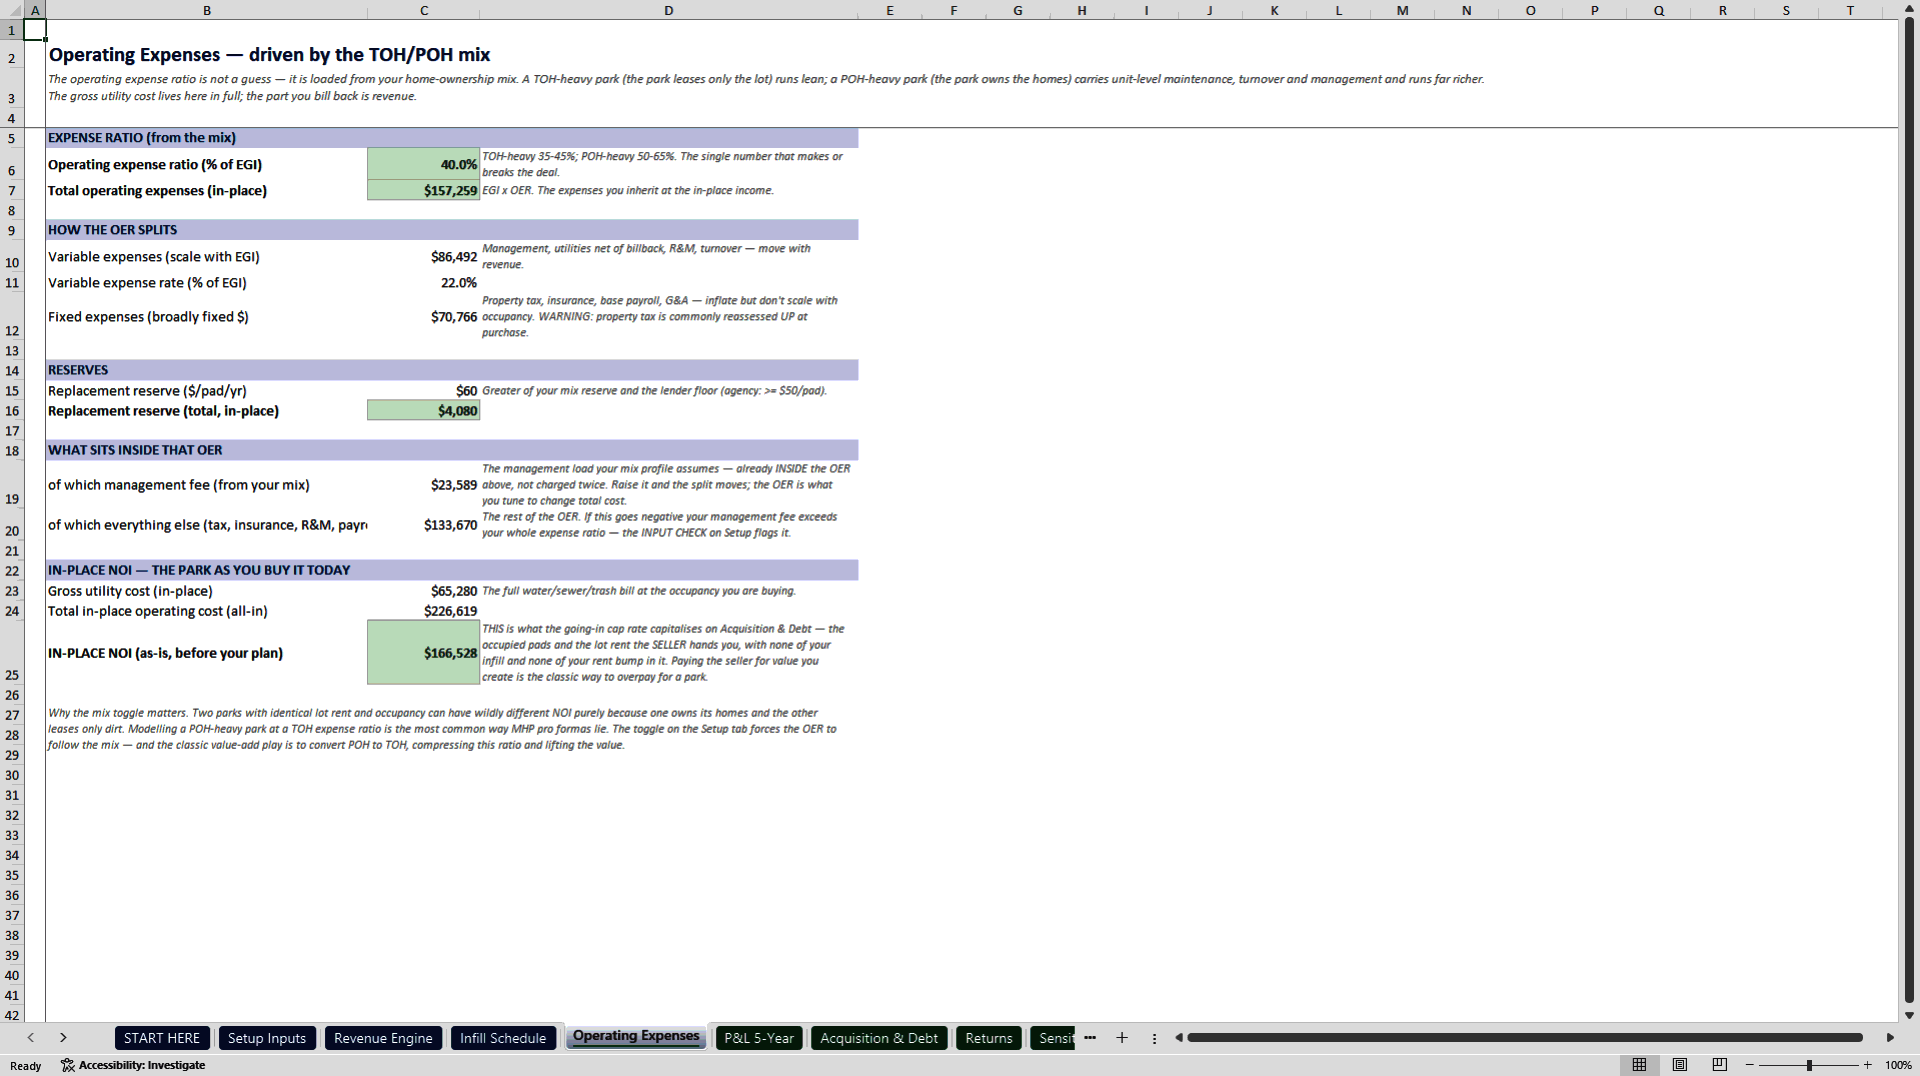
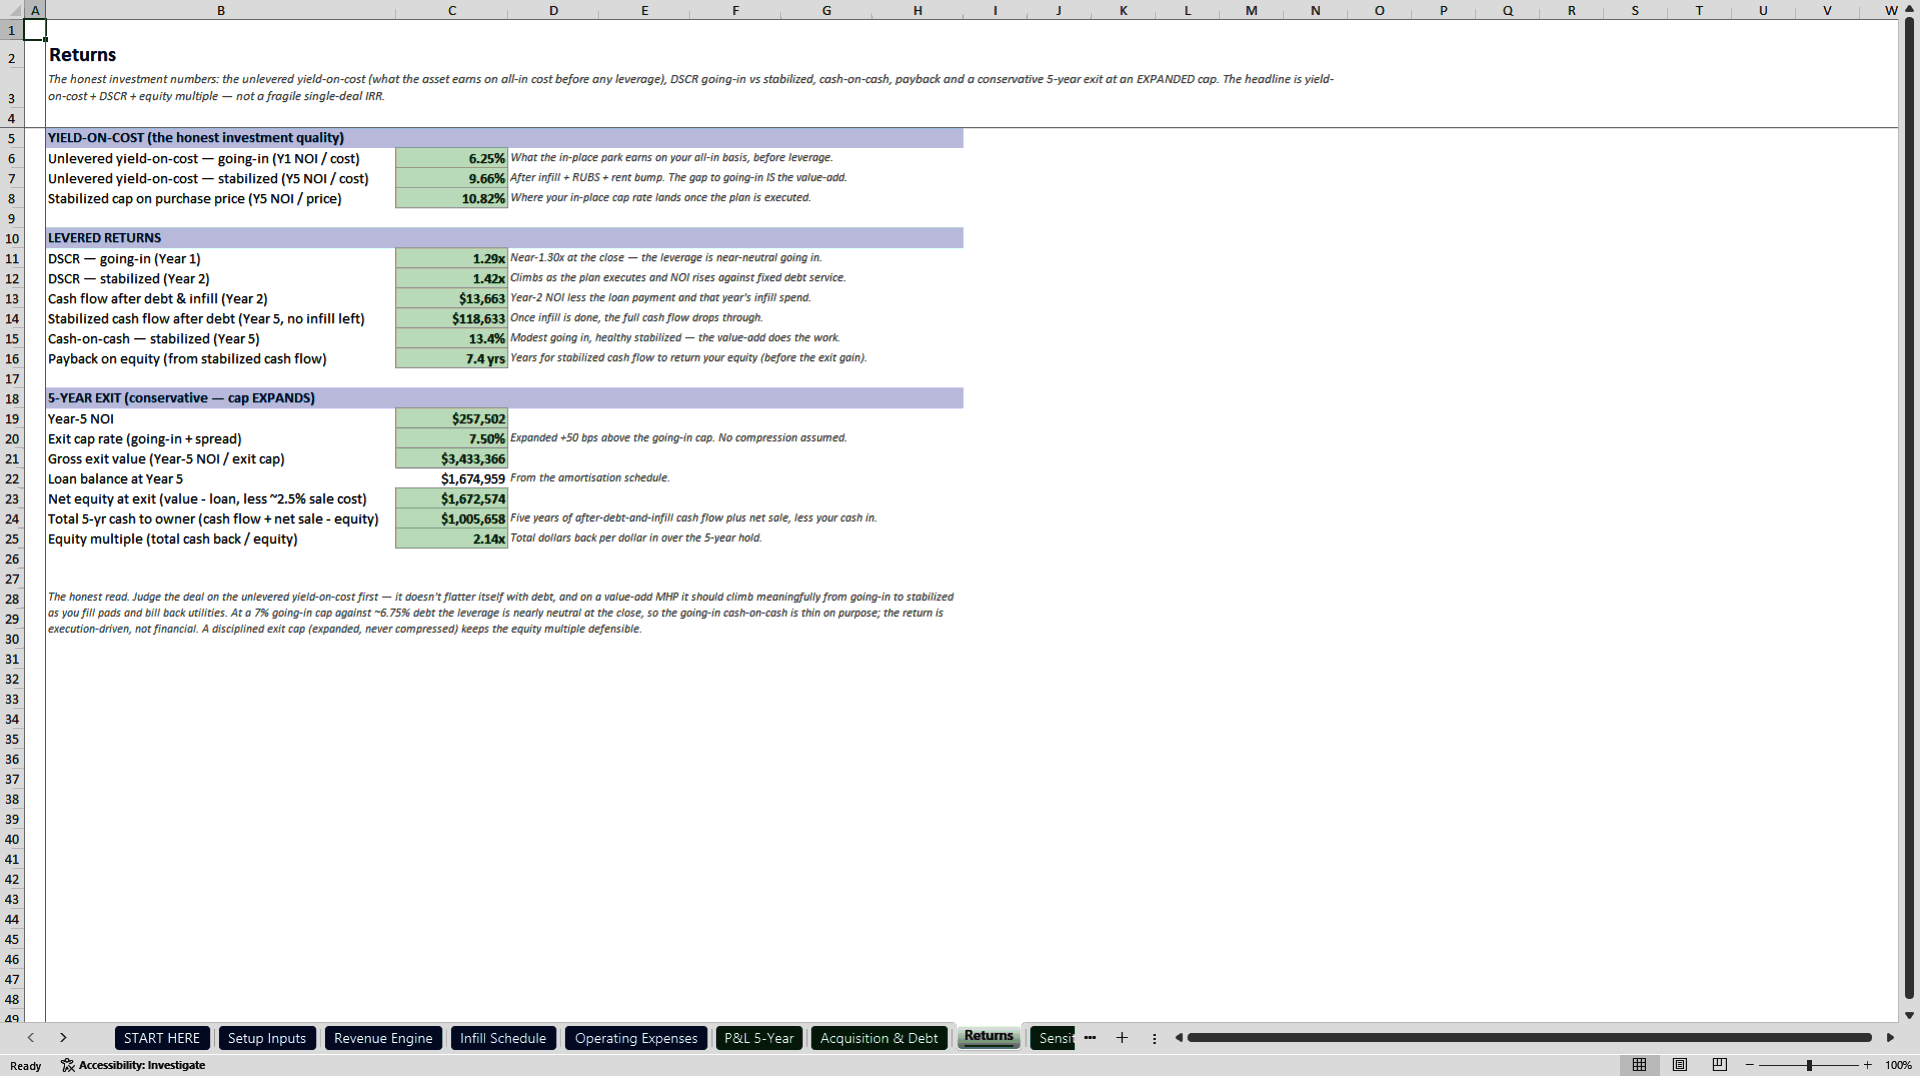
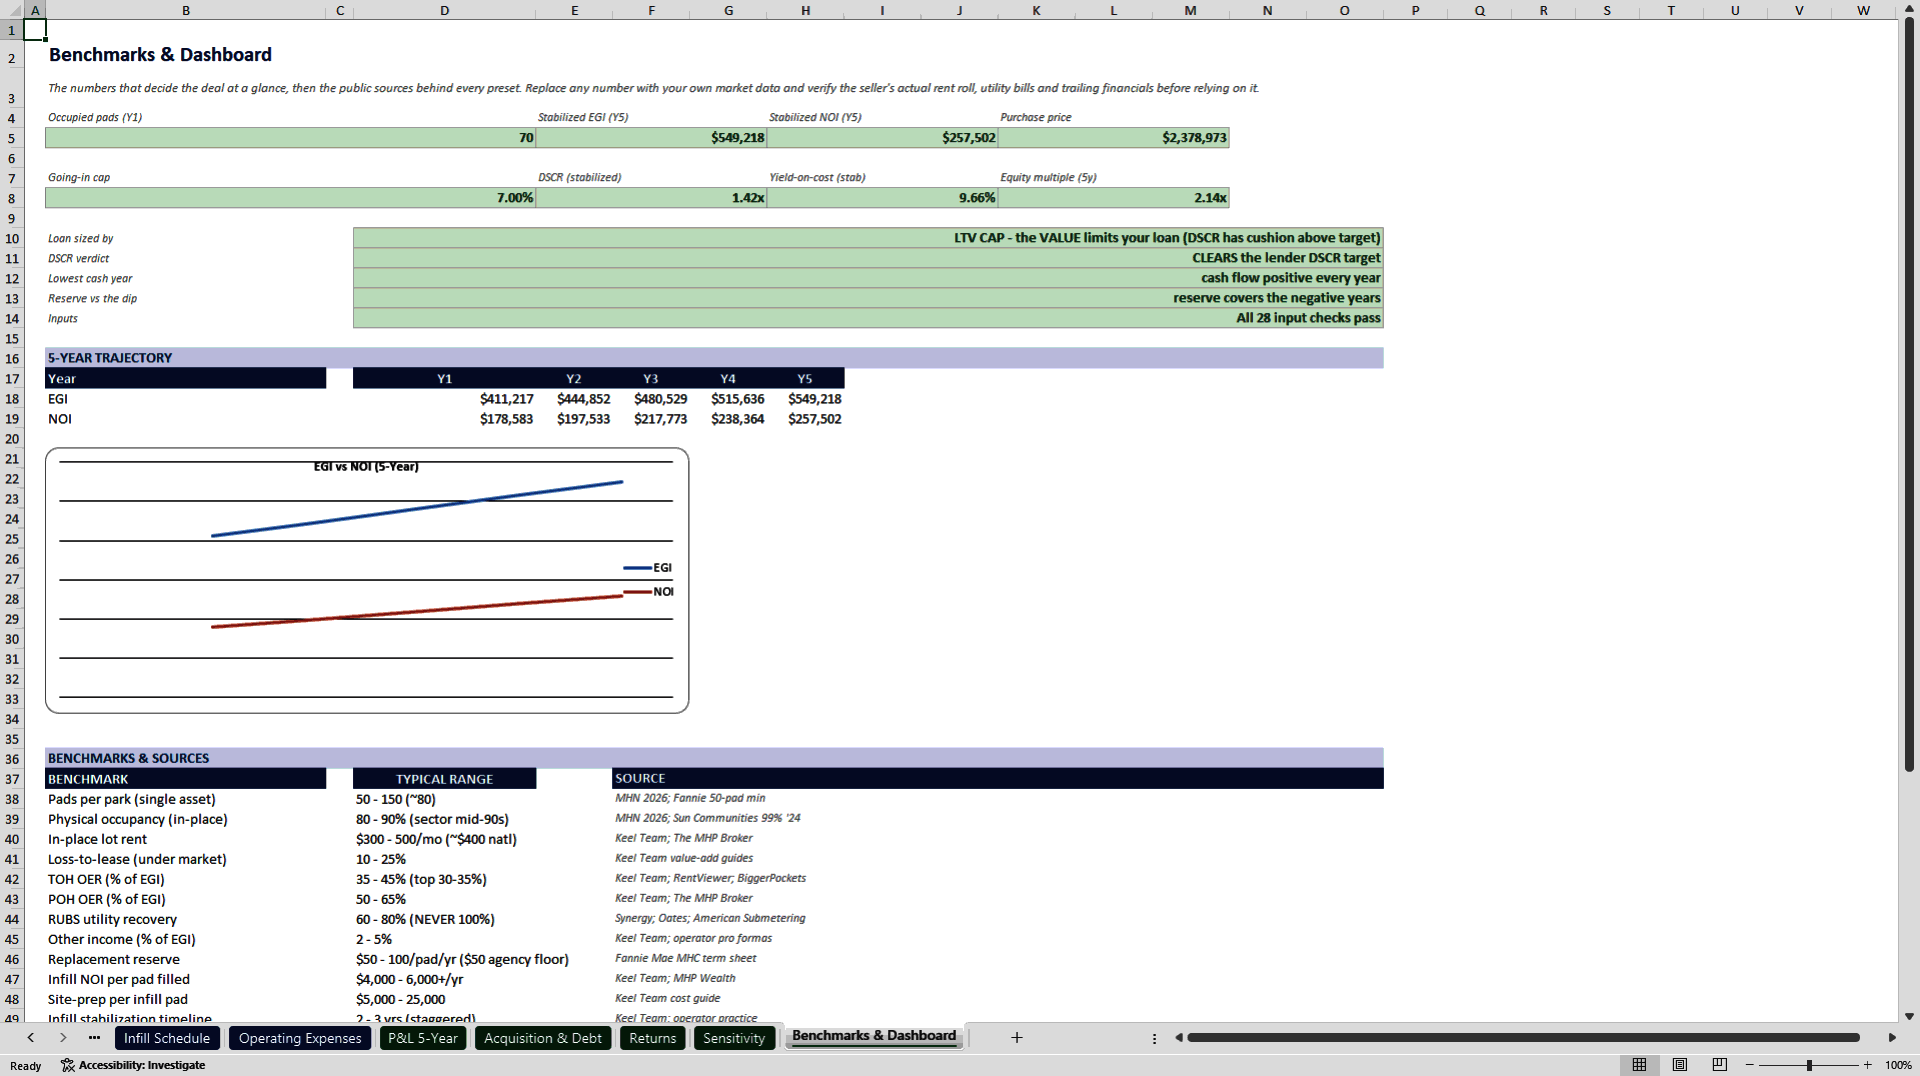
A TOH and POH mix toggle reloads the operating profile from an editable preset table, and the operating expense ratio follows the mix: tenant-owned-home land-lease runs lean at about 37%, while a POH-heavy park runs near 58% because it carries the homes. An Agency versus Bank/SBA toggle swaps LTV, rate, amortization and DSCR target, with the loan always sized on the lesser of the LTV cap and the DSCR constraint. In-place NOI is $166,528 rising to $257,502 by Year 5, and the acquisition underwrite prices the park at $2,378,973 on a 7.0% going-in cap ($29,737 per pad), with DSCR 1.42x stabilized and 1.29x going-in, a 6.25% going-in yield-on-cost stabilizing at 9.66%, and a 2.14x equity multiple on a conservative five-year exit.
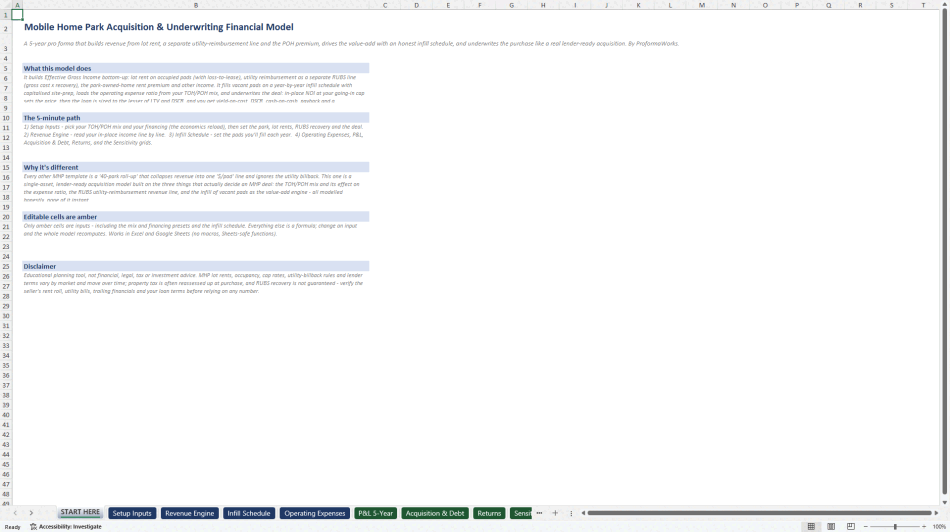
Inside: a 10-sheet Excel workbook with no macros or external links, a 20-page PDF guide, a START HERE sheet with only amber cells, the revenue engine, the infill schedule, a setup sheet with editable preset matrices and a benchmarks and dashboard tab with sourced 2024-26 ranges.
What it does not claim: at closing the deal is near leverage-neutral, a 7.0% going-in cap against a 6.75% debt rate, so the return is execution-driven rather than financial. Lot rents, occupancy, RUBS recovery, cap rates and the local regulatory environment (rent control, utility-billing rules, park-closure protections) vary by market. Educational planning tool, not financial, legal, tax or investment advice.
Got a question about the product? Email us at support@flevy.com or ask the author directly by using the "Ask the Author a Question" form. If you cannot view the preview above this document description, go here to view the large preview instead.
Source: Best Practices in Real Estate, Integrated Financial Model Excel: Mobile Home Park Acquisition and Underwriting Model Excel (XLSX) Spreadsheet, ProformaWorks
ABOUT THE AUTHOR

ProformaWorks builds acquisition-grade financial models for Main Street and lower-middle-market businesses - the kind of deal financed with an SBA 7(a) loan or a small commercial facility.
Every model answers one question: does this deal pencil at the bank? That means SDE or NOI rebuilt from the seller's own numbers, the add-backs a lender will and will not accept, a debt-service
... [read more]
Ask the Author a Question
You must be logged in to contact the author.




























