
 Click main image to view in full screen. Unlock all 9 preview images:
Mobile App Financial Model - 60-Month Forecast – Excel XLSX
Excel (XLSX) + supplemental PDF


BENEFITS OF THIS DOWNLOADABLE EXCEL DOCUMENT
- 📱 Connect paid and organic acquisition, 60 user cohorts, subscriber retention, freemium conversion and three monetization streams to a complete five-year forecast.
- 📊 Evaluate app profitability and funding needs with eight linked dashboard charts, three financial statements, three operating scenarios, CAC, LTV and cash runway.
- 💼 Simplify startup financial planning with 14 interconnected worksheets, monthly subscription and deferred revenue calculations, model checks and a 16-page PDF guide.
MOBILE APP EXCEL DESCRIPTION
📱 MOBILE APP FINANCIAL MODEL
60-MONTH SIGNATURE EDITION
🚀 FROM USER ACQUISITION TO LONG-TERM FINANCIAL PERFORMANCE
Turn mobile app growth assumptions into a comprehensive, connected five-year financial planning system.
The Mobile App Financial Model brings together paid and organic user acquisition, subscriber cohorts, customer retention, recurring subscriptions, freemium conversion, in-app purchases, advertising monetization, operating expenditure, financing and cash flow.
Developed for mobile app founders, startup CFOs, product managers, growth teams, financial analysts and early-stage investors, this editable financial model helps translate operating assumptions into structured financial forecasts.
With 14 interconnected worksheets, 60 monthly forecast periods, 60 user acquisition cohorts, three selectable operating scenarios and eight native Excel dashboard charts, the workbook connects user behavior with revenue generation and business profitability.
All example inputs and financial outputs are fictional and intended for illustrative planning and educational purposes.
━━━━━━━━━━━━━━━━━━━━
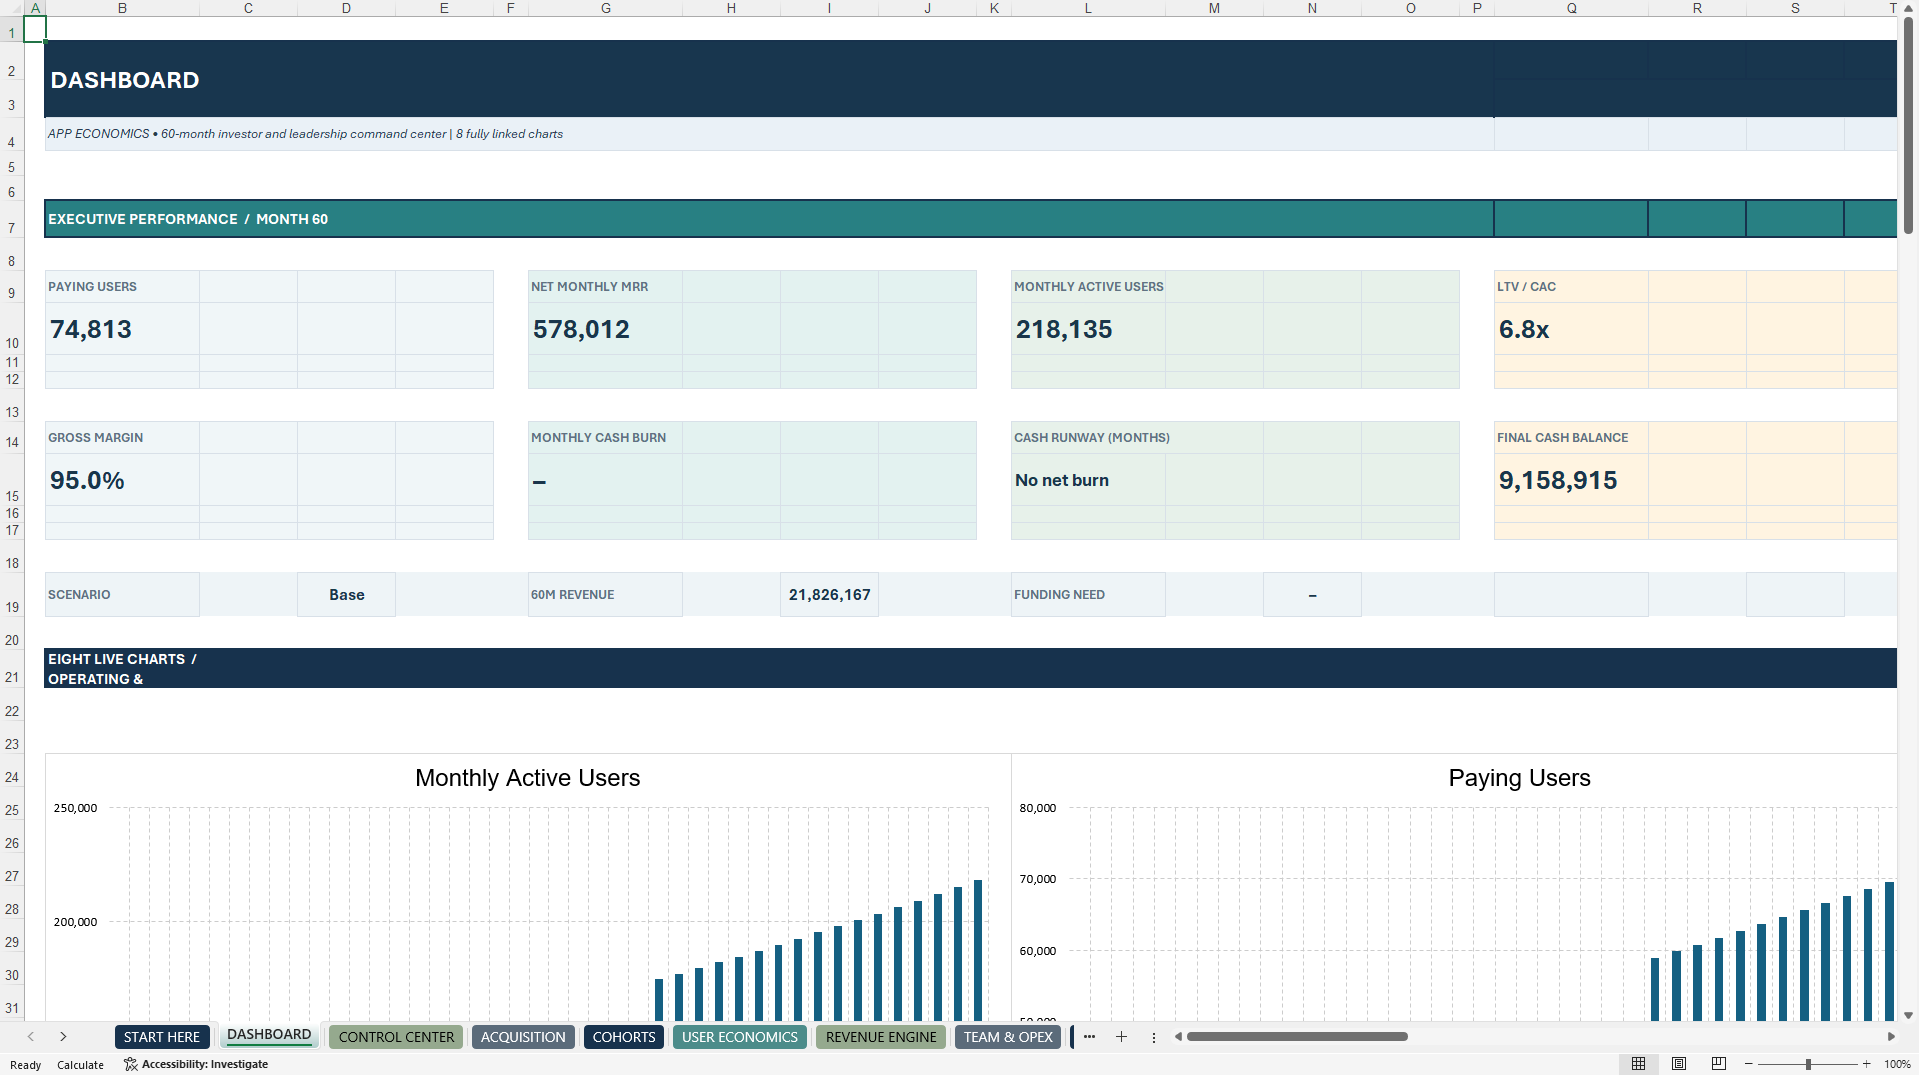
📊 EXECUTIVE MOBILE APP DASHBOARD
Monitor app growth, monetization efficiency, profitability and liquidity from one integrated executive dashboard.
Eight native Excel charts visualize:
① Monthly Active Users (MAU)
② Paying Subscribers
③ Net Revenue
④ Monthly Recurring Revenue (MRR)
⑤ Closing Cash Balance
⑥ EBITDA Performance
⑦ Customer Acquisition Cost (CAC)
⑧ Lifetime Value to Acquisition Cost (LTV/CAC)
Additional dashboard indicators include:
• Active Users
• Paying Subscribers
• Monthly Recurring Revenue
• Gross Profit Margin
• Monthly Cash Burn
• Estimated Cash Runway
• Cumulative Revenue
• Liquidity
• Estimated Funding Requirements
The dashboard is connected to the model's operating and financial calculations.
Changes to assumptions and selected scenarios feed the underlying dashboard formulas.
━━━━━━━━━━━━━━━━━━━━
👥 USER ACQUISITION & GROWTH FORECASTING
Build a structured view of how users enter and progress through your mobile app business.
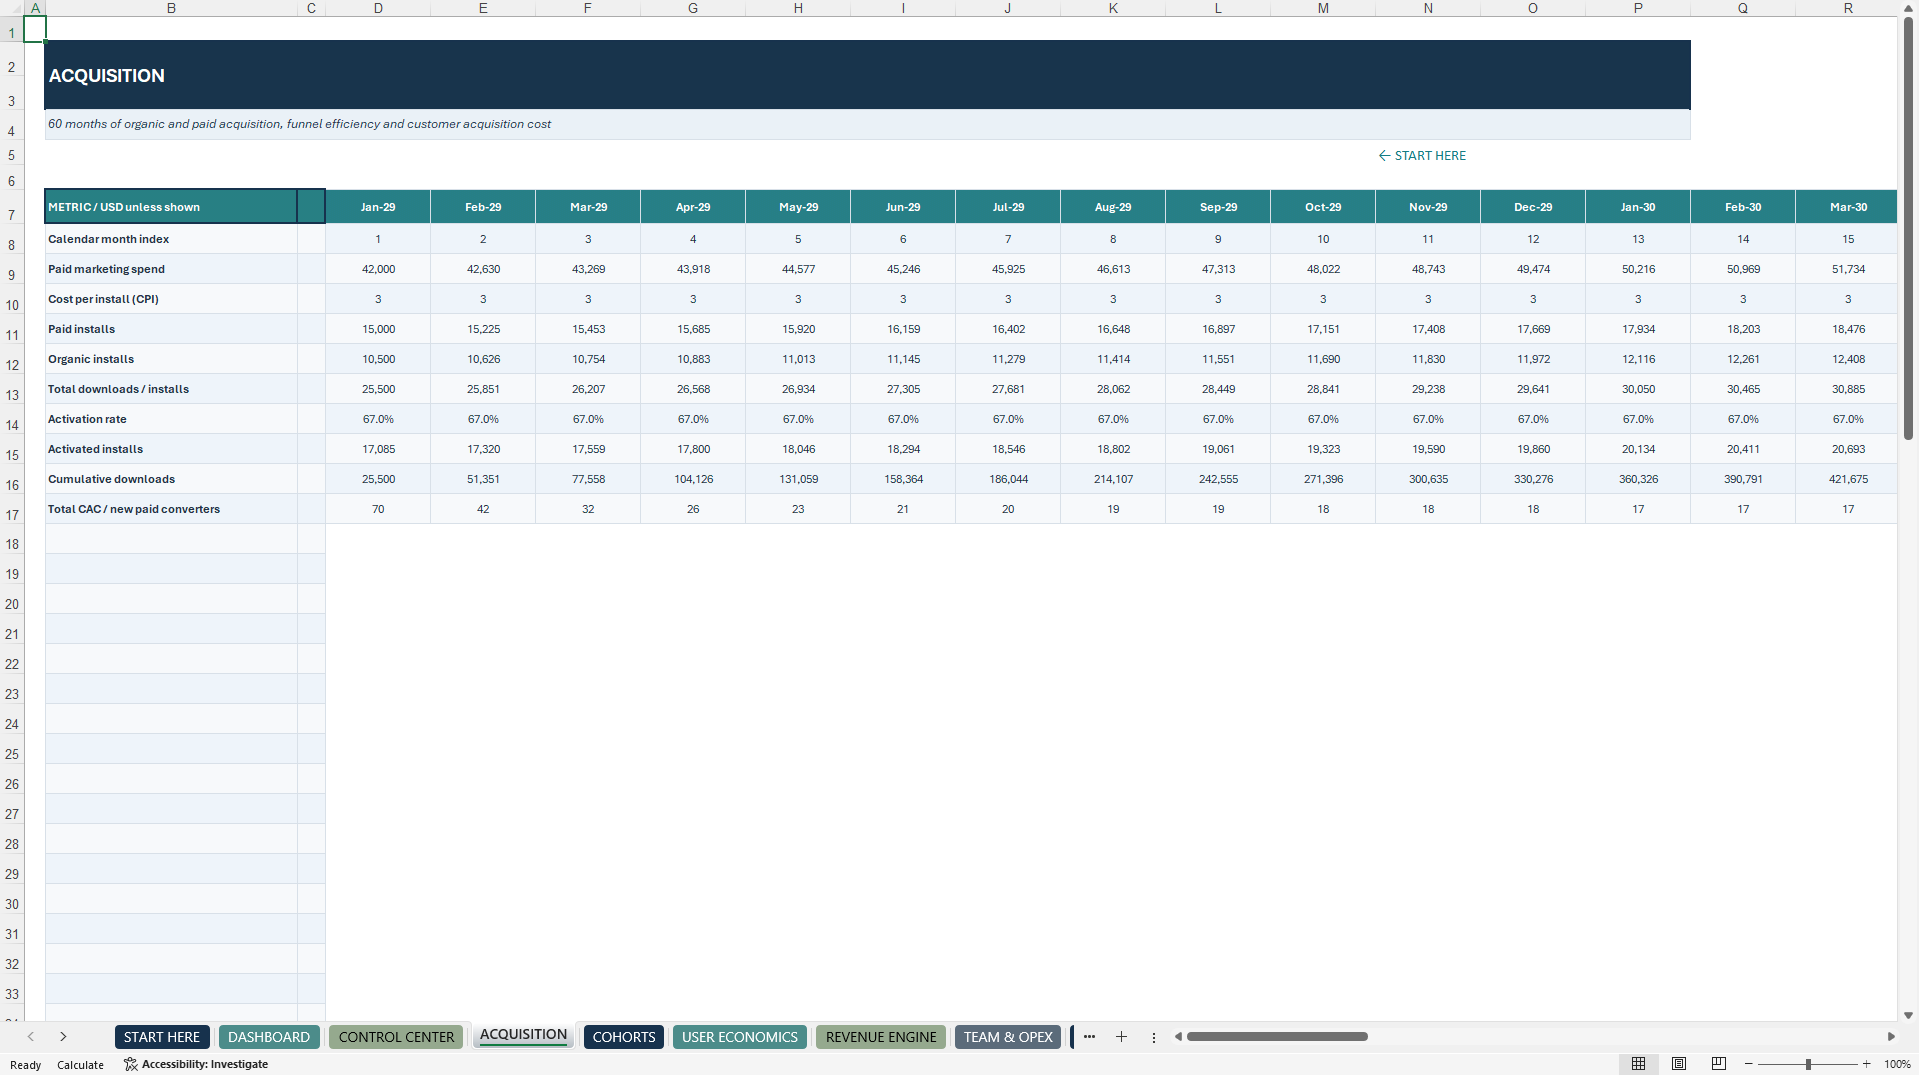
The ACQUISITION worksheet models two principal sources of customer growth.
📣 PAID USER ACQUISITION
Forecast paid app installs using marketing expenditure and Cost per Install (CPI) assumptions.
🌱 ORGANIC USER ACQUISITION
Estimate organic downloads and acquisition growth independently of paid advertising campaigns.
The acquisition calculations connect marketing investment with new users, activation, retention and monetization.
This supports analysis of how acquisition efficiency can affect financial performance and funding requirements.
━━━━━━━━━━━━━━━━━━━━
🔄 60-COHORT RETENTION & USER ENGAGEMENT
Understand how user acquisition and retention interact over time.
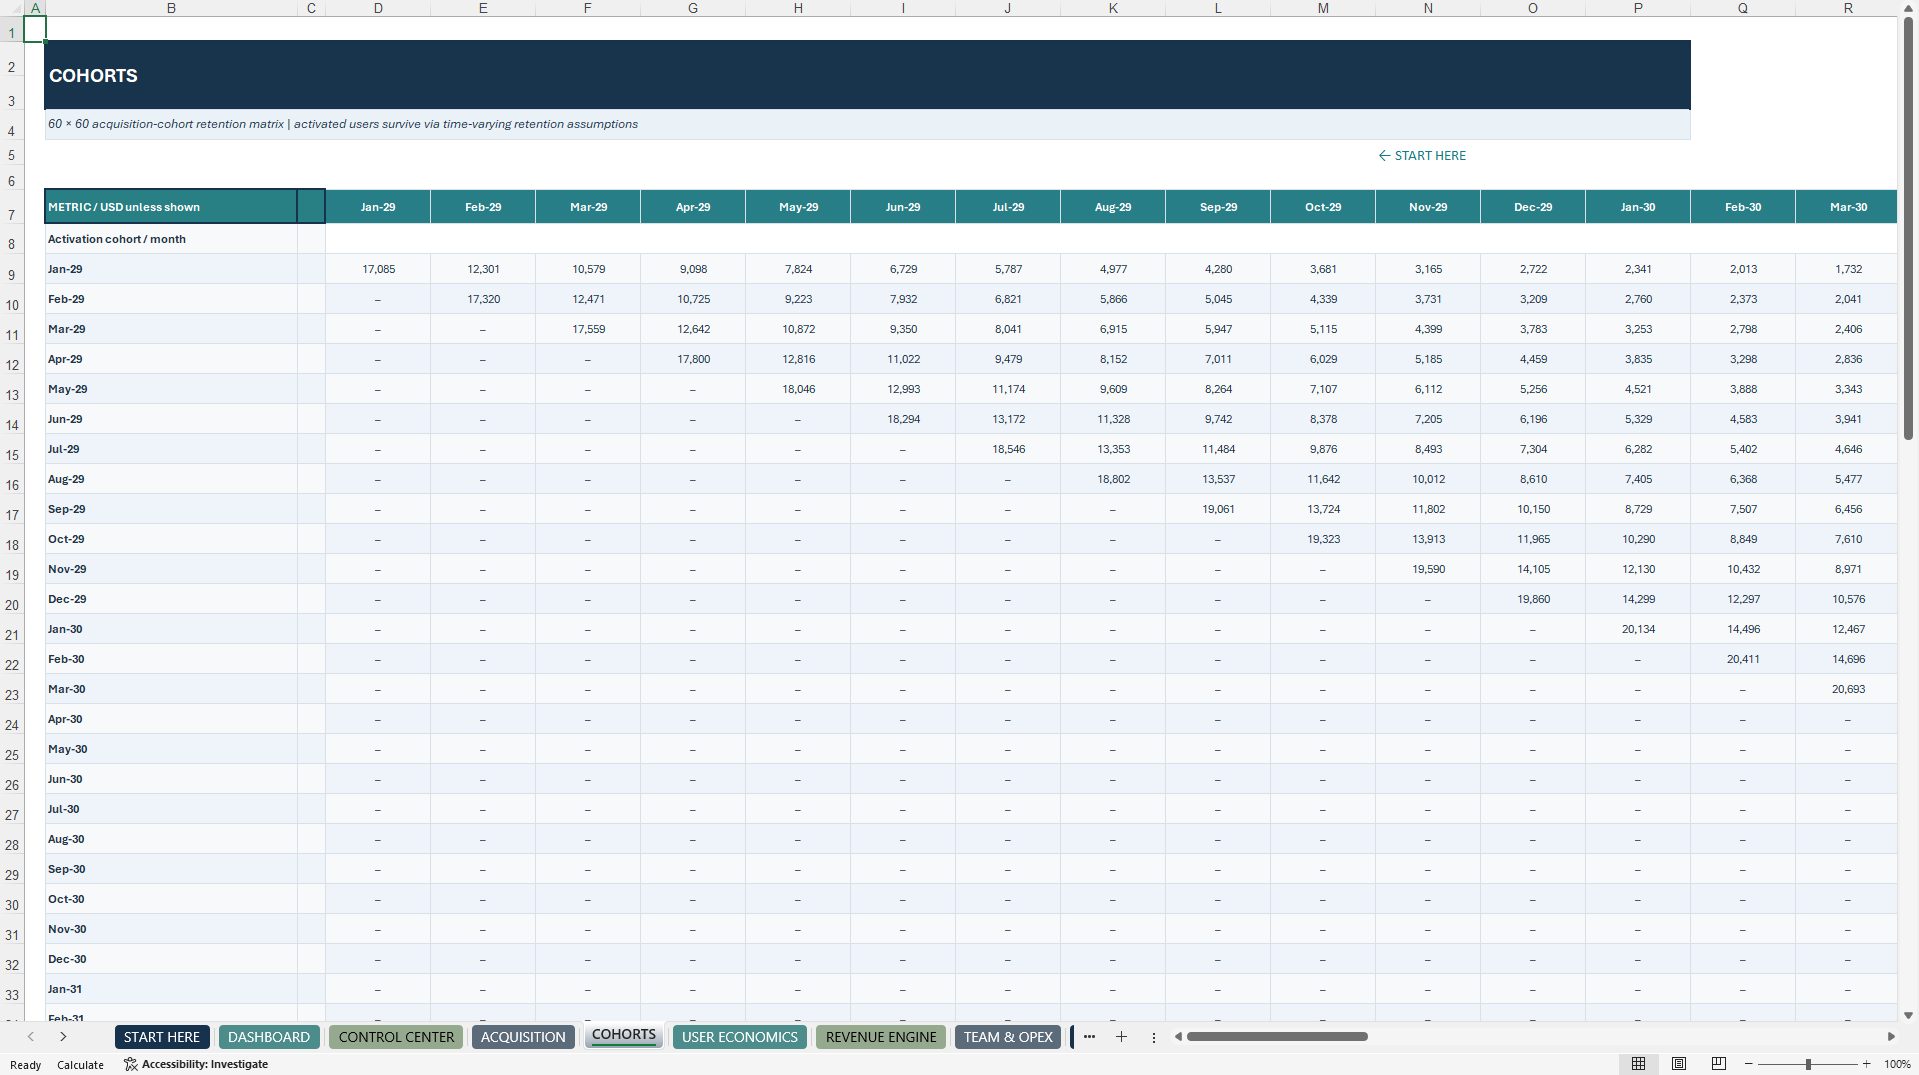
The COHORTS worksheet incorporates 60 monthly user cohorts.
Each cohort represents a period of newly acquired users and their modeled future activity.
The connected operating schedules calculate:
• User Acquisition by Cohort
• Activation
• Cohort Retention
• Monthly Active Users (MAU)
• Daily Active Users (DAU)
• User Engagement Indicators
• Subscription Conversion
• Paying Subscribers
• Subscriber Churn
• Reactivation
The retention engine uses deterministic assumptions rather than individual customer transaction histories.
These calculations help illustrate how user retention and subscription conversion influence recurring revenue.
━━━━━━━━━━━━━━━━━━━━
💳 MONTHLY & ANNUAL SUBSCRIPTION REVENUE
Model recurring subscription monetization using configurable pricing, subscriber conversion and retention assumptions.
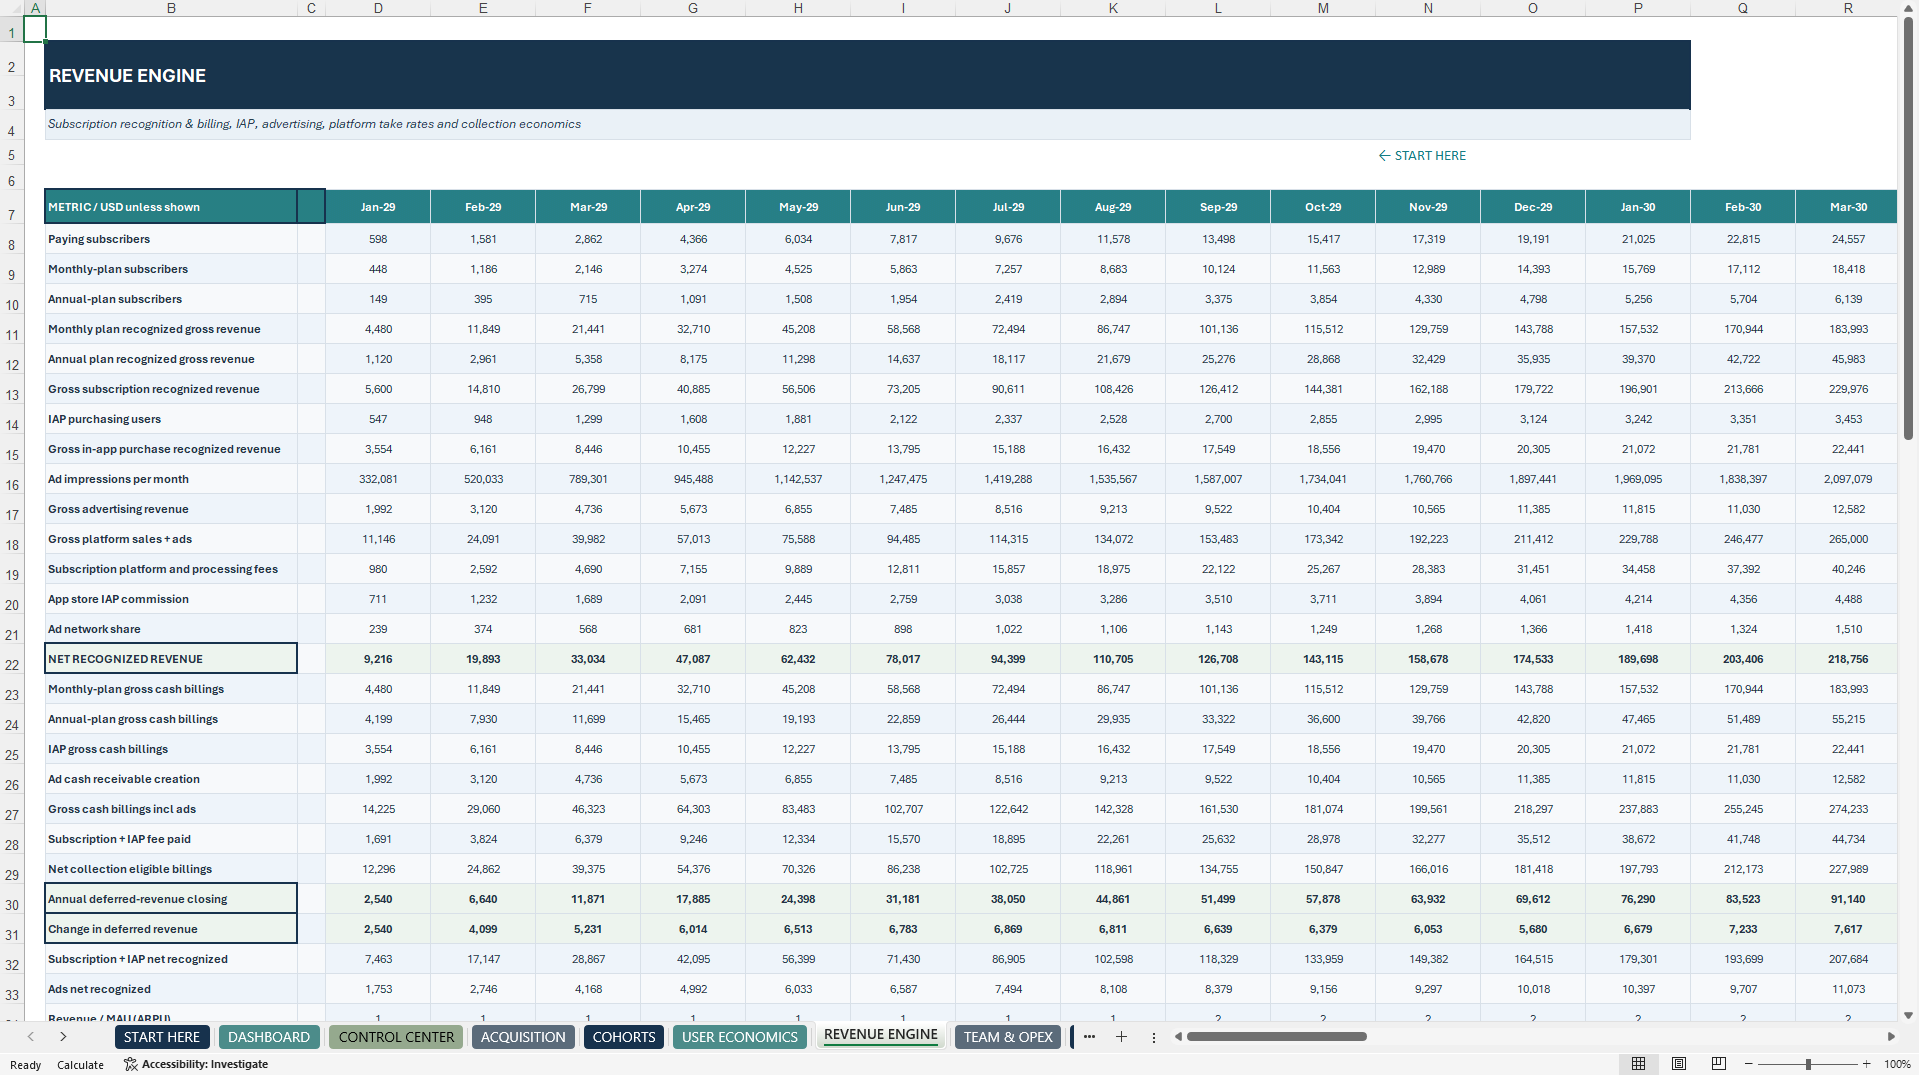
The REVENUE ENGINE includes:
• Monthly Subscription Plans
• Annual Subscription Plans
• Subscription Prices
• Paying Subscriber Growth
• Subscription Conversion
• Customer Churn
• Annual Subscription Renewals
• Platform Commissions
• Payment Processing Fees
Annual subscriptions incorporate simplified upfront billing and revenue recognition conventions.
The model distinguishes subscription cash collections from recognized subscription revenue.
Outstanding prepaid subscription amounts are connected to simplified deferred revenue calculations.
This helps users evaluate the different impacts of subscription billing on profitability, cash flow and the balance sheet.
━━━━━━━━━━━━━━━━━━━━
📲 IN-APP PURCHASE MONETIZATION
Estimate revenue from digital purchases made within the app.
Examples include:
• Premium App Features
• Virtual Goods
• Digital Content
• Additional User Functionality
• Optional In-App Transactions
Financial assumptions incorporate:
• Active User Activity
• Purchasing Conversion Rates
• Average Transaction Values
• Purchase Frequency
• Applicable Platform Commissions
The resulting calculations feed net revenue and the connected financial statements.
━━━━━━━━━━━━━━━━━━━━
📢 ADVERTISING REVENUE ENGINE
Evaluate advertising income generated by app users.
Advertising revenue assumptions include:
• Monthly Active Users
• Advertising Impressions
• Impression Frequency
• Revenue per Mille (RPM)
• Advertising Network Fees
The model connects user engagement assumptions with advertising monetization and net revenue.
This enables comparison of subscription income, in-app purchases and advertising as different sources of app revenue.
━━━━━━━━━━━━━━━━━━━━
✨ FREEMIUM CONVERSION ECONOMICS
Understand the commercial role of free users.
The freemium model supports analysis of:
• Free User Acquisition
• Active Free Users
• Paid Subscription Conversion
• In-App Purchase Opportunities
• Advertising Monetization
• Subscriber Retention
Freemium is modeled as an acquisition and conversion mechanism rather than a separate fourth cash revenue stream.
This distinction helps avoid counting freemium activity as revenue before an actual modeled monetization event occurs.
━━━━━━━━━━━━━━━━━━━━
💼 OPERATING EXPENSES & STARTUP COST STRUCTURE
Connect mobile app growth assumptions with operating expenses and business infrastructure requirements.
The TEAM & OPEX module includes financial planning assumptions for:
• Employee Headcount
• Salaries and Payroll
• Marketing Expenditure
• Hosting and Server Infrastructure
• Customer Support
• General Operating Expenses
• Business Administration
• Other Recurring Costs
Capital investment and financing assumptions are managed separately through CAPEX & DEBT.
The connected financial schedules support analysis of operating profitability, cash burn and funding needs.
━━━━━━━━━━━━━━━━━━━━
🏦 THREE INTEGRATED FINANCIAL STATEMENTS
Translate operating assumptions into a connected monthly financial forecast.
📄 INCOME STATEMENT – PROFIT & LOSS
Review subscription revenue, in-app purchase revenue, advertising income, direct expenses, gross profit, operating expenditure, EBITDA, depreciation, financing costs, simplified taxes and net income.
💵 CASH FLOW STATEMENT
Monitor operating cash movements, investment spending, financing activities, monthly cash burn and closing cash balances.
🏛️ BALANCE SHEET
Track cash, accounts receivable, fixed assets, accounts payable, deferred subscription revenue, financing balances and shareholder equity.
The model links operating schedules, monetization calculations, expenses and simplified financing to the three financial statements.
A dedicated MODEL CHECKS worksheet supports reconciliation across the forecast.
━━━━━━━━━━━━━━━━━━━━
📈 CUSTOMER UNIT ECONOMICS & STARTUP KPIs
Analyze the relationship between acquisition costs, customer monetization and retention.
The UNIT ECONOMICS worksheet supports calculations including:
• Customer Acquisition Cost (CAC)
• Estimated Customer Lifetime Value (LTV)
• LTV/CAC Ratio
• CAC Payback
• Revenue per User
• Subscription Retention
• Gross Margin
• Operating Profitability
• Monthly Cash Burn
• Cash Runway
• Estimated Funding Requirements
These financial ratios provide illustrative planning insights rather than independently verified business performance benchmarks.
LTV, payback and cash runway are calculated using simplified financial modeling assumptions.
━━━━━━━━━━━━━━━━━━━━
🔀 THREE INTEGRATED OPERATING SCENARIOS
Explore alternative mobile app business conditions without rebuilding the workbook.
Select one of three scenarios through the central assumptions framework.
🟢 BASE CASE
Reference acquisition, pricing, retention, subscription conversion and expense assumptions.
🔵 UPSIDE CASE
More favorable modeled acquisition efficiency, subscriber conversion, customer retention and advertising monetization.
🟠 DOWNSIDE CASE
More conservative assumptions incorporating weaker customer acquisition, retention, conversion and advertising performance.
Scenario adjustments feed the connected operating calculations, financial statements, cash forecasts and dashboard indicators.
The model recalculates the selected case rather than maintaining three separate complete financial forecasts simultaneously.
━━━━━━━━━━━━━━━━━━━━
✅ MODEL CHECKS & FINANCIAL VALIDATION
A dedicated MODEL CHECKS worksheet supports the review of selected model relationships.
Implemented control areas include:
✓ Financial Statement Reconciliation
✓ Cash Flow Consistency
✓ Debt and Financing Relationships
✓ Revenue Calculations
✓ User and Subscriber Relationships
✓ Operating Model Integrity
✓ Financial Warning Indicators
The workbook provides monthly reconciliation outputs to support structured financial review.
Passing internal checks indicates that selected calculation relationships reconcile.
It does not establish commercial viability, adequate financing or guaranteed profitability.
Negative operating performance, cash shortages and funding needs require independent evaluation.
━━━━━━━━━━━━━━━━━━━━
📦 WHAT'S INCLUDED
📗 1 EDITABLE EXCEL FINANCIAL MODEL (.XLSX)
14 interconnected worksheets:
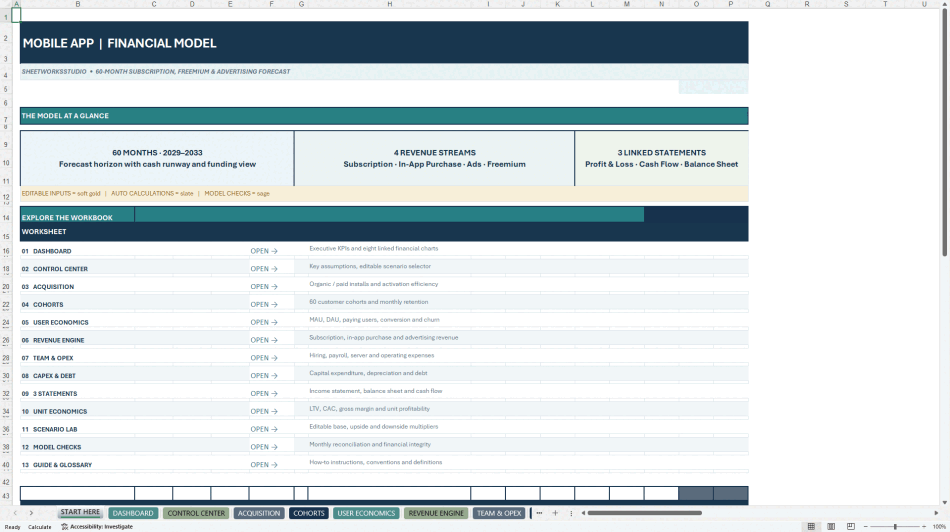
01 – START HERE
Workbook introduction, instructions and navigation.
02 – DASHBOARD
Executive KPIs and eight linked financial and operating charts.
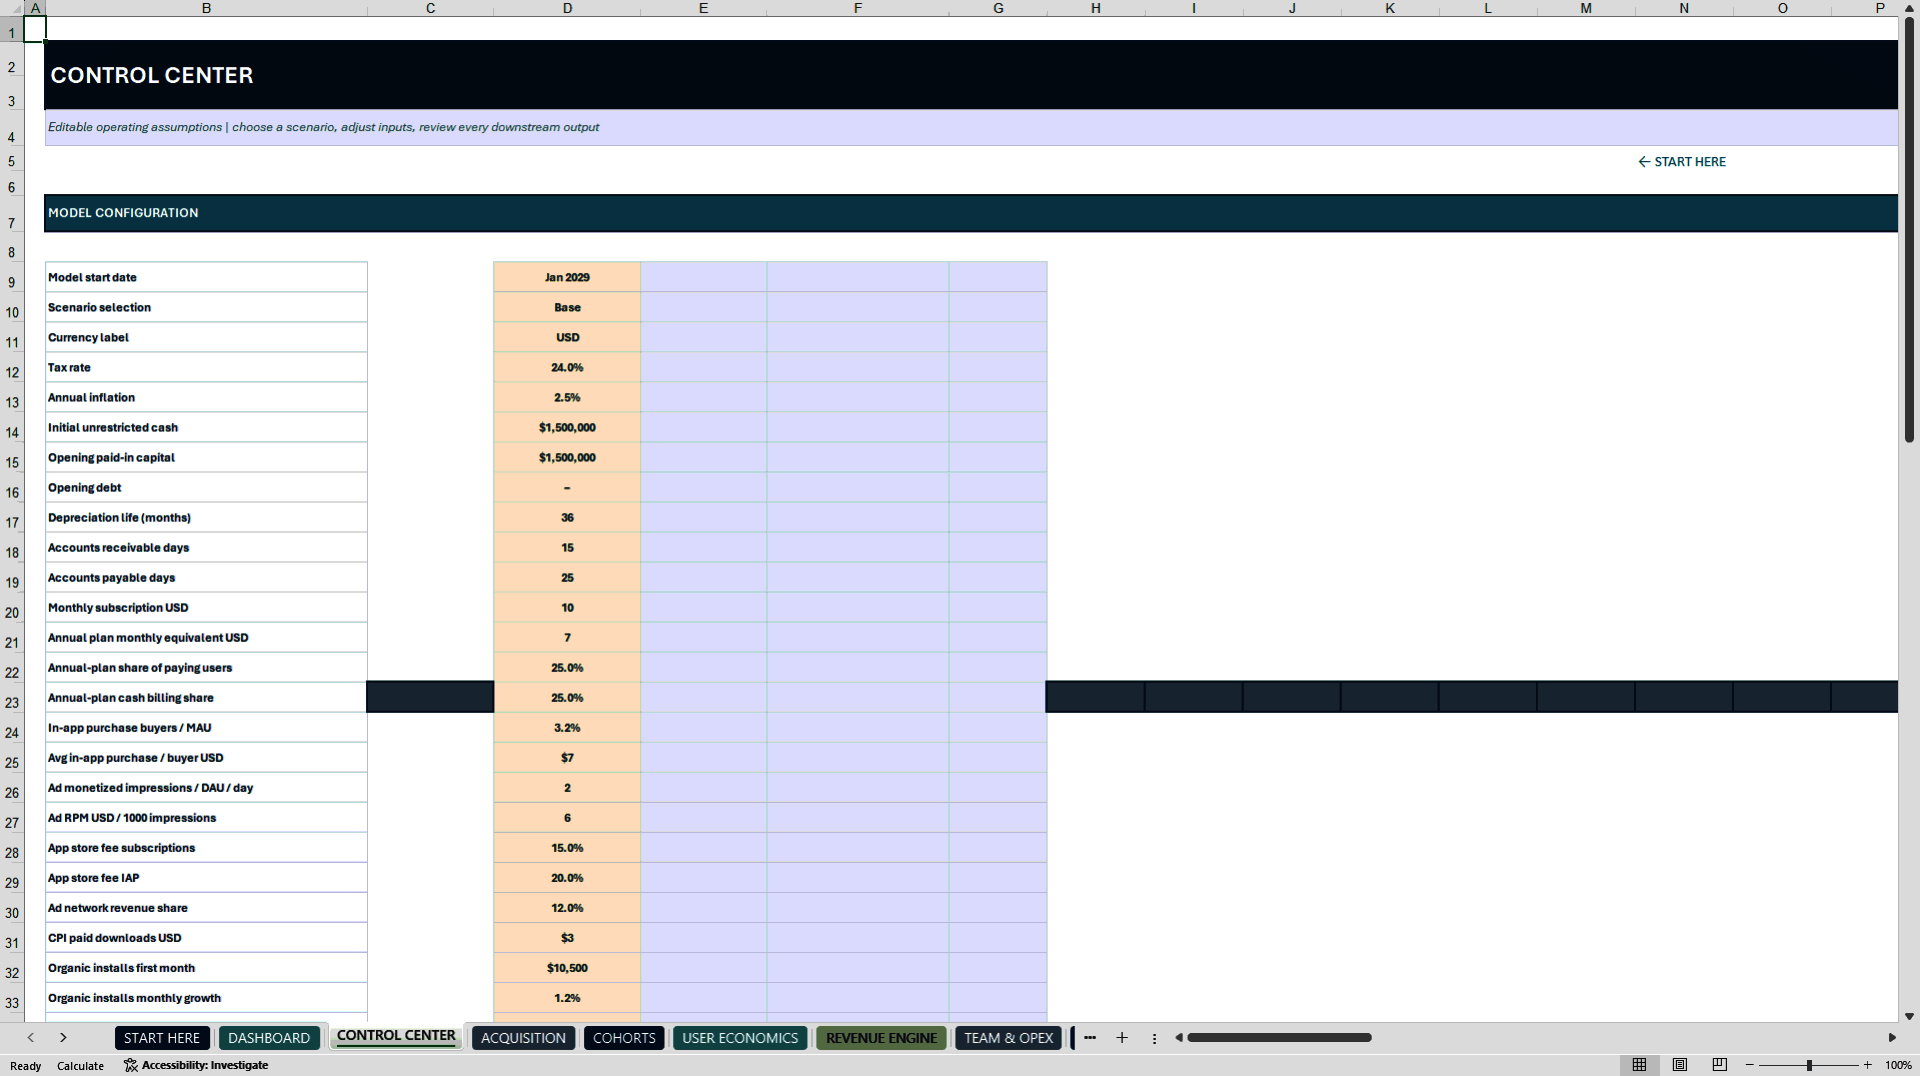
03 – CONTROL CENTER
Central assumptions, inputs and scenario selection.
04 – ACQUISITION
Paid and organic app-user acquisition.
05 – COHORTS
60 monthly acquisition cohorts and retention calculations.
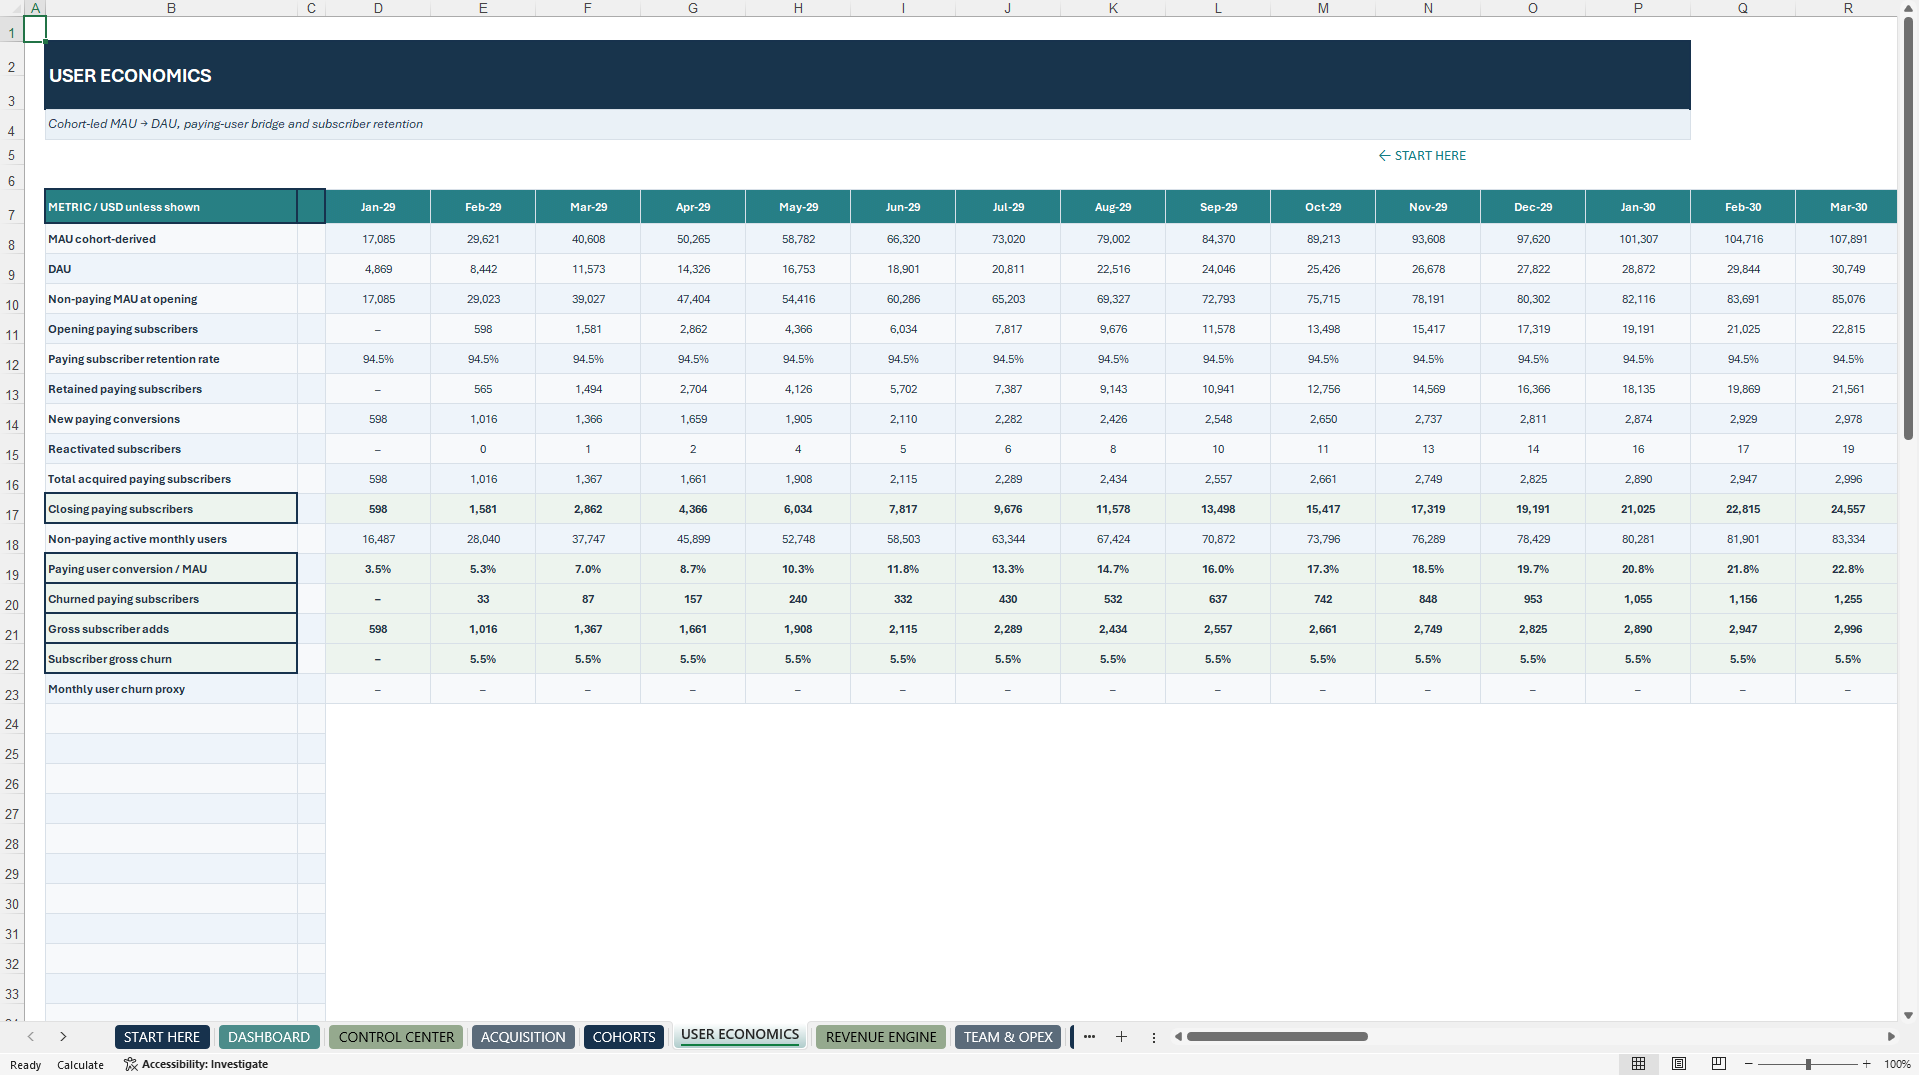
06 – USER ECONOMICS
Active users, subscriber development and churn.
07 – REVENUE ENGINE
Subscriptions, in-app purchases and advertising.
08 – TEAM & OPEX
Employee planning, payroll and recurring expenditure.
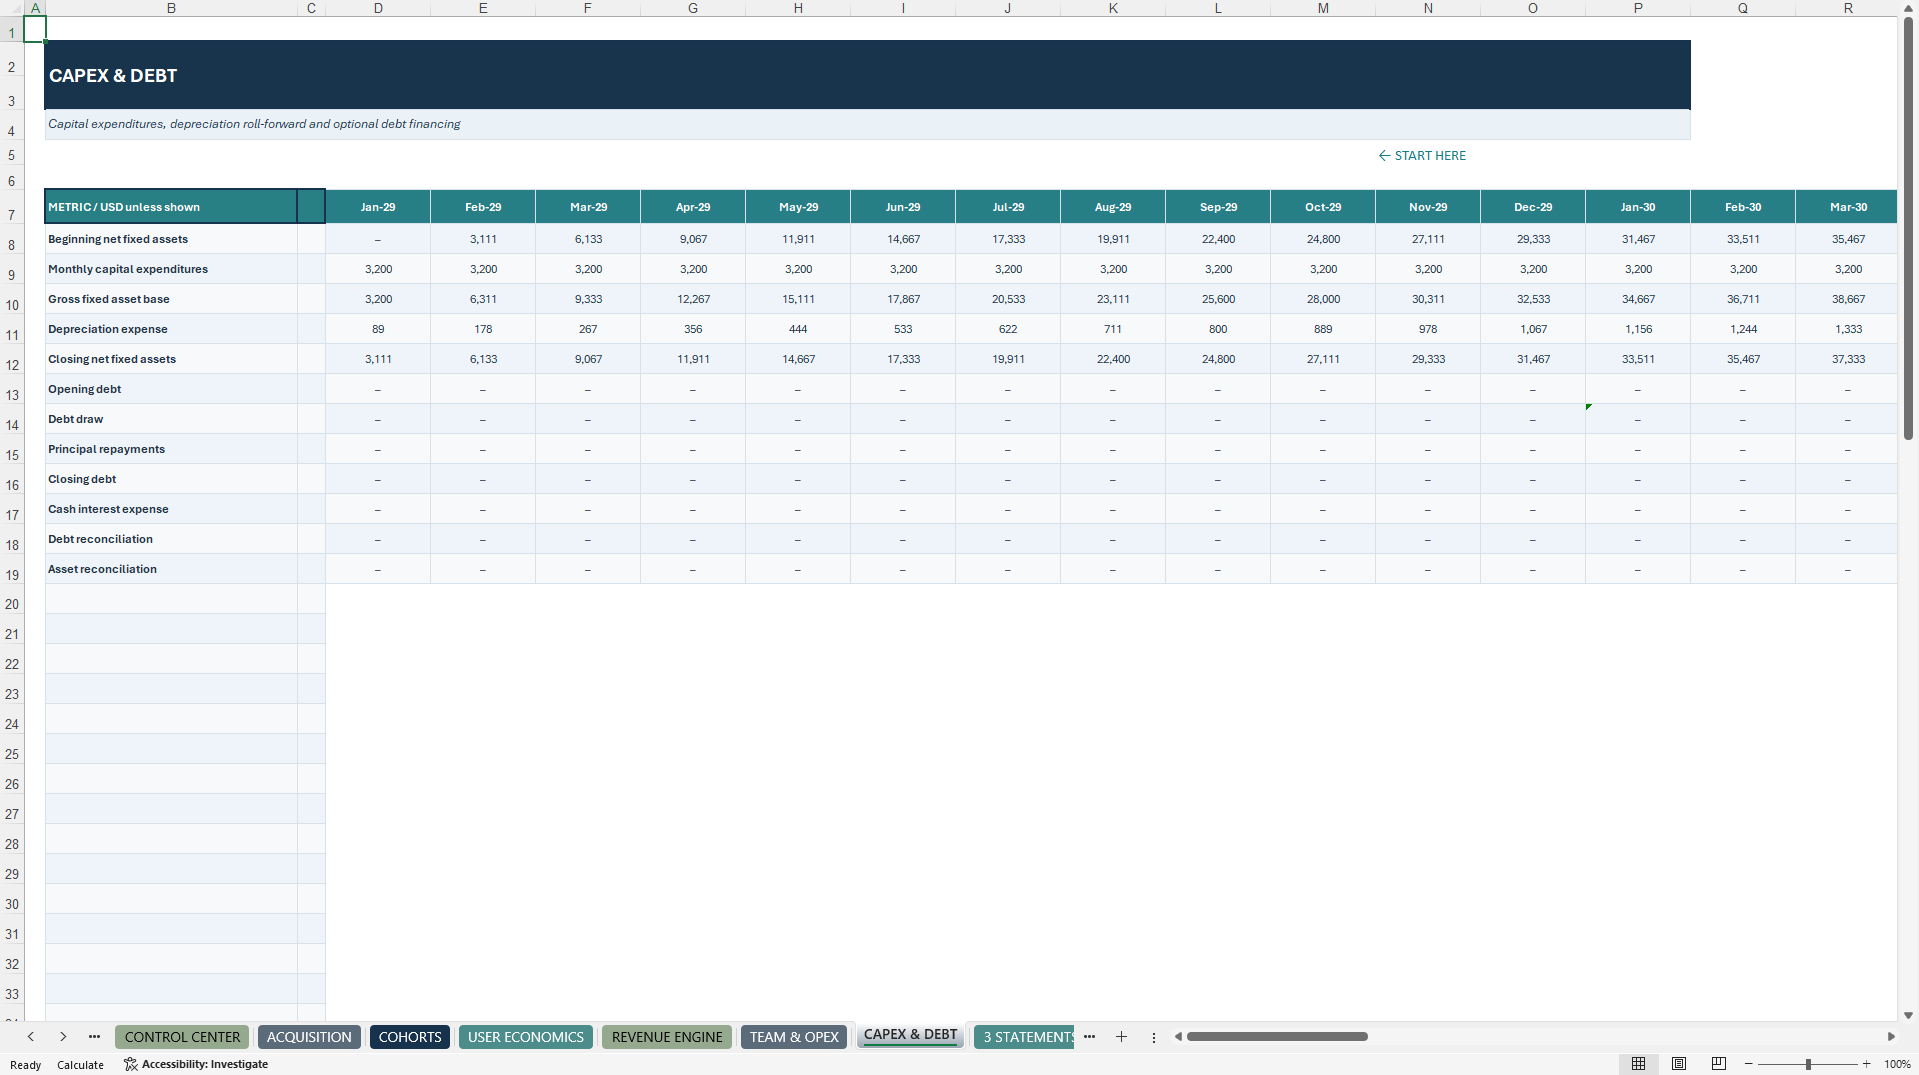
09 – CAPEX & DEBT
Capital investment, depreciation and simplified financing.
10 – 3 STATEMENTS
Integrated Income Statement, Balance Sheet and Cash Flow.
11 – UNIT ECONOMICS
CAC, LTV, retention economics and operating performance.
12 – SCENARIO LAB
Base, Upside and Downside operating assumptions.
13 – MODEL CHECKS
Monthly calculation reconciliation and warning indicators.
14 – GUIDE & GLOSSARY
Workbook instructions, terminology and explanations.
📘 1 PROFESSIONAL HOW-TO-USE PDF GUIDE
16 pages of English documentation covering:
• Workbook Navigation and Setup
• Editable Financial Assumptions
• Paid and Organic User Acquisition
• Customer Cohorts and Retention
• Monthly and Annual Subscriptions
• In-App Purchase Revenue
• Advertising Monetization
• Operating Expenses
• Integrated Financial Statements
• Customer Unit Economics
• Scenario Analysis
• Financial Model Validation
• Troubleshooting and Limitations
━━━━━━━━━━━━━━━━━━━━
🧭 HOW TO USE THE MODEL
① CONFIGURE YOUR BUSINESS
Open START HERE and review the workbook structure.
Use CONTROL CENTER to enter your starting date, acquisition assumptions, subscription prices, operating expenses and preferred scenario.
② REVIEW USER ACQUISITION
Examine ACQUISITION, COHORTS and USER ECONOMICS to understand user growth, retention and paying subscriber development.
③ CONFIGURE MONETIZATION
Update subscription pricing, conversion rates, in-app purchase assumptions and advertising parameters.
④ REVIEW COSTS & FINANCING
Adjust team expenses, operating costs, capital investment and simplified debt or equity financing assumptions.
⑤ EVALUATE FINANCIAL PERFORMANCE
Review the three financial statements, executive dashboard, customer unit economics, cash burn and funding requirements.
⑥ COMPARE SCENARIOS
Switch between Base, Upside and Downside to investigate alternative commercial outcomes.
⑦ VALIDATE YOUR FORECAST
Inspect MODEL CHECKS, financial reconciliation and liquidity warnings before interpreting projected results.
━━━━━━━━━━━━━━━━━━━━
🎯 WHO IS THIS MODEL FOR?
Suitable for:
• Mobile App Founders
• Subscription-Based App Businesses
• Freemium App Developers
• Consumer Mobile Startups
• Startup CFOs and Finance Teams
• Product Managers
• Growth Marketing Teams
• Financial Analysts
• Startup Consultants
• Early-Stage Investors
• Business Incubators and Accelerators
• Startup Finance Educators
━━━━━━━━━━━━━━━━━━━━
⚙️ TECHNICAL SPECIFICATIONS
📅 Forecast Horizon: 60 Monthly Periods
🗓️ Illustrative Timeline: January 2029 – December 2033
📗 Workbook Structure: 14 Excel Worksheets
👥 Monthly Acquisition Cohorts: 60
🔀 Financial Scenarios: 3
📊 Native Dashboard Charts: 8
💳 Subscription Models: Monthly and Annual
📱 Monetization: Subscriptions, In-App Purchases and Advertising
🏦 Financial Statements: Income Statement, Balance Sheet and Cash Flow
📈 Customer Economics: CAC, LTV, LTV/CAC and CAC Payback
📘 Documentation: 16-Page English PDF Guide
💻 File Format: Editable Microsoft Excel .xlsx
🔒 VBA Macros: None
🔗 Required External Data Connections: None
Microsoft Excel Desktop is the recommended reference application.
Google Sheets import compatibility, native-chart fidelity and cross-platform formula behavior have not been independently verified.
The workbook uses simplified assumptions for subscription recognition, deferred revenue, renewals, working capital, taxation, financing and cash runway.
The model does not provide a complete discounted cash flow valuation, detailed capitalization table or investor ownership dilution analysis.
━━━━━━━━━━━━━━━━━━━━
🛡️ IMPORTANT INDEPENDENT TEMPLATE DISCLAIMER
This product is an independent, unofficial financial-planning template developed by SheetworksStudio.
All app-user data, subscription prices, cohort retention assumptions, marketing costs and financial projections are fictional and illustrative.
The workbook is not a live analytics service, subscription billing platform, statutory accounting system, independently audited financial forecast or certified investment valuation model.
No customer acquisition performance, retention rate, subscription revenue, profitability, liquidity or future investment outcome is guaranteed.
The calculations use simplified operating, accounting and financing assumptions that must be independently validated for actual business use.
This product does not constitute individualized accounting, legal, tax, financial or investment advice.
Users should obtain appropriate professional advice before making actual business or investment decisions.
━━━━━━━━━━━━━━━━━━━━
📱 PLAN USER GROWTH. MODEL MONETIZATION. FORECAST PROFITABILITY.
Bring customer acquisition, retention, recurring subscriptions, digital monetization and long-term financial planning together in one structured 60-month mobile app financial model.
Got a question about the product? Email us at support@flevy.com or ask the author directly by using the "Ask the Author a Question" form. If you cannot view the preview above this document description, go here to view the large preview instead.
Source: Best Practices in Mobile App, Integrated Financial Model Excel: Mobile App Financial Model - 60-Month Forecast Excel (XLSX) Spreadsheet, SheetworksStudio
ABOUT THE AUTHOR

SheetworksStudio creates premium Excel-based business templates, dashboards, trackers, financial models, and management systems for professionals, consultants, entrepreneurs, and organizations.
Our portfolio covers finance, project management, operations, risk management, compliance, AI governance, HR, supply chain, performance management, and business planning. Each product is designed to
... [read more]
Ask the Author a Question
You must be logged in to contact the author.