

LP-Protected JV Waterfall with Dual Return Hurdles – Excel XLSX
Excel (XLSX)
VIDEO DEMO
BENEFITS OF THIS DOWNLOADABLE EXCEL DOCUMENT
- This single-tab JV waterfall template can be dropped into any annual cash flow model with minimal effort, enabling faster, more consistent deal analysis without rebuilding waterfall logic from scratch.
- The "IRR or MOIC, whichever comes first" Tier 3 mechanic clearly defines when distribution splits change, helping both LPs and GPs model, negotiate, and communicate return targets and promote step-ups with confidence.
- With fully visible, editable formulas and built-in IRR/MOIC sensitivity tables, the template improves auditability and speeds scenario testing so users can understand exactly what drives outcomes and how changes impact LP/GP distributions.
JOINT VENTURE EXCEL DESCRIPTION
Joint Venture Waterfall Template – Mechanics and Final Outputs
This template is built to model JV economics in a way that's faithful to operating agreement language while staying clean, auditable, and easy to integrate. It assumes you already have annual distributable (or distributed) cash flows in an existing model and want a waterfall that can be dropped in without rebuilding your whole workbook.
Mechanics
1) Timeline and cash flow structure
The template runs over:
• Initial investment year (the contribution period), plus
• Up to 10 annual operating/distribution years
Mechanically, the template treats the deal as a time series:
• Contributions (typically negative cash flow) occur in the initial period
• Distributions (positive cash flow) occur annually thereafter
Because the model is annual, IRR and MOIC are evaluated on an annual basis using the same "LP cash flow stream" the waterfall is generating.
2) Capital contributions and ownership funding
A key setup input is the initial contribution rate for:
• LP contribution %
• GP contribution %
Mechanically, this determines:
• how much capital each party is considered to have funded, and
• how much "LP capital" the waterfall must return (and/or accrue pref on) before promote-type tiers begin
This matters because the template evaluates hurdles based on the amount due to the LP.
3) Single-tab waterfall engine (how each year allocates cash)
Each year, the template takes the annual distributable/distributed cash flow and routes it through tiers in order. The allocation is typically structured like an "available cash bucket":
For each year:
Start with Available Cash
• Allocate to Tier 1 until Tier 1 is satisfied (or cash runs out)
• Remaining cash goes to Tier 2, then Tier 3, then Tier 4
• Each tier can have its own LP/GP split
• Because everything lives on one tab, you can trace:
• beginning balances,
• what was due,
• what was paid,
• and what remains due after each year.
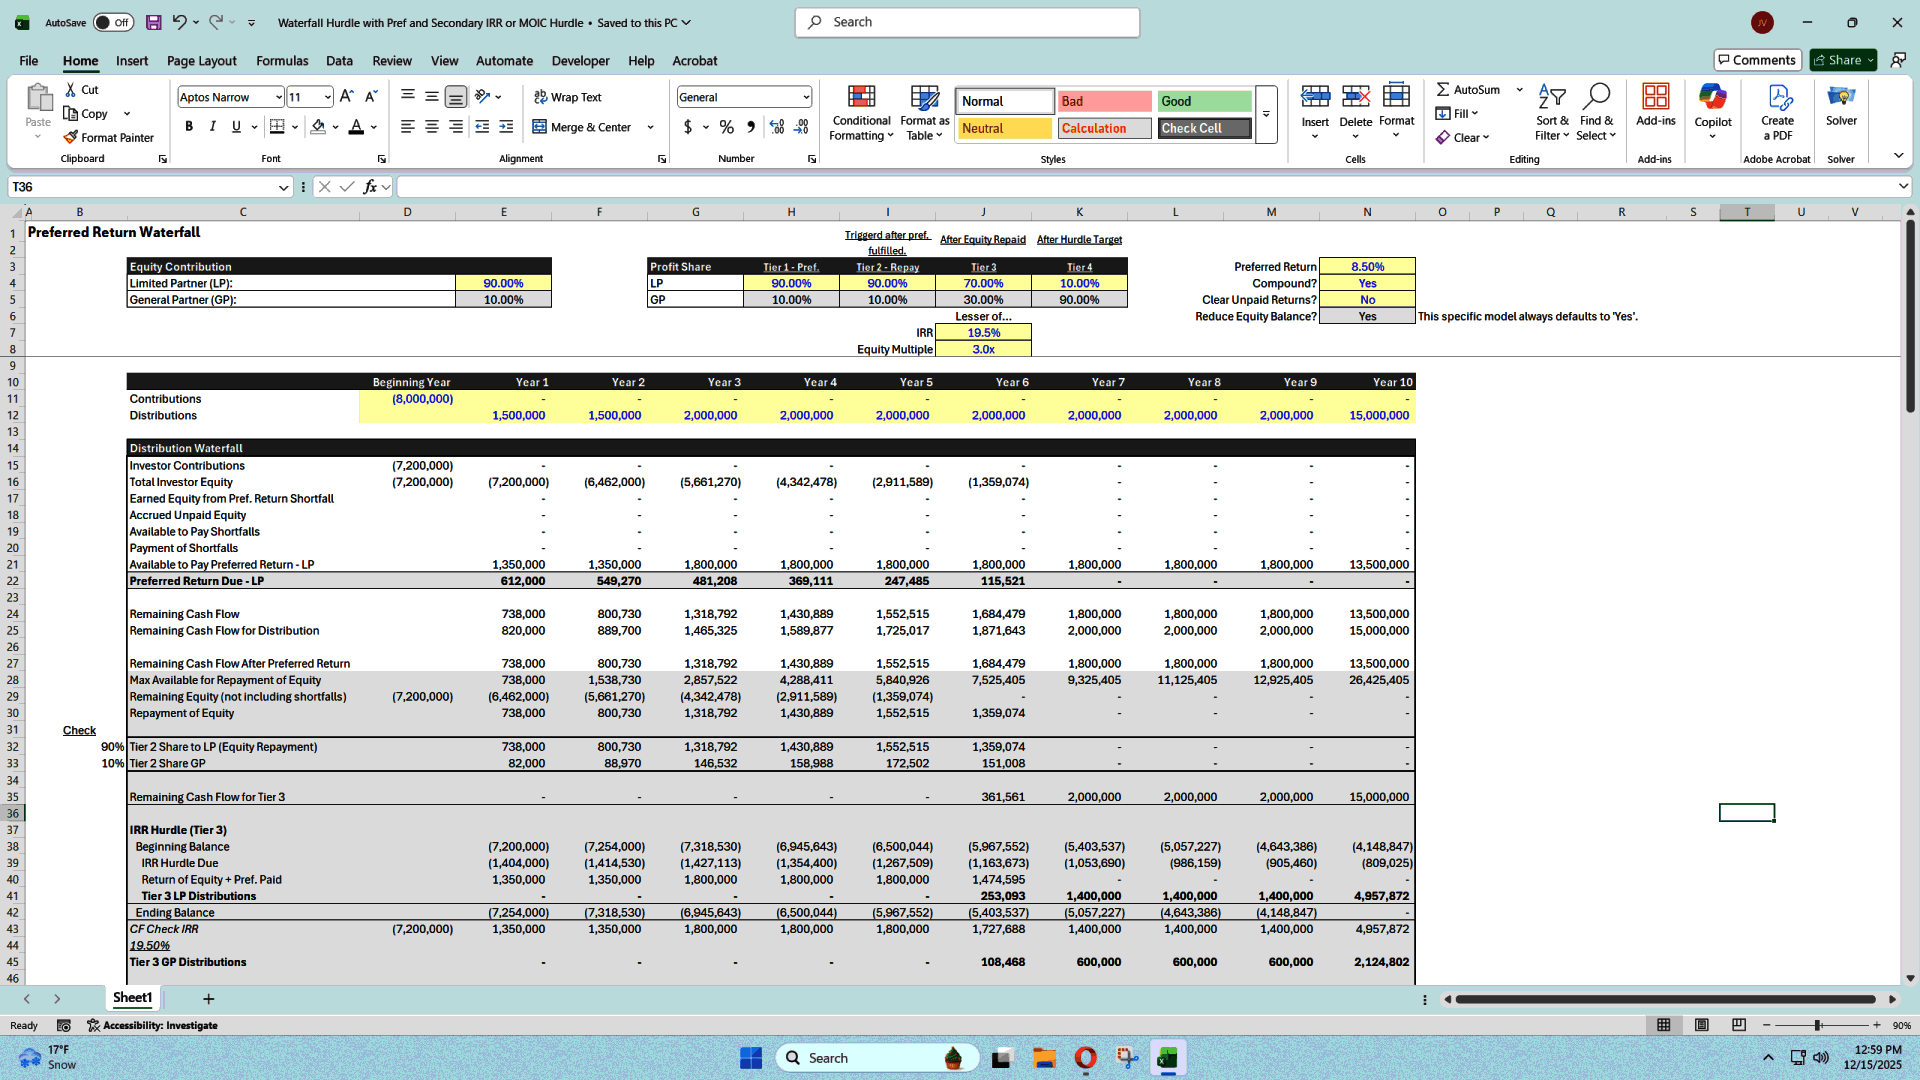
4) Tier definitions and hurdle checks
Tier 1 – Preferred Return
Goal: Pay the LP their preferred return (to the extent it is due and unpaid).
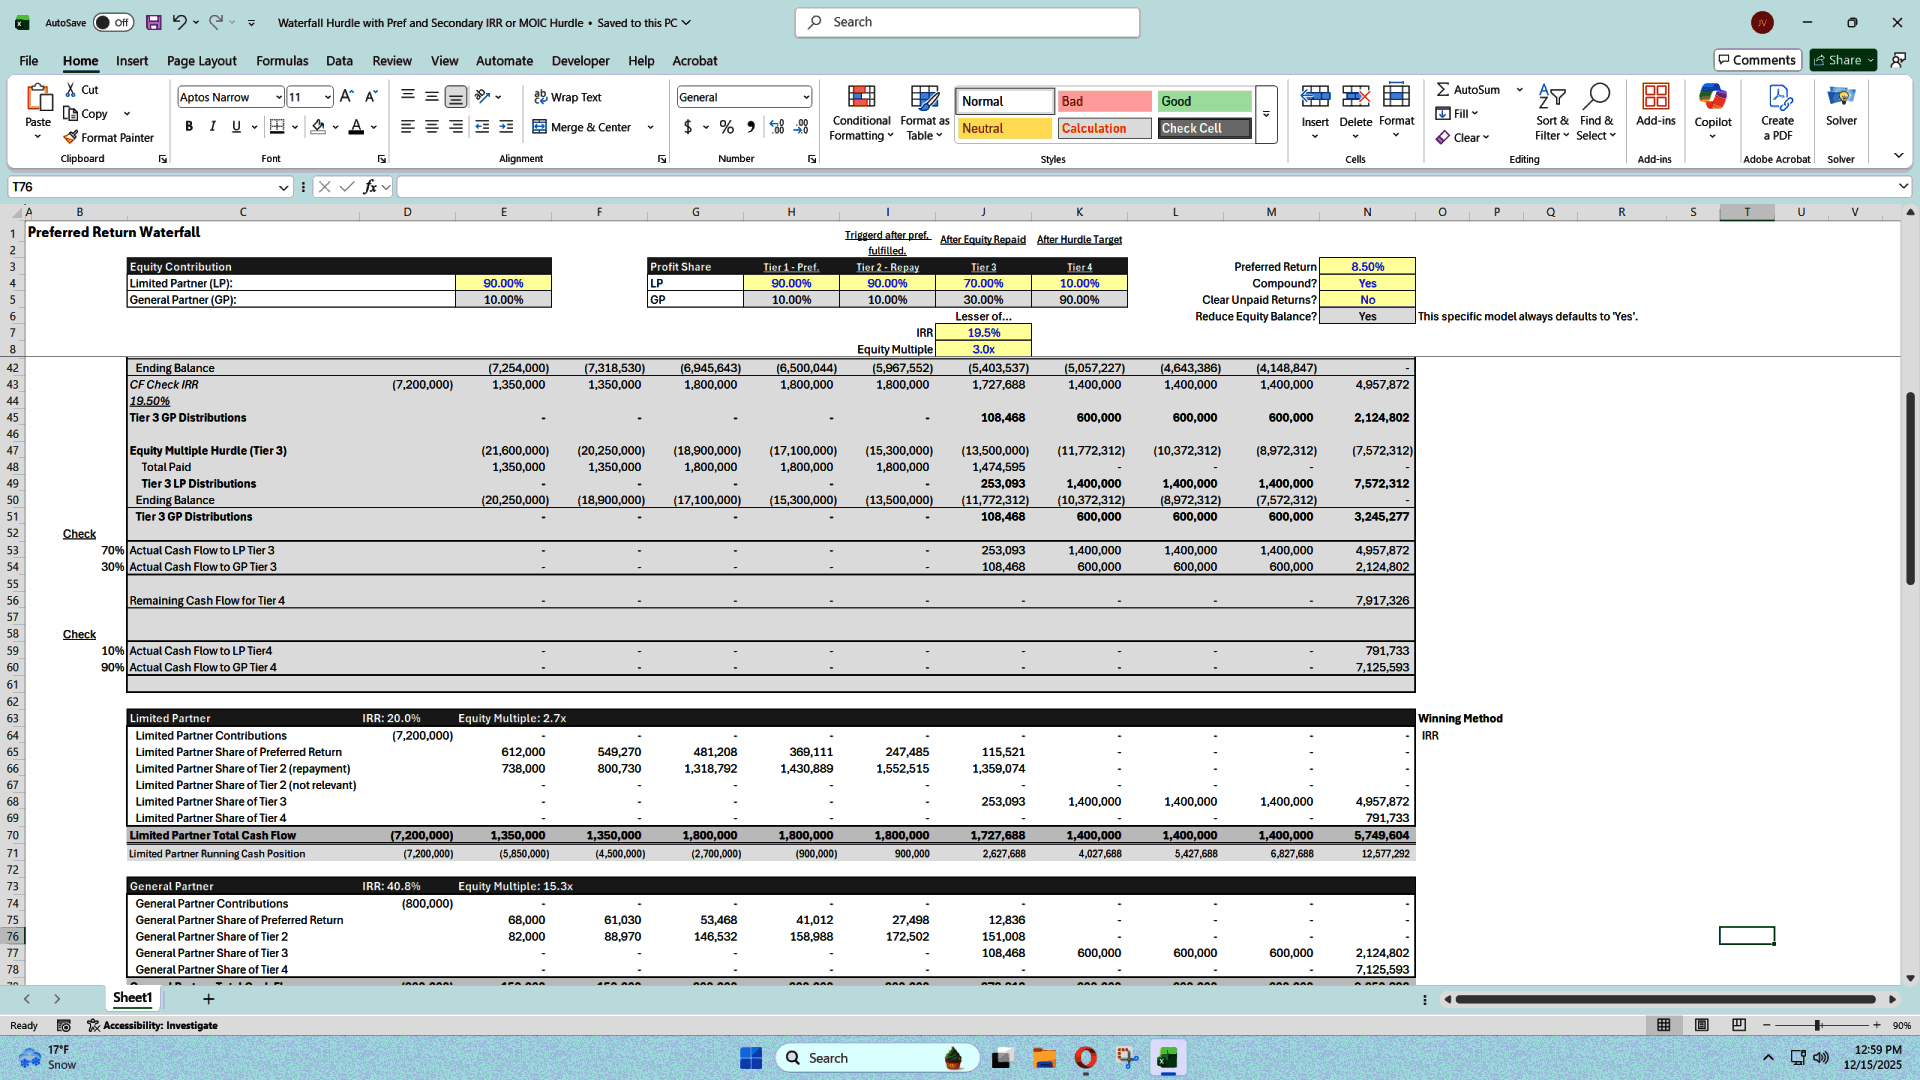
Mechanically, the template tracks a running "LP pref due" concept and allocates available cash into that balance first.
Common implementations accrue pref on some definition of LP capital outstanding; your version is intentionally transparent and editable so it can be aligned to the exact operating agreement definition.
Output impact:
This tier creates a clear "pref paid / pref remaining" audit trail, year by year.
Tier 2 – Equity Repayment (Return of Capital)
Goal: Return the LP's invested capital (and typically GP capital as well if the agreement is pari passu—your template can reflect this via configurable splits and contribution assumptions).
Mechanically:
The model tracks LP capital contributed vs. capital returned.
Distributions are applied to reduce "LP capital outstanding" until it hits zero (or until cash runs out).
Output impact:
This tier determines when the LP is "made whole" on principal before moving into incentive-heavy tiers.
Tier 3 – Split until IRR or MOIC is hit (whichever comes first)
This is the signature mechanic of the template.
Goal: Split cash flow at a defined LP/GP percentage until the LP hits either:
• a target IRR, or
• a target MOIC (equity multiple)
• whichever occurs first.
Mechanically, this works like a live gate:
The template builds the LP cash flow stream to date (LP contributions and LP distributions generated by the waterfall).
Each year it computes:
• LP MOIC = cumulative LP distributions ÷ cumulative LP contributions (or equivalent definition)
• LP IRR = annual IRR based on the LP time series
It checks the condition:
Has LP IRR reached its target OR has LP MOIC reached its target?
• If no, the current year's remaining cash continues to be allocated under Tier 3 split %.
• If yes, the model flags the hurdle as met and routes subsequent cash to Tier 4.
Why this is mechanically valuable:
It prevents ambiguity when one metric reaches the finish line before the other and makes the "switch point" explicit in the schedule (including the year it happens).
Tier 4 – Thereafter / Final promote split (post-hurdle adjustment)
Goal: After the Tier 3 condition is satisfied (if it is satisfied), apply a final split—often a higher GP/operator share—because the LP has reached their negotiated return target.
Mechanically:
Once Tier 3 is met, the remaining years' cash flows (and any remaining cash in the trigger year, depending on structure) are allocated using the final split percentages.
Output impact:
This tier is what ultimately drives the "promote" economics and shows the GP's upside after performance hurdles are cleared.
5) Per-tier split flexibility
A core mechanic is that each tier can use a different LP/GP split percentage.
That means the template can represent:
• pure LP until pref is caught up,
• pari passu return of capital,
• intermediate split while return targets are being approached,
• and a final promote-heavy split after hurdles are met.
This is the "operating-agreement realism" that basic waterfalls often miss.
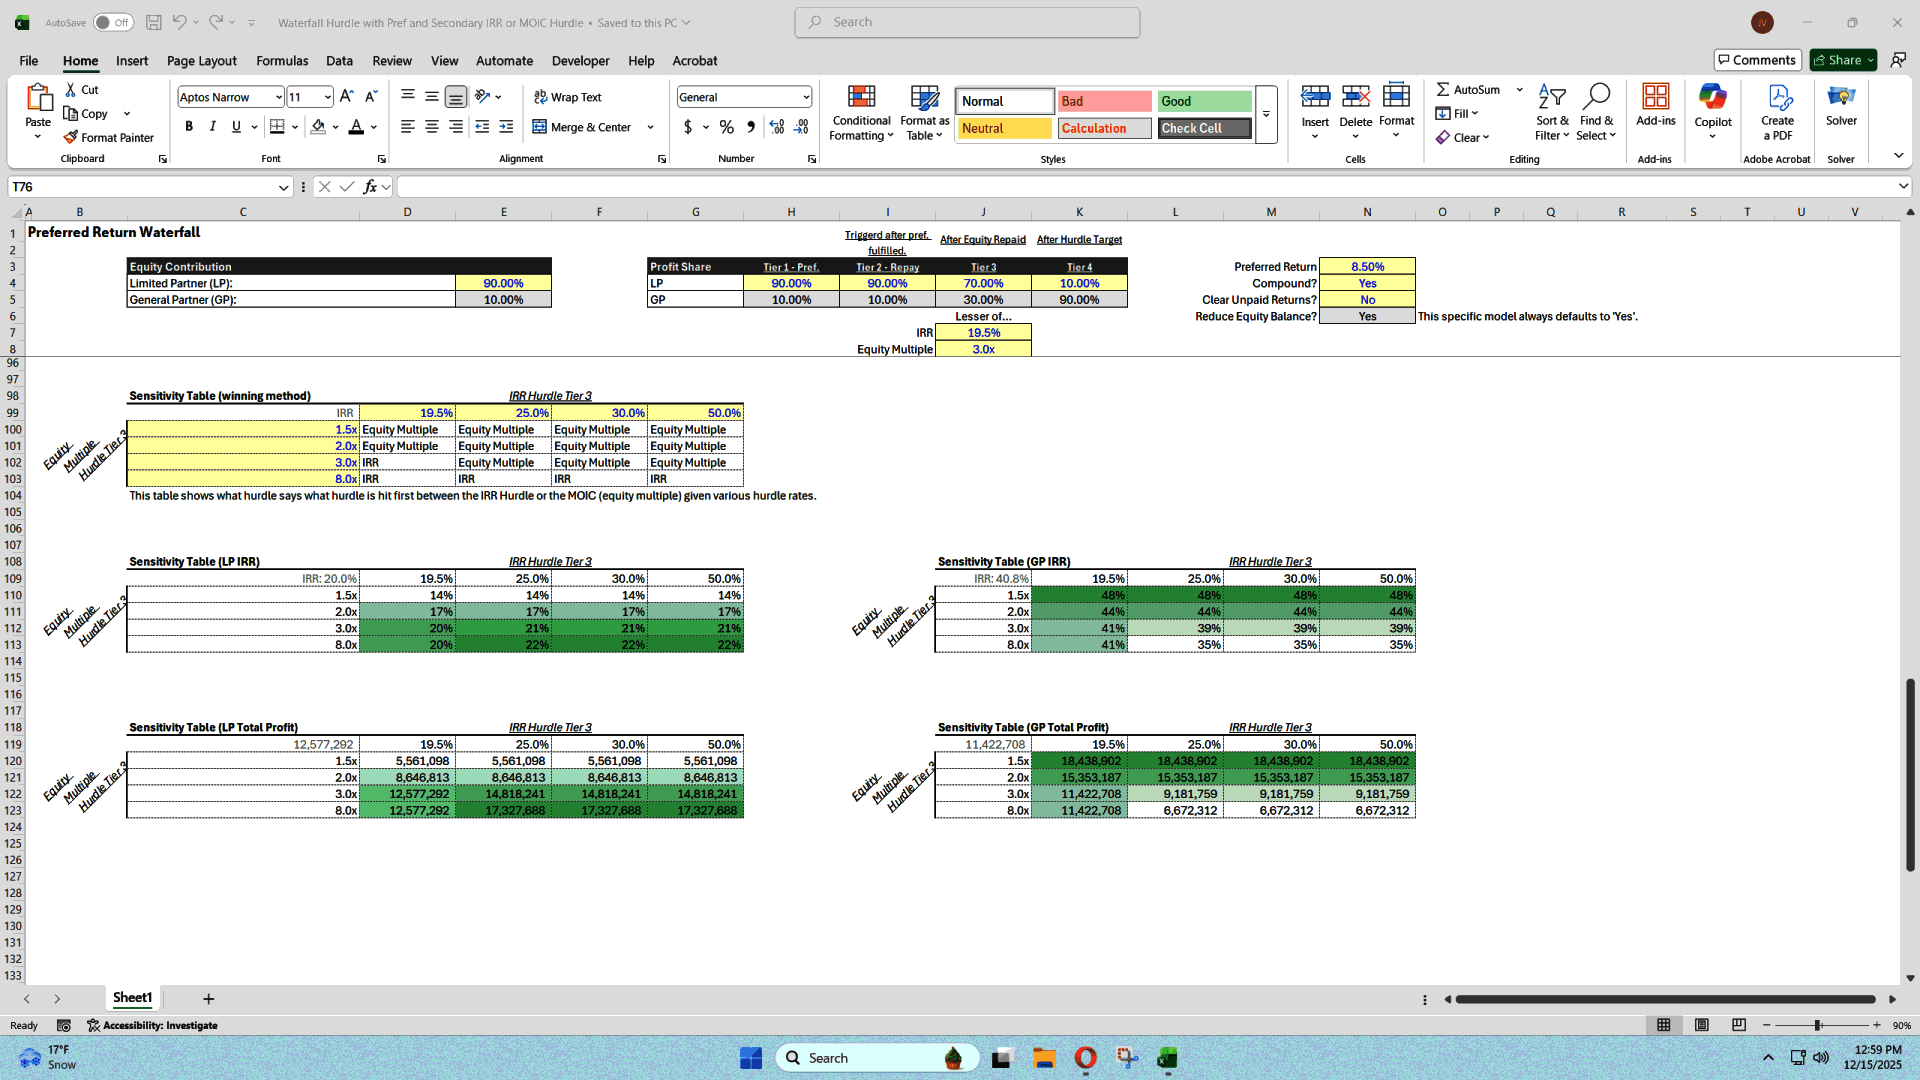
6) Sensitivity mechanics (IRR/MOIC-driven tables)
The template includes five data tables designed specifically to sensitize the inputs that drive the Tier 3 gate:
• IRR target(s)
• MOIC target(s)
Mechanically, these show how changing those thresholds impacts:
• when Tier 3 flips to Tier 4,
• and therefore the ultimate distribution split over the hold period.
Final Results (what the template produces)
1) Full distribution schedule by year
You get a year-by-year breakdown of:
• total available cash
• how much cash is allocated to each tier
• how much the LP receives each year
• how much the GP receives each year
This schedule is the "answer key" for the JV economics.
2) Tier-by-tier audit trail (what was due vs. what was paid)
The template effectively produces a running ledger showing:
• Preferred return due / paid / remaining
• LP capital outstanding / repaid / remaining
• When Tier 3 condition is met (and which metric triggered it)
• Post-hurdle promote splits applied
This is especially useful for:
• investment committee review,
• operating agreement tie-outs,
• and partner conversations where you need to show exactly why a split changed.
3) Realized LP return metrics (driven by waterfall outputs)
Because the hurdle logic is explicitly based on the LP's cash flows, the template produces clear realized metrics such as:
• LP IRR (annual-series IRR based on modeled timing)
• LP MOIC / Equity Multiple
• implied "hurdle achieved year" and the "metric that achieved it first"
These are not abstract targets—they're calculated from the same allocations you're distributing.
4) Promote / GP upside visibility
Once Tier 3 flips and Tier 4 applies, the template makes it easy to see:
• how much incremental cash the GP receives due to the promote step-up,
• how sensitive that is to the IRR/MOIC targets,
• and how much of GP economics is concentrated in the back end of the deal.
5) Scenario-ready outputs via sensitivity tables
The sensitivity tables allow you to quickly compare:
• tighter vs. looser investor return thresholds,
• earlier vs. later promote activation,
• and resulting LP/GP distribution outcomes
This is the "final results layer" that turns the waterfall from a one-off calculation into a decision tool.
One-line takeaway
Mechanically, this template is a single-tab annual cash flow waterfall that allocates distributions through pref → capital return → dual-metric (IRR or MOIC) trigger split → final promote, producing a fully auditable distribution schedule plus clear realized LP returns and promote outcomes.
Got a question about the product? Email us at support@flevy.com or ask the author directly by using the "Ask the Author a Question" form. If you cannot view the preview above this document description, go here to view the large preview instead.
Source: Best Practices in Joint Venture Excel: LP-Protected JV Waterfall with Dual Return Hurdles Excel (XLSX) Spreadsheet, Jason Varner | SmartHelping
ABOUT THE AUTHOR
I graduated in 2011 with a Bachelor's degree in Accounting and began my career as a financial analyst at a small chain of auto repair shops. After gaining valuable experience, I launched my own practice specializing in real estate underwriting, later expanding into general business modeling.
I honed my spreadsheet modeling expertise by completing over 400 projects on Upwork with a 100% success
... [read more]
Ask the Author a Question
You must be logged in to contact the author.
