
Layer Poultry Farm 10-Year 3 Statement Financial Model – Excel XLSX
Excel (XLSX)
BENEFITS OF THIS DOWNLOADABLE EXCEL DOCUMENT
- Offers a structured approach to developing a sales strategy aligned with your business goals.
- Delivers practical guidance for improving sales performance across your organization.
- Supports the creation of a scalable sales process tailored to your market and customers.
POULTRY FARMING EXCEL DESCRIPTION
Curated by McKinsey-trained Executives
🐔 Layer Poultry Farm Advanced 3-Statement Financial Model (10-Year Forecast)
The Only Institutional-Grade Layer Farm Financial Model Built From Real Flock Operations – Not Generic Growth Rate Assumptions 📊
The Layer Poultry Farm Advanced 3-Statement Financial Model is a fully integrated 10-year Excel financial forecasting workbook built specifically for layer poultry operations, agribusiness investors, and agricultural lenders. Every revenue line, every feed cost, every cash flow projection is driven by real farm operational assumptions – flock size, egg production rates, mortality curves, feed consumption, and sales channel pricing – not percentage growth inputs that bear zero resemblance to how a laying hen operation actually works.
If your business houses hens, produces eggs, and needs to demonstrate financial credibility to agricultural lenders, equity investors, government programs, or strategic buyers – this is the only layer farm financial model you will ever need.
✅ Fully integrated 3-statement financial model – Income Statement, Balance Sheet, Cash Flow Statement
✅ Operationally driven from flock inventory, egg production rates, mortality, and feed consumption
✅ Institutional color-coded formatting – blue hardcoded inputs, black formula cells, green cross-sheet links
✅ Built for farm owners, agribusiness CFOs, agricultural lenders, and poultry investors
✅ Ready to present to rural banks, agricultural equity investors, government programs, and strategic acquirers
📊 Why This Layer Farm Financial Model Is Different
Generic agricultural templates use revenue growth percentages. They have no idea what flock mortality means, what a pullet replacement cycle costs, or how feed price inflation destroys margins on a poorly modeled farm.
This model is different.
Every single output – revenue, gross profit, EBITDA, cash balance – is calculated from real layer farm operational drivers: hen inventory roll-forwards with beginning balance, mortality losses, and replacement pullets; daily egg production rates improving with management efficiency; seasonal production factors by quarter; premium egg mix-shifts toward free-range and organic over time; ten operationally driven COGS lines; role-level personnel costs with hiring plans; and a full 10-year flock expansion and CapEx schedule.
Change one assumption. Watch the entire 10-year model update instantly.
That is how a real layer farm financial model works.
🐓 Flock & Production Model – The Operational Engine Behind Everything
The foundation of every egg production business is flock economics. This model starts exactly there.
The Flock & Production sheet is the core operational engine that drives every revenue line, every COGS calculation, and every working capital movement across the full 10-year forecast.
Model and track across all 10 years:
• Beginning Hens in Lay – opening inventory for each year, linked directly from the prior year's closing balance
• Mortality Losses – hens lost each year, calculated as your mortality rate assumption applied to the live flock
• Replacement Pullets Added – new pullets entering the laying flock, driven by your flock replacement rate
• Ending Hens in Lay – closing inventory after mortality and replacements, with annual flock expansion built in
• Average Hens (Beginning + Ending) / 2 – the active flock figure that drives every revenue and cost calculation
• Eggs per Hen per Day – starting at your base assumption, improving gradually across the forecast with management efficiency gains
• Gross Eggs Produced (Annual Units) – average hens × eggs per hen per day × 365
• Breakage / Waste (3%) – realistic production loss deducted from gross output
• Net Eggs Available for Sale – the clean sellable volume feeding the entire revenue model
• Standard Eggs – volume split driven by your starting standard egg percentage with automatic annual mix-shift
• Free-Range / Organic Eggs – premium volume growing as a share of total production every year
• Day-Old Chicks Sold – a separate production line growing at its own independently set annual growth rate
From these inputs, the model automatically calculates egg volumes by type, revenue by stream, all COGS lines, and working capital requirements – then feeds everything directly into the income statement, cash flow statement, and balance sheet.
No disconnected spreadsheets. No manual overrides. One integrated layer farm model.
💰 Revenue Model – Four Distinct Revenue Streams, All Flock-Driven
Layer farm revenue is not a single line item. This model breaks it into every stream your operation actually generates.
1. Standard Egg Revenue
Net standard egg volume × standard price per egg × annual price escalation compounded over the forecast. Volume flows automatically from the Flock & Production model. Standard egg revenue updates the instant any flock assumption changes.
2. Free-Range / Organic Egg Revenue
Net free-range and organic egg volume × premium price per egg × the same annual price escalation. Mix automatically shifts toward this higher-margin stream every year as your operation expands premium production.
3. Day-Old Chick Sales
Separate revenue for operations with active pullet breeding programs. Chick volume from the production model × price per chick. Grows at its own independent annual rate.
4. Manure, Fertilizer & By-Product Revenue
Two separate by-product lines – manure and fertilizer revenue calculated per average hen per year, and by-product revenue from feathers and culled hens calculated per average hen per year. Both inflation-adjusted annually and scaling automatically as your flock grows.
Total Revenue, Total Egg Revenue, Total Other Revenue, and Revenue Growth % calculated automatically across all 10 years.
📉 Cost of Goods Sold – Ten Operational Cost Lines, All Farm-Driven
Gross margin is the critical number in any egg production business. This model gives you complete visibility into every COGS component – seven variable cost lines and three semi-fixed lines, all calculated from real farm operational inputs.
Variable COGS:
• Feed Costs – the single largest COGS line, calculated per average hen per year with annual feed price inflation compounding across the forecast
• Veterinary & Vaccinations – per-hen annual cost, inflation-adjusted each year
• Packaging & Transport – per egg produced, scaling automatically with every unit of production volume
• Utilities (Power, Water, Heating) – per-hen annual cost, inflation-adjusted
• Bedding & Litter – per-hen annual cost, inflation-adjusted
• Mortality Losses (Replacement Value) – the replacement cost per hen lost, calculated directly from the mortality count in the Flock & Production model
• Biosecurity & Compliance – per-hen annual cost scaling with the live flock
Semi-Fixed COGS:
• Production Labor – production worker headcount × salary, with annual raises, payroll taxes, and benefits – growing with the operation
• Equipment Maintenance – modeled as a percentage of your initial CapEx base, escalating as the asset base ages
• Farm Insurance – calculated as a percentage of total revenue, scaling automatically each year
The sheet calculates Total COGS, Gross Profit, and Gross Margin % – dynamically updated across every year of the forecast.
🧾 Operating Expenses – Three Categories, All Linked to Assumptions
Personnel – Management, Admin & Sales
Three distinct roles modeled separately: Farm Managers, Supervisors, and Admin & Sales Staff. Each with its own salary level, headcount, annual salary raise, payroll tax rate, and benefits percentage. Total Personnel (OpEx) calculated automatically.
Sales & Marketing
Modeled as a percentage of total revenue – the rate is a direct input from your assumptions, scaling the cost as revenue grows across the forecast.
General & Administrative
Two lines: G&A Fixed Base with annual inflation, and Software & Farm Monitoring Systems – the operational infrastructure cost of running a modern, data-driven poultry operation.
Total Operating Expenses calculated as the sum of all three departments, flowing directly into EBITDA on the Income Statement.
🏗 CapEx & Depreciation – Built for Farm Infrastructure
Six capital expenditure categories modeled with hard-coded annual schedules:
• Poultry House Construction – front-loaded in Years 1 and 2
• Equipment & Systems – feeding, watering, and egg collection systems with Year 1 step-up and ongoing maintenance
• Vehicles & Transport – with multi-cycle replacement built across the 10-year horizon
• Refrigeration & Storage Facilities – initial installation and mid-period expansion
• Biosecurity Infrastructure – annual investment scaling with flock size
• Expansion – New Housing – new production capacity in Years 3 through 10, sized to your growth plan
The sheet includes a full asset roll-forward:
• Total CapEx per year – the sum of all six categories
• Cumulative PP&E (Gross) – rolling forward the total fixed asset base
• Annual Depreciation (Straight-Line, ~10-Year Average Life) – applied to the cumulative gross asset base
• Accumulated Depreciation – rolling forward cumulatively each year
• Net PP&E (Book Value) – gross assets minus accumulated depreciation, flowing directly to the Balance Sheet
Depreciation flows automatically into the Income Statement, Cash Flow Statement, and Balance Sheet every year.
💳 Debt & Equity Schedule – Complete Farm Financing Structure
Long-Term Bank Loan – $400K at 6.5% over 7 Years
Beginning balance, annual interest expense, annual principal repayment, and ending balance – tracked every year with automatic payoff at loan maturity in Year 7.
Equipment Loan – $80K at 7.0% over 5 Years
Separate amortization schedule for equipment financing – independently modeled with its own term and rate, fully paid off by Year 5.
Total Interest Expense – combining both debt facilities and flowing automatically into the Income Statement every year.
Total Principal Repaid – the annual combined debt service payment feeding the Cash Flow Statement.
Total Debt Outstanding – the combined ending balance of both facilities, linking directly to the Balance Sheet.
Equity
Initial equity investment of $300K modeled in Year 1, tracked through the financing structure and reconciling on the Balance Sheet.
Model your complete farm financing structure from initial construction draw through full debt payoff – with every debt and equity movement reconciling on the balance sheet automatically.
💵 Fully Integrated 3-Statement Financial Model
This is not a standalone income statement. This is not a cash flow calculator. Every assumption feeds every output – automatically.
Change flock mortality rate – egg production updates. Egg production updates – revenue updates. Revenue updates – COGS updates. COGS updates – gross profit updates. Gross profit flows into EBITDA. EBITDA flows into net income. Net income flows into retained earnings. Retained earnings flows into the balance sheet. The balance sheet balances. Cash reconciles.
Every single time. Automatically.
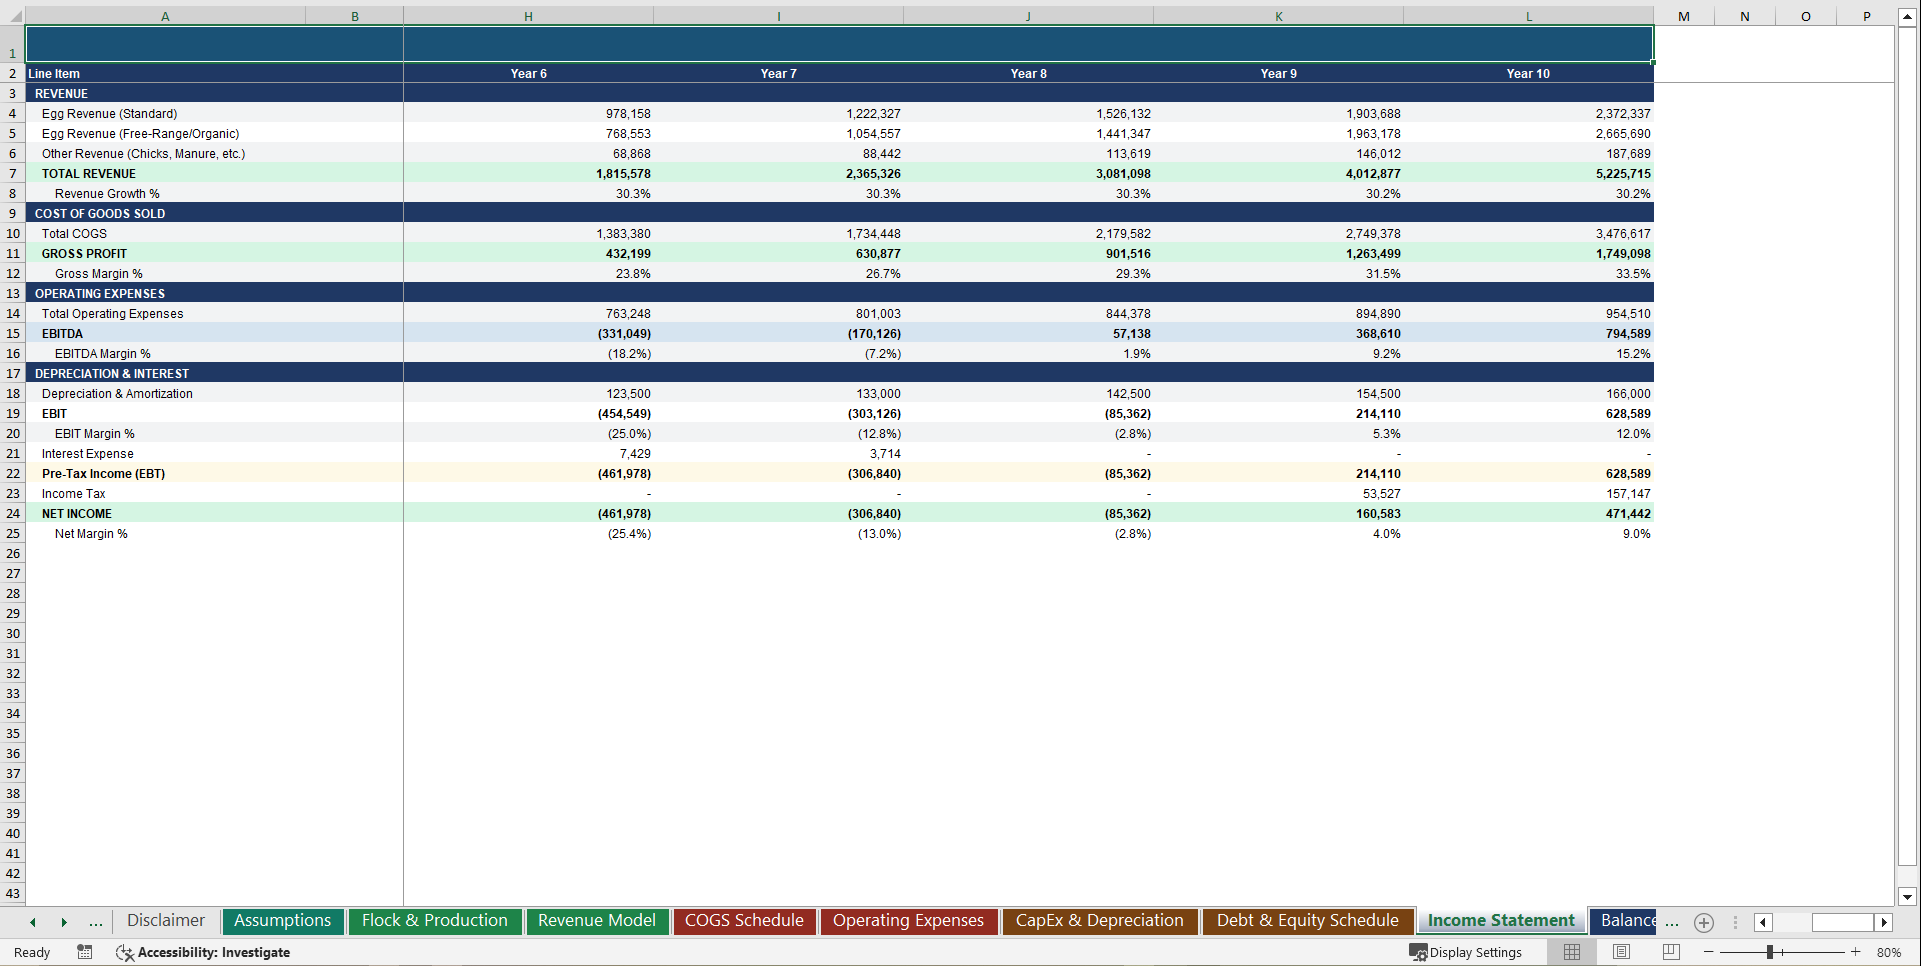
📑 Income Statement – 10-Year P&L
• Egg Revenue (Standard) and Egg Revenue (Free-Range / Organic) – separately broken out
• Other Revenue (Chicks, Manure, By-Products)
• Total Revenue & Revenue Growth %
• Total Cost of Revenue – ten operationally driven lines from the COGS Schedule
• Gross Profit & Gross Margin %
• Total Operating Expenses – from the Operating Expenses schedule
• EBITDA & EBITDA Margin %
• Depreciation & Amortization – from the CapEx & Depreciation Schedule
• EBIT & EBIT Margin %
• Interest Expense – from the Debt & Equity Schedule
• Pre-Tax Income (EBT)
• Income Tax
• Net Income & Net Margin %
💰 Cash Flow Statement – Indirect Method, Fully Linked
Operating Activities
Net Income → Add: Depreciation & Amortization → Change in Accounts Receivable → Change in Inventory → Change in Accounts Payable → Change in Accrued Expenses → Net Cash from Operations
Investing Activities
Capital Expenditures → Net Cash from Investing
Financing Activities
Equity Raised → Loans Received → Debt Repayment (Principal) → Net Cash from Financing
Cash Balance
Net Change in Cash → Beginning Cash Balance → Minimum Cash Policy Floor → Cash Before Minimum → Ending Cash Balance – linked directly to the Balance Sheet
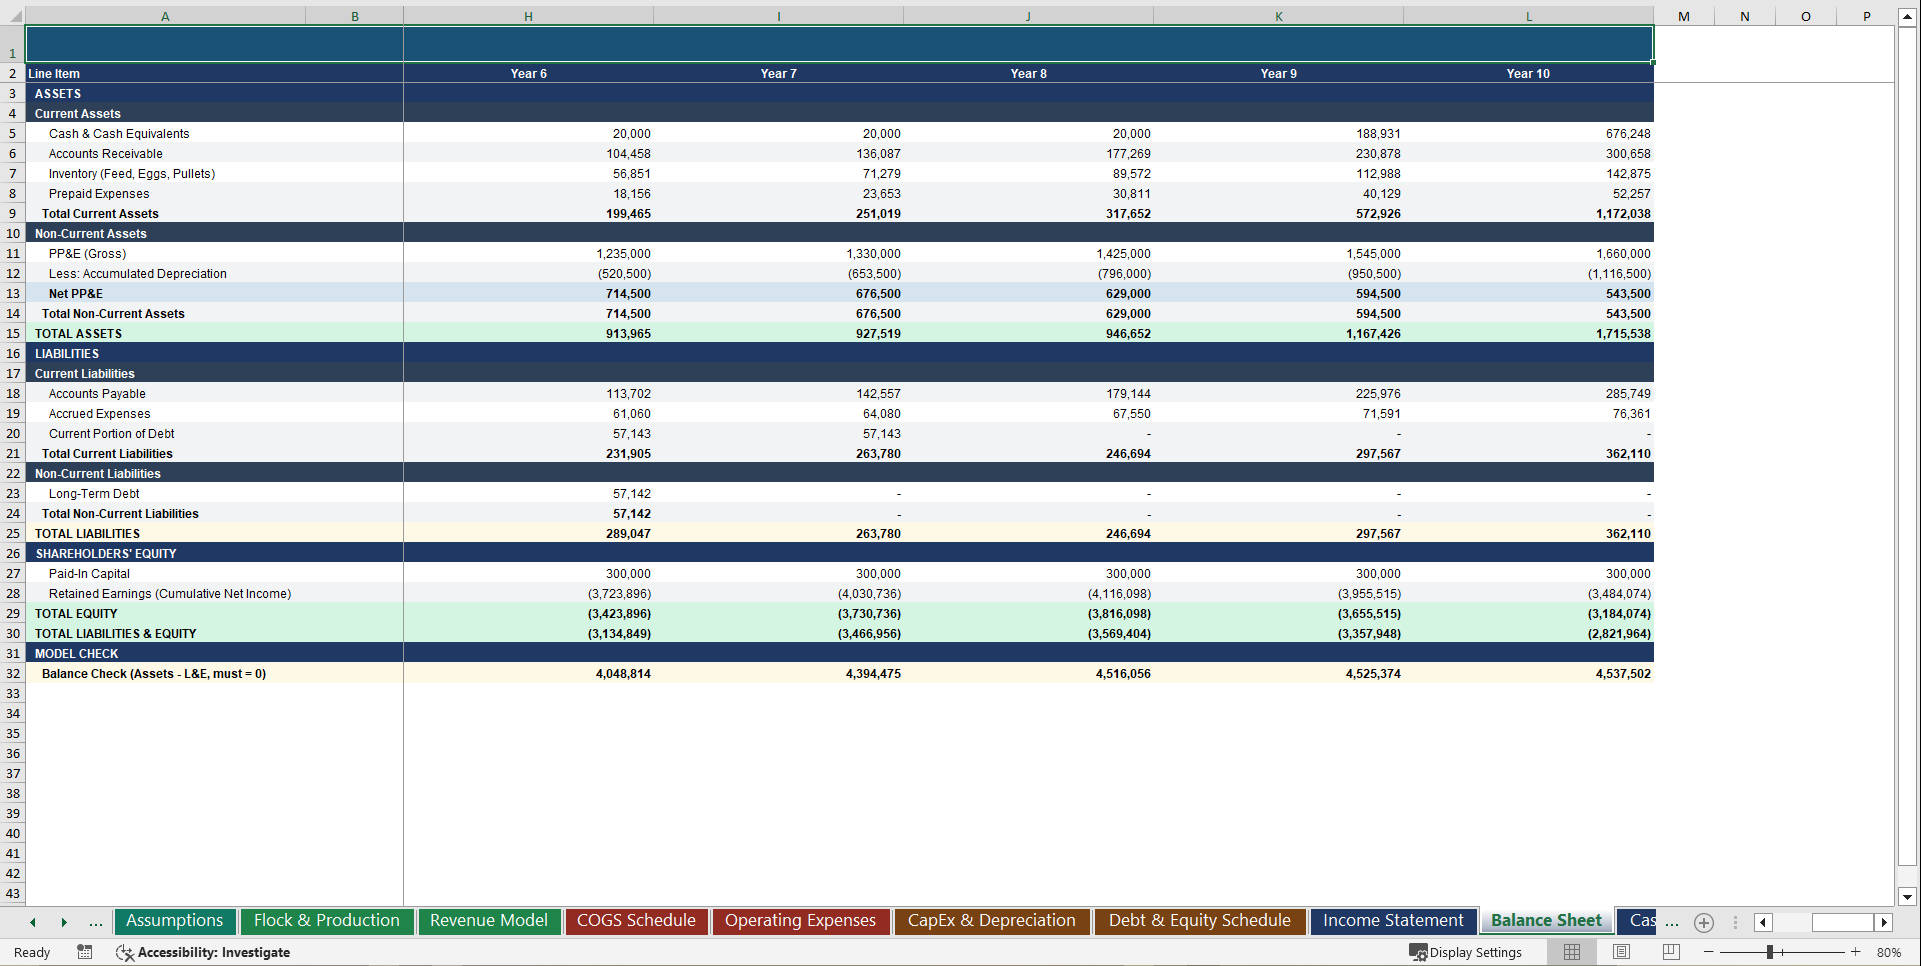
🧾 Balance Sheet – Fully Reconciled Across Every Year
Assets
• Cash & Cash Equivalents – linked directly from Ending Cash Balance on the Cash Flow Statement
• Accounts Receivable – DSO-driven
• Inventory (Feed, Eggs, Pullets) – inventory days-driven
• Prepaid Expenses
• Total Current Assets
• PP&E Gross
• Less: Accumulated Depreciation
• Net PP&E
• Total Non-Current Assets
• Total Assets
Liabilities
• Accounts Payable – DPO-driven
• Accrued Expenses
• Current Portion of Debt
• Total Current Liabilities
• Long-Term Debt
• Total Non-Current Liabilities
• Total Liabilities
Shareholders' Equity
• Paid-In Capital
• Retained Earnings (Cumulative Net Income)
• Total Equity
• Total Liabilities & Equity
Balance Check (Assets − L&E, must = 0) – a live reconciliation row that flags immediately if the model is out of balance. Across every single year of the forecast.
🔬 Sensitivity & Scenario Analysis – Know Your Downside Before Your Lender Does
A dedicated Sensitivity Analysis sheet models five distinct business scenarios across nine Year 5 key metrics:
• Base Case – your core operating plan
• High Production Case – optimized flock management, lower mortality, accelerated premium mix
• Disease Impact Case – elevated mortality, suppressed production, regulatory intervention
• Price Shock Case – commodity egg price compression
• Regulatory Cost Spike Case – compliance and biosecurity cost escalation
Metrics compared across all five scenarios: Flock Size, Blended Egg Price, Mortality Rate, Total Revenue, Gross Margin, EBITDA, Net Income, Cash Balance, and Break-Even Year.
EBITDA Sensitivity Matrix – egg price from $0.09 to $0.17 per egg across six flock sizes from 15,000 to 40,000 hens – 36 combination cells, fully color-coded from deep loss (red) through marginal positive (gold) to strong profitability (green). Know exactly where your farm breaks even at every combination of price and scale before any lender asks.
📈 Supporting Schedules – The Unit Economics Agri-Investors Actually Evaluate
A dedicated Supporting Schedules tab organizes every metric agricultural investors and lenders want to see, across three sections:
Working Capital
• Accounts Receivable
• Inventory
• Accounts Payable
• Net Working Capital – the net liquidity position of the operation
Unit Economics
• Revenue per Hen ($)
• COGS per Hen ($)
• Feed Cost per Egg ($)
• Labor Cost per Egg ($)
• EBITDA per Hen ($)
Financial Ratios
• Gross Margin %
• EBITDA Margin %
• Net Margin %
• Current Ratio
• Debt / EBITDA
• Return on Assets (ROA)
• Return on Equity (ROE)
All metrics calculated automatically across all 10 years and linked live from the model.
📊 Executive Dashboard – Investor-Ready in One Sheet
10 Year 10 headline KPIs pulled live from the model – two rows of five:
Row 1:
• Total Revenue (Year 10)
• Gross Margin % (Year 10)
• EBITDA (Year 10)
• Net Income (Year 10)
• Cash Balance (Year 10)
Row 2:
• Flock Size (Year 10)
• Eggs per Hen per Day (Year 10)
• Mortality Rate
• Feed Cost per Egg (Year 10)
• ROIC (Year 10)
6 fully working dynamic charts – all linked live to a dedicated chart data table that pulls from every model sheet:
1. Total Revenue Growth – 10-year clustered column chart
2. EBITDA Trend – 10-year clustered column chart
3. Net Income Trend – 10-year clustered column chart showing the profitability inflection
4. Cash Balance / Runway – 10-year column chart showing the cash build from minimum policy floor to full accumulation
5. Flock Size & Growth – 10-year line chart showing operational scale across the forecast
6. P&L Summary – Revenue, Gross Profit & EBITDA – triple-line chart showing the full profitability story across all 10 years
All six charts update automatically when any assumption changes. All are powered by a dedicated embedded chart data table in the Dashboard sheet – linked live to the Revenue Model, Income Statement, Cash Flow Statement, Flock & Production, COGS Schedule, Operating Expenses, CapEx & Depreciation, and Debt & Equity Schedule simultaneously.
⚙️ Clean, Professional Assumption Structure – Everything in One Place
All model inputs centralized in the Assumptions sheet, organized into nine clearly labeled sections:
A. General Settings – Forecast Start Year, Tax Rate, Inflation Rate, Discount Rate (WACC)
B. Flock & Production – Starting Hen Inventory, Annual Flock Growth Rate, Avg Eggs per Hen per Day, Annual Mortality Rate, Flock Replacement Rate, Laying Onset, Productive Life, and four quarterly seasonal production factors
C. Revenue & Pricing – Standard and Free-Range egg prices, starting production mix percentages, annual mix-shift rate toward free-range, annual egg price escalation, day-old chick price and starting volume, chick sales growth rate, manure/fertilizer and by-product per-hen revenue rates
D. Cost of Goods Sold – Feed cost per hen and feed cost inflation, vet and vaccination cost per hen, packaging and transport per egg, utilities per hen, bedding and litter per hen, equipment maintenance as a percentage of CapEx, biosecurity and compliance per hen, insurance as a percentage of revenue
E. Personnel – Salaries for four roles (Farm Manager, Supervisor, Production Worker, Admin/Sales), starting headcount for each role, annual headcount growth rate, annual salary raise, payroll tax rate, benefits as a percentage of salary
F. Operating Expenses – Sales & Marketing as a percentage of revenue, G&A Fixed Base with its own inflation rate, Software and Farm Monitoring Systems annual cost
G. CapEx & Depreciation – Poultry House CapEx for Years 1–2, Equipment CapEx, Vehicles CapEx, Expansion CapEx for Years 3–5 and Years 6–10 separately, and useful lives for Buildings (25 years), Equipment (8 years), and Vehicles (5 years)
H. Debt & Financing – Initial Long-Term Loan ($400K at 6.5% over 7 years), Equipment Loan ($80K at 7.0% over 5 years), and Initial Equity Investment ($300K)
I. Working Capital – Accounts Receivable Days, Accounts Payable Days, Inventory Days
One assumption change. Entire model updates.
🎯 Who This Layer Farm Financial Model Is Built For
✔ Layer farm owners and operators building credible 10-year financial plans for lenders and investors
✔ Agricultural CFOs and farm finance managers at commercial egg production operations
✔ Rural and agricultural lenders stress-testing farm loan serviceability and debt coverage ratios
✔ Agribusiness private equity and growth equity investors evaluating poultry operations for acquisition or investment
✔ Agricultural development banks and government lending programs assessing farm financial viability
✔ Farm management consultants and agri-business advisors preparing financial models for farm clients
✔ Poultry industry strategic acquirers evaluating egg production businesses as acquisition targets
✔ Agricultural economics students and analysts learning institutional-grade farm financial modeling
✔ Family offices and rural investors evaluating direct agricultural asset investments
If your operation houses laying hens, produces eggs, and needs to demonstrate financial credibility to the people writing the checks – this model was built for you.
The Complete Layer Farm Financial Forecasting System
This model connects:
🐓 Flock inventory operations – beginning and ending hen counts, mortality roll-forwards, pullet replacement cycles, and annual expansion
🥚 Egg revenue – standard and free-range/organic tier volumes with automatic mix-shift and annual price escalation
🌾 By-product revenue – day-old chicks, manure, fertilizer, feathers, and culled hen streams
🌽 Feed and production costs – ten operationally driven COGS lines with feed price inflation and production volume scaling
👷 Farm labor and management – four-role personnel model with role-level salaries, headcount plans, raises, taxes, and benefits
🏗 Six-category CapEx schedule and straight-line depreciation – construction, equipment, vehicles, refrigeration, biosecurity, and expansion
💼 Working capital dynamics – receivables, payables, and inventory cycles all DSO/DPO/days-driven
💳 Two-facility debt structure – bank loan and equipment loan each with independent amortization schedules
…into a single integrated 10-year financial forecasting system that updates automatically when any assumption changes.
Everything flows into:
📊 Clear, institutional-grade agricultural financial projections
📈 Operational KPIs and egg production unit economics
💰 Fully integrated Income Statement, Cash Flow Statement, and Balance Sheet
✅ Operationally driven from real flock metrics – not arbitrary revenue growth percentages
✅ Five-scenario sensitivity analysis and a 36-cell EBITDA sensitivity matrix included
✅ Executive dashboard with 10 live KPIs and 6 dynamic charts ready to present
✅ Fully linked 3-statement model – every number traces back to a single assumption
✅ Live balance check built in – reconciles assets to liabilities and equity every year
✅ Institutional-grade color coding throughout – blue inputs, black formulas, green cross-sheet links
This is the layer farm financial model serious agricultural operators and investors actually use.
Key Words:
Strategy & Transformation, Growth Strategy, Strategic Planning, Strategy Frameworks, Innovation Management, Pricing Strategy, Core Competencies, Strategy Development, Business Transformation, Marketing Plan Development, Product Strategy, Breakout Strategy, Competitive Advantage, Mission, Vision, Values, Strategy Deployment & Execution, Innovation, Vision Statement, Core Competencies Analysis, Corporate Strategy, Product Launch Strategy, BMI, Blue Ocean Strategy, Breakthrough Strategy, Business Model Innovation, Business Strategy Example, Corporate Transformation, Critical Success Factors, Customer Segmentation, Customer Value Proposition, Distinctive Capabilities, Enterprise Performance Management, KPI, Key Performance Indicators, Market Analysis, Market Entry Example, Market Entry Plan, Market Intelligence, Market Research, Market Segmentation, Market Sizing, Marketing, Michael Porter's Value Chain, Organizational Transformation, Performance Management, Performance Measurement, Platform Strategy, Product Go-to-Market Strategy, Reorganization, Restructuring, SWOT, SWOT Analysis, Service 4.0, Service Strategy, Service Transformation, Strategic Analysis, Strategic Plan Example, Strategy Deployment, Strategy Execution, Strategy Frameworks Compilation, Strategy Methodologies, Strategy Report Example, Value Chain, Value Chain Analysis, Value Innovation, Value Proposition, Vision Statement, Corporate Strategy, Business Development, Business plan pdf, business plan, PDF, Business Plan DOC, Business Plan Template, PPT, Market strategy playbook, strategic market planning, competitive analysis tools, market segmentation frameworks, growth strategy templates, product positioning strategy, market execution toolkit, strategic alignment playbook, KPI and OKR frameworks, business growth strategy guide, cross-functional strategy templates, market risk management, market strategy PowerPoint doc, guide, ebook, e-book ,McKinsey Change Playbook, Organizational change management toolkit, Change management frameworks 2025, Influence model for change, Change leadership strategies, Behavioral change in organizations, Change management PowerPoint templates, Transformational leadership in change, supply chain KPIs, supply chain KPI toolkit, supply chain PowerPoint template, logistics KPIs, procurement KPIs, inventory management KPIs, supply chain performance metrics, manufacturing KPIs, supply chain dashboard, supply chain strategy KPIs, reverse logistics KPIs, sustainability KPIs in supply chain, financial supply chain KPIs, warehouse KPIs, digital supply chain KPIs, 1200 KPIs, supply chain scorecard, KPI examples, supply chain templates, Corporate Finance SOPs, Finance SOP Excel Template, CFO Toolkit, Finance Department Procedures, Financial Planning SOPs, Treasury SOPs, Accounts Payable SOPs, Accounts Receivable SOPs, General Ledger SOPs, Accounting Policies Template, Internal Controls SOPs, Finance Process Standardization, Finance Operating Procedures, Finance Department Excel Template, FP&A Process Documentation, Corporate Finance Template, Finance SOP Toolkit, CFO Process Templates, Accounting SOP Package, Tax Compliance SOPs, Financial Risk Management Procedures.
NOTE: Our digital products are sold on an "as is" basis, making returns and refunds unavailable post-download. Please preview and inquire before purchasing. Please contact us before purchasing if you have any questions! This policy aligns with the standard Flevy Terms of Usage.
Got a question about the product? Email us at support@flevy.com or ask the author directly by using the "Ask the Author a Question" form. If you cannot view the preview above this document description, go here to view the large preview instead.
Source: Best Practices in Poultry Farming, Integrated Financial Model Excel: Layer Poultry Farm 10-Year 3 Statement Financial Model Excel (XLSX) Spreadsheet, SB Consulting
ABOUT THE AUTHOR
SB Consulting is dedicated to empowering businesses to communicate their ideas with impact. This consulting firm specializes in teaching organizations how to create effective corporate and management presentations. With training from top-tier global consulting firms, including McKinsey, BCG, and Porsche Consulting, extensive expertise in presentation design and ... [read more]
Ask the Author a Question
You must be logged in to contact the author.
