
Broiler Poultry Financial Model – Excel XLSX
Excel (XLSX)
BENEFITS OF THIS DOWNLOADABLE EXCEL DOCUMENT
- A 10-year financial model for Broiler Farm, with monthly 3-statement projections, key metrics, DCF valuation, and visual charts for performance analysis.
POULTRY FARMING EXCEL DESCRIPTION
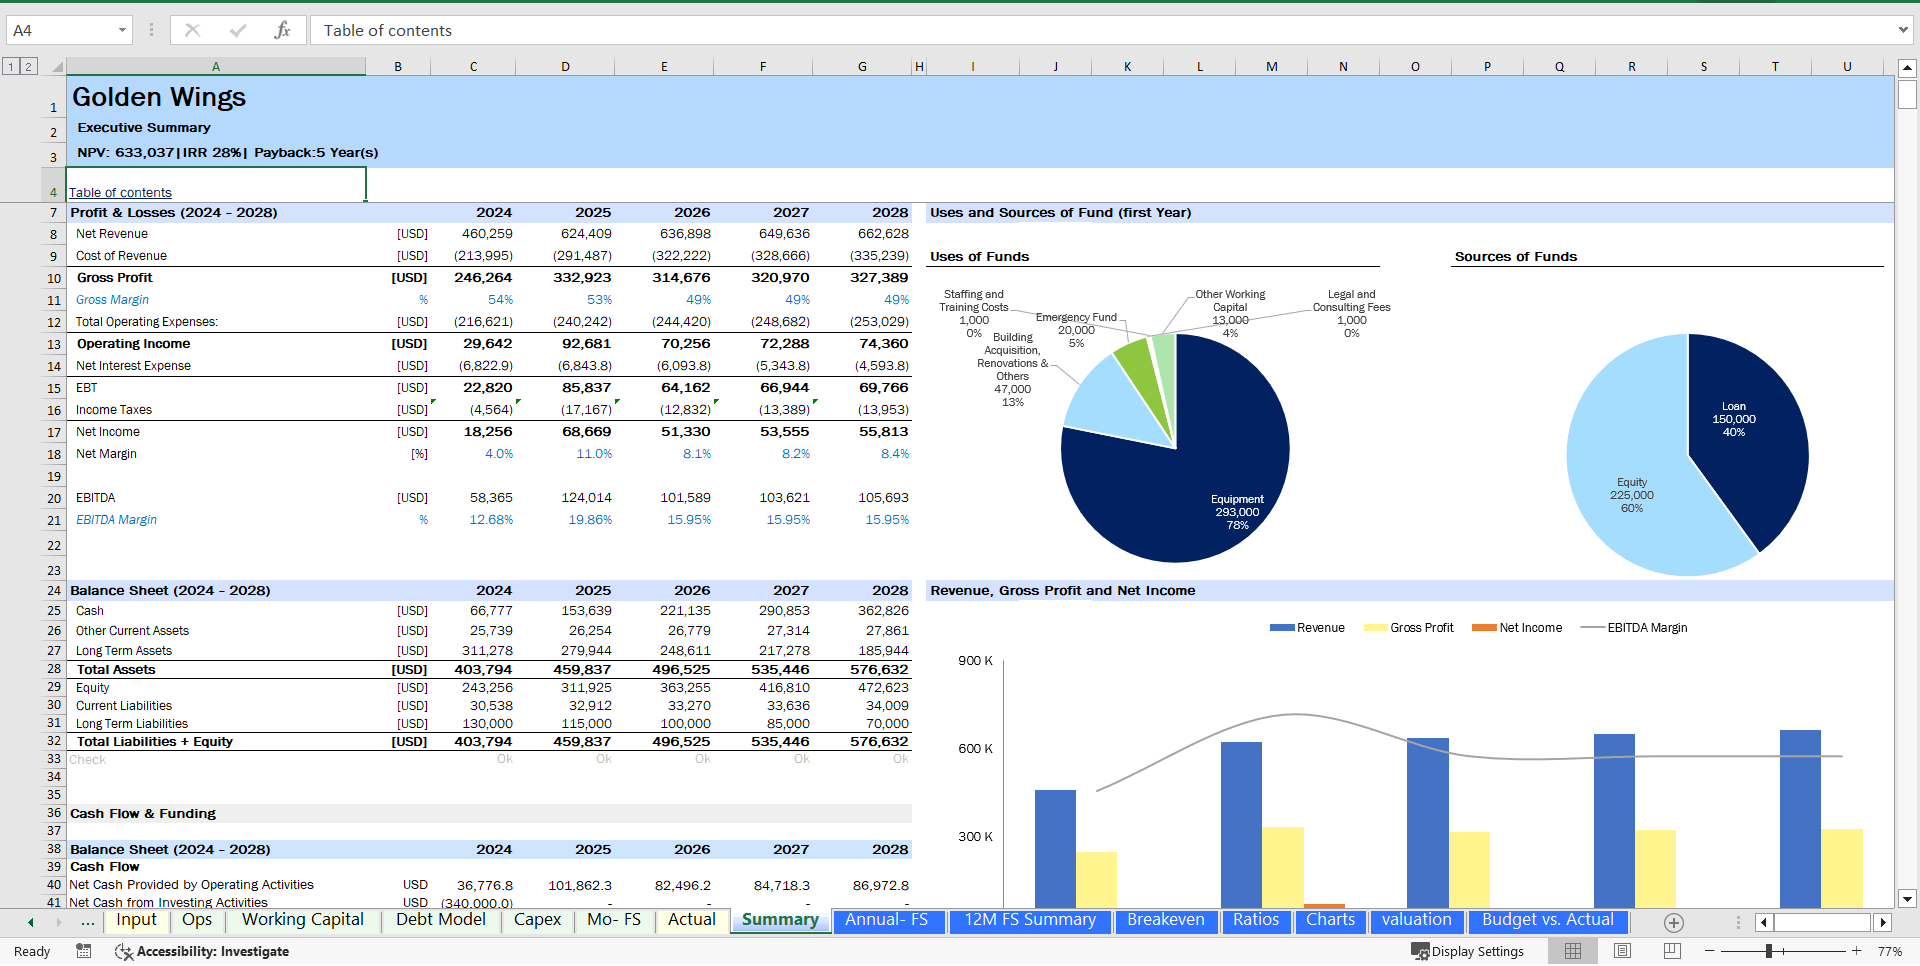
This Excel model is a highly adaptable and user-friendly tool for creating a 10-year rolling 3-statement financial projection (Income Statement, Balance Sheet, and Cash Flow Statement) with a monthly timeline. It is designed specifically for a startup or existing broiler poultry farm business, focusing on revenue generation through broiler meat sales and potentially other related services such as manure and feather sales.
The model allows users to input various revenue streams, variable costs associated with broiler production, operational costs, fixed assets, and financing activities. Following best practices in financial modeling includes clear instructions, detailed line item explanations, checks, and input validations. Additionally, the model features a discounted cash flow (DCF) valuation calculation based on projected cash flows.
The model includes a dedicated sheet for entering historical data, enabling users to directly monitor actual performance against forecasted figures. It also incorporates a comprehensive array of charts to represent key business metrics and indicators visually.
Key Outputs
The key outputs of the model include:
• Detailed monthly financial statements spanning ten years, with annual summaries.
• The valuation sheet is based on discounted cash flow projections.
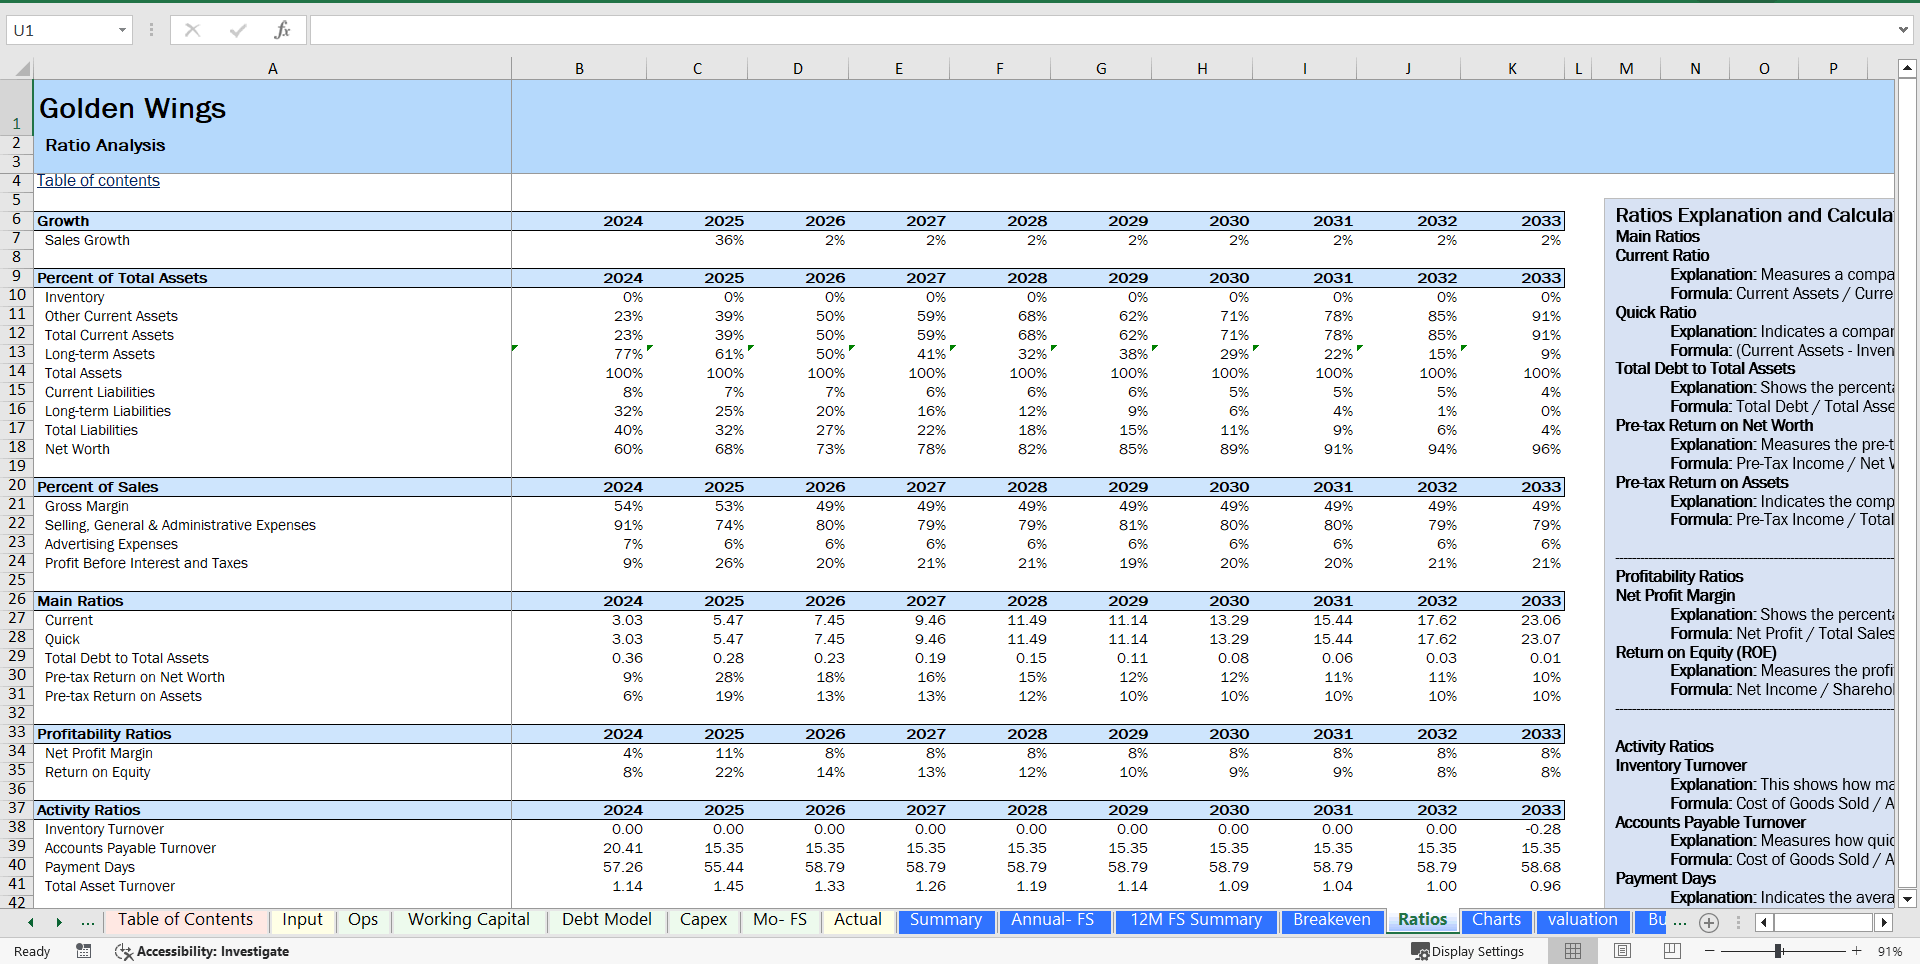
• Over 30 financial and business ratios for in-depth performance analysis.
• Charts illustrating financial projections and key performance metrics.
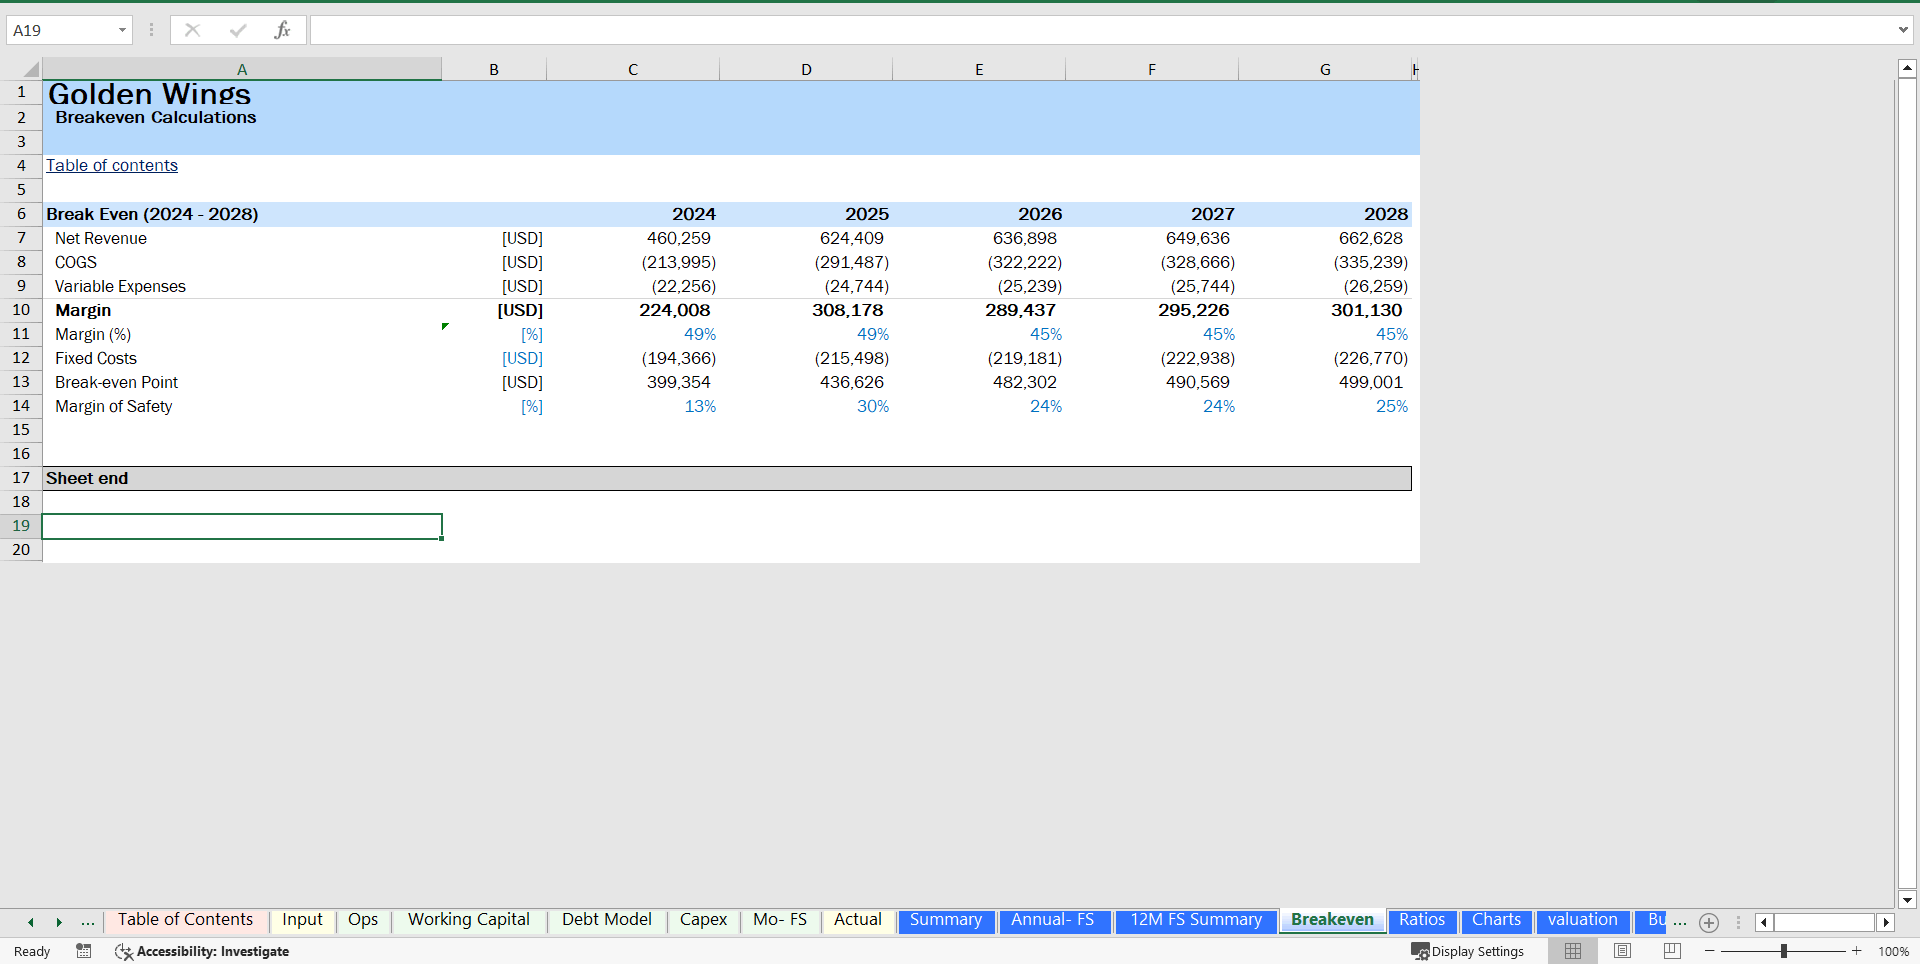
• Breakeven analysis to determine the sales volume required to cover costs.
• Dashboard summarizing projected financial statements, key ratios, and financial performance metrics.
• Evolution of cash balance over time.
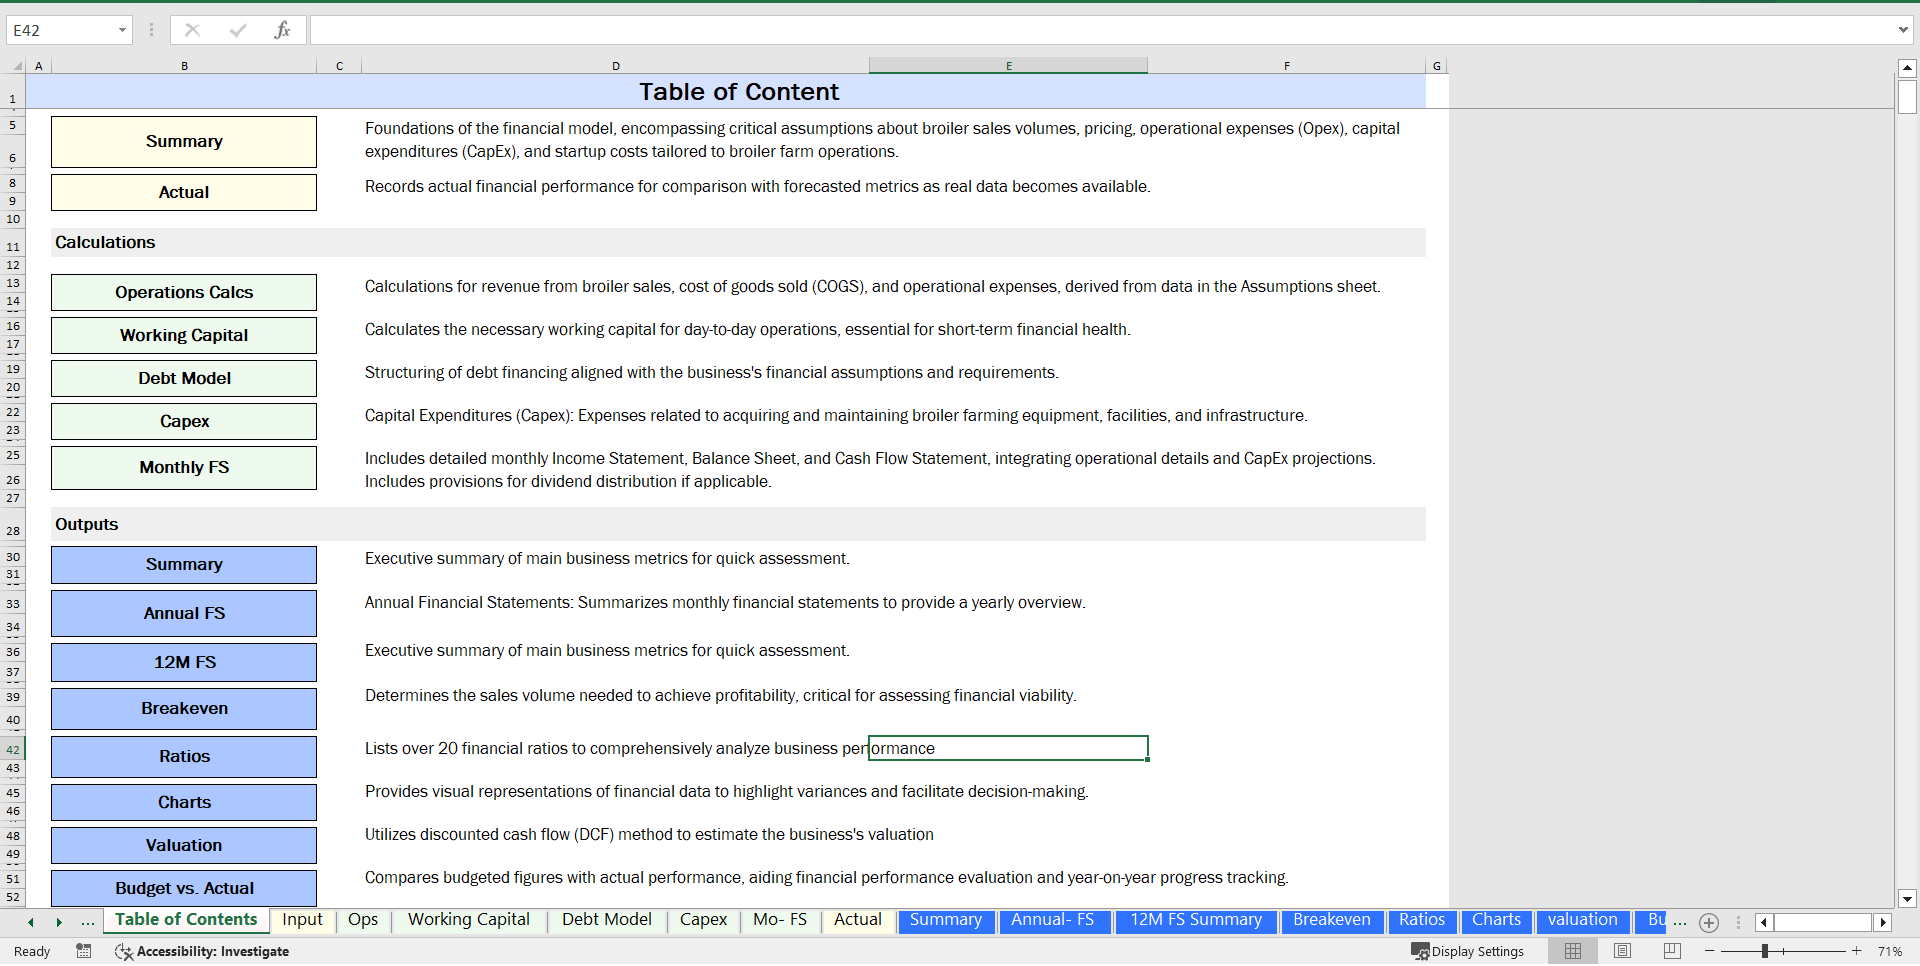
Model Structure
The model is structured into several sections:
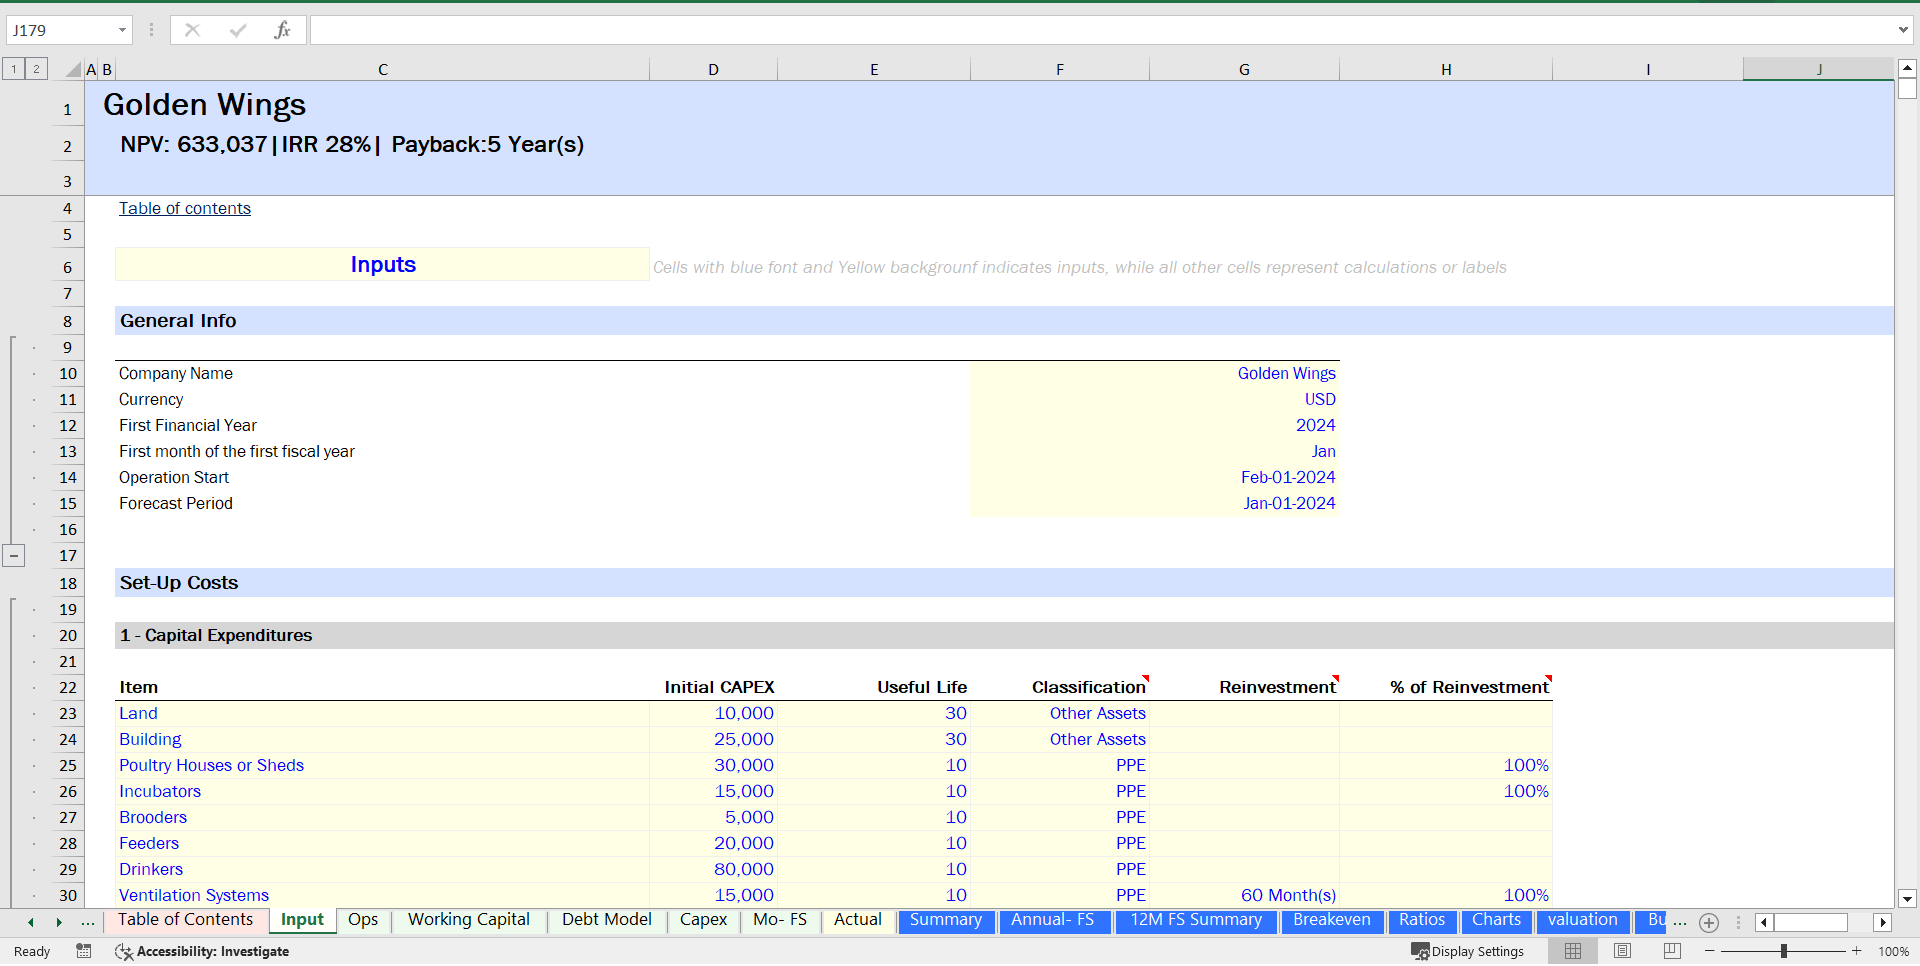
• Assumptions: Foundations of the financial model, encompassing critical assumptions about broiler sales volumes, pricing, operational expenses (Opex), capital expenditures (CapEx), and startup costs tailored to broiler farm operations.
• Operations: Calculations for revenue from broiler sales, cost of goods sold (COGS), and operational expenses derived from data in the Assumptions sheet.
• Working Capital: Calculates the necessary working capital for day-to-day operations, essential for short-term financial health.
-Debt Model: Structuring of debt financing aligned with the business's financial assumptions and requirements.
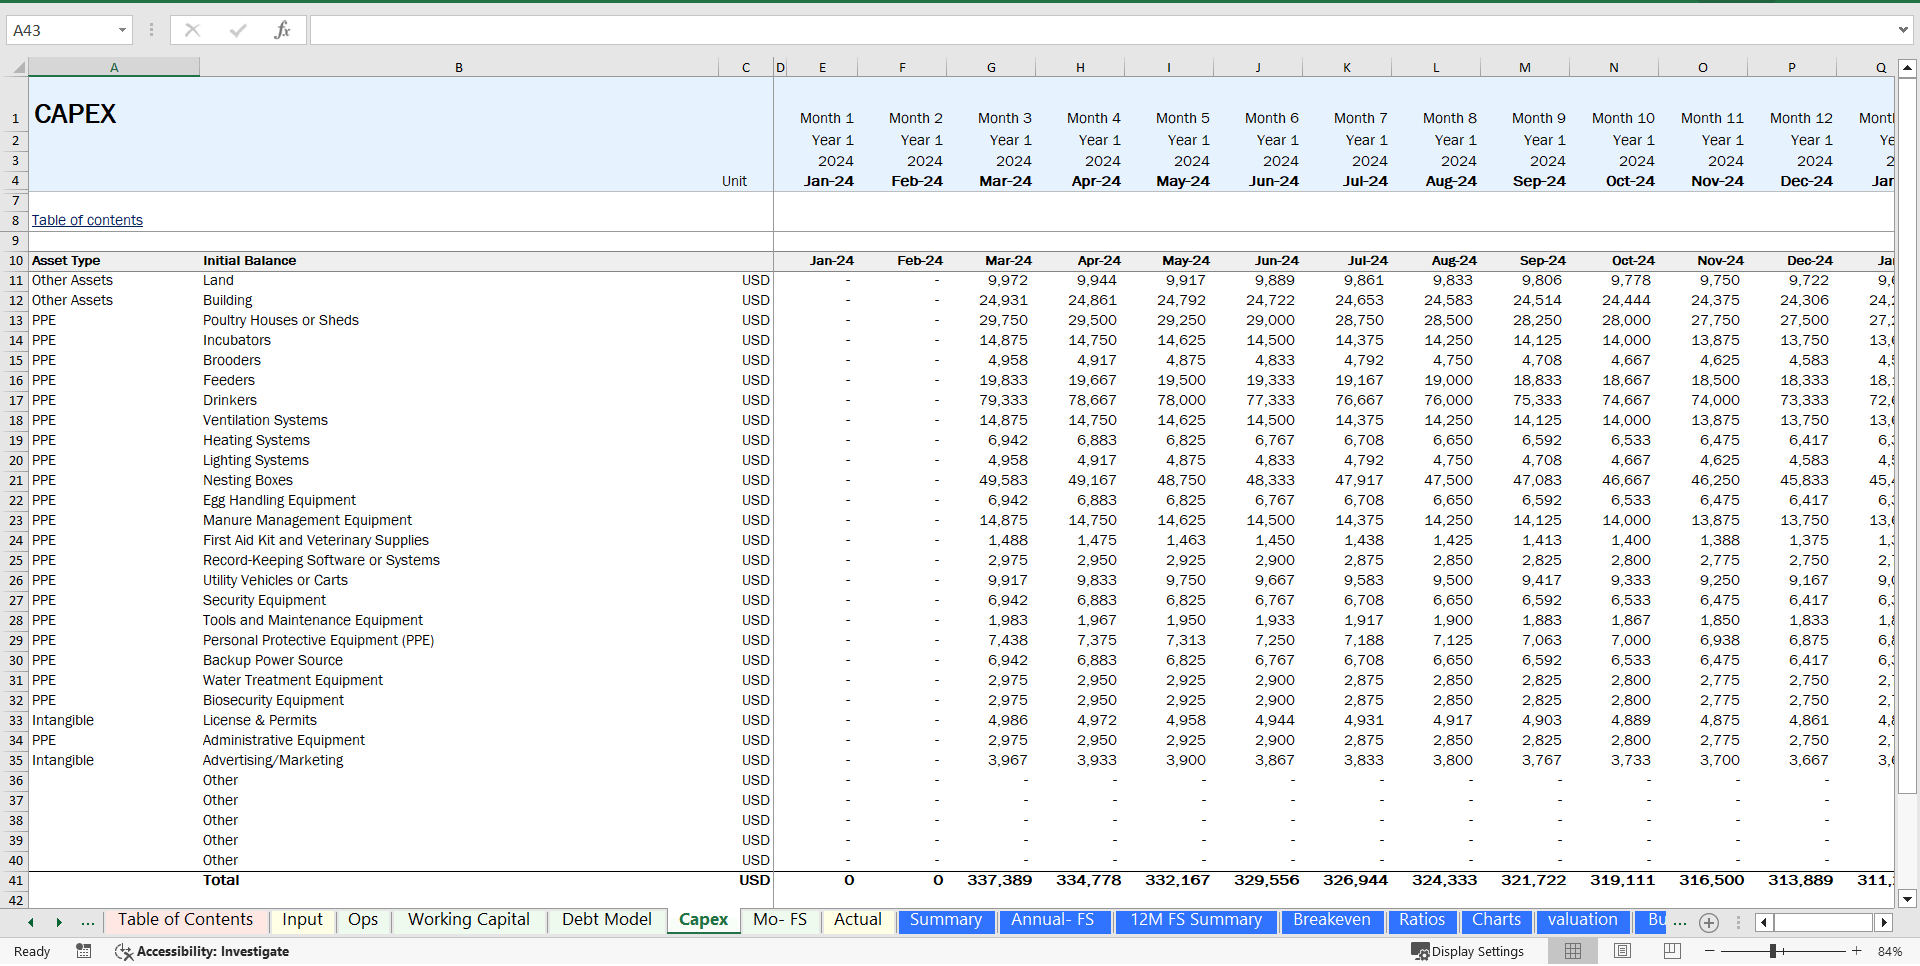
-Capital Expenditures (Capex): Expenses related to acquiring and maintaining broiler farming equipment, facilities, and infrastructure.
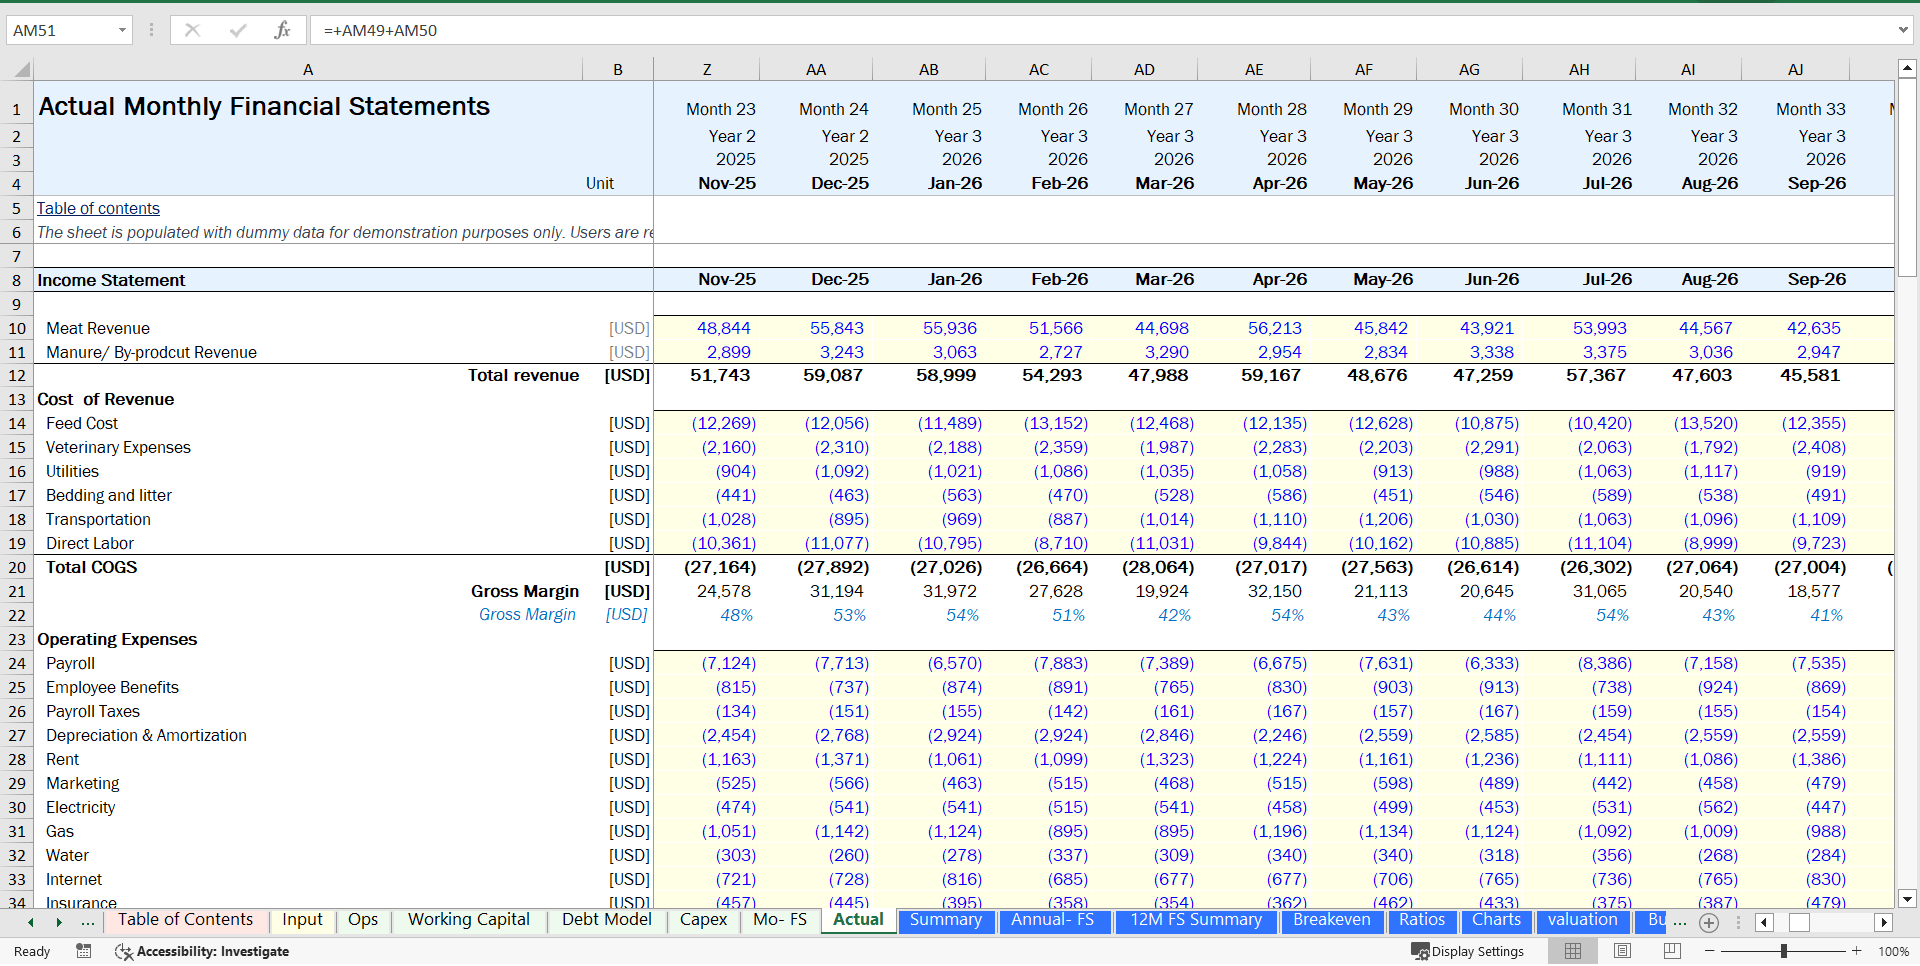
-Monthly Financial Statements (Mo-FS): Includes detailed monthly Income Statement, Balance Sheet, and Cash Flow Statement, integrating operational details and CapEx projections. Includes provisions for dividend distribution if applicable.
-Actual Performance: Records actual financial performance for comparison with forecasted metrics as real data becomes available.
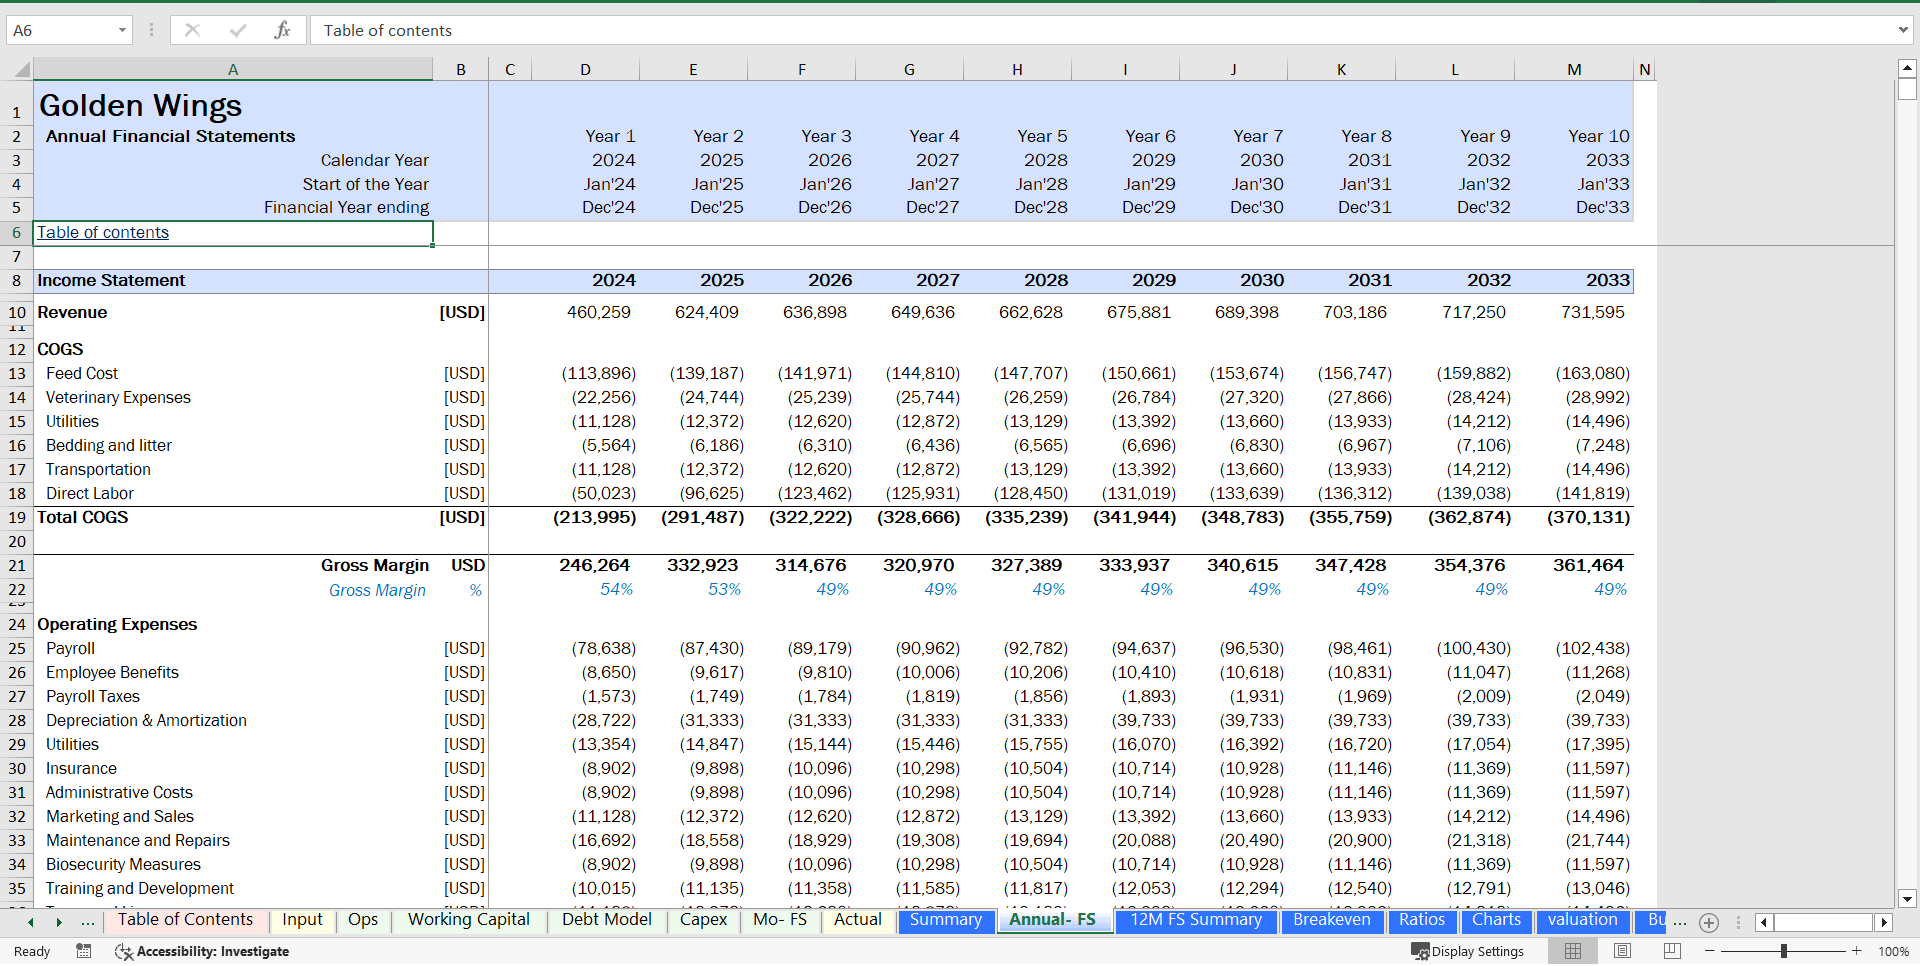
-Annual Financial Statements: Summarizes monthly financial statements to provide a yearly overview.
-Summary: Executive summary of main business metrics for quick assessment.
-Breakeven Analysis: Determining the sales volume needed to achieve profitability is critical for assessing financial viability.
-Ratios: Lists over 20 financial ratios to comprehensively analyze business performance.
-Valuation: Utilizes discounted cash flow (DCF) method to estimate the business's valuation.
-Budget vs. Actual: Compares budgeted figures with actual performance, aiding financial performance evaluation and year-on-year progress tracking.
-Charts: Provides visual representations of financial data to highlight variances and facilitate decision-making.
This structured approach ensures the model comprehensively addresses the financial planning and analysis needs of broiler poultry farming, supporting strategic decision-making and financial management.
Got a question about the product? Email us at support@flevy.com or ask the author directly by using the "Ask the Author a Question" form. If you cannot view the preview above this document description, go here to view the large preview instead.
Source: Best Practices in Poultry Farming, Integrated Financial Model Excel: Broiler Poultry Financial Model Excel (XLSX) Spreadsheet, Jair Almeida
