
Investment Return Monte Carlo Simulation Excel Model Template – Excel XLSX
Excel (XLSX)
BENEFITS OF THIS DOWNLOADABLE EXCEL DOCUMENT
- Project investment retun and balance using Monte Carlo Simulation.
MONTE CARLO EXCEL DESCRIPTION
Investment Return Monte Carlo Simulation is vital for investors. It employs statistical modeling to simulate various market scenarios, providing a range of potential investment outcomes. This helps investors assess and manage risk more effectively, make informed portfolio decisions, and set realistic expectations. By considering diverse market conditions, it enhances strategic asset allocation and safeguards investments against unexpected market fluctuations. Ultimately, Monte Carlo Simulation is a valuable tool for optimizing investment strategies, improving risk management, and achieving long-term financial goals in an uncertain financial landscape.
PURPOSE OF TOOL
User-friendly Excel tool to calculate the expected value and return for an investment using Monte Carlo simulation analysis. The tool allows the user to specify the investment period and additions or redemptions over the investment period. The return and balance is calculated on a ‘real' basis after removing the impact of inflation for a better measure of investment performance.
The model follows best practice financial modelling principles and includes instructions, line item explanations, checks and input validations
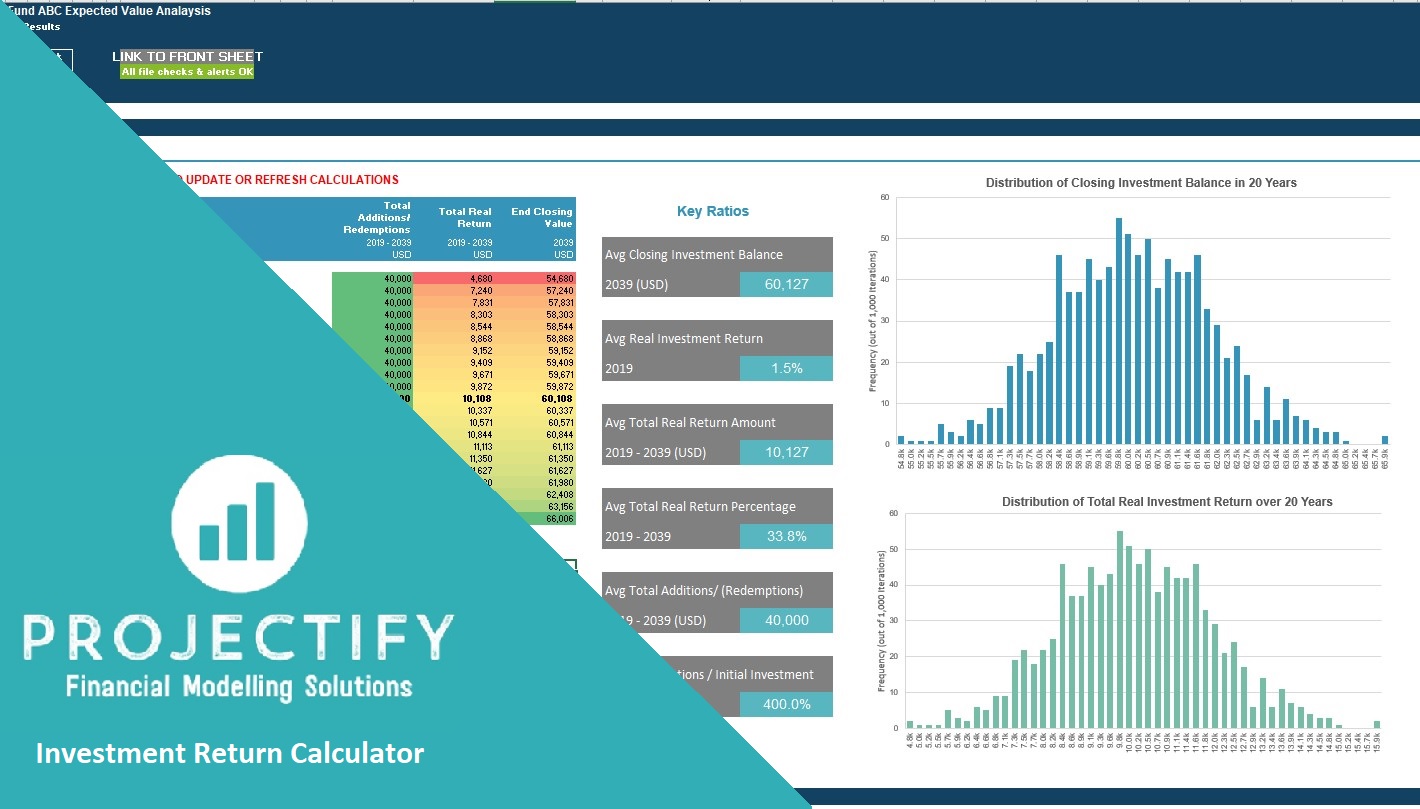
KEY OUTPUTS
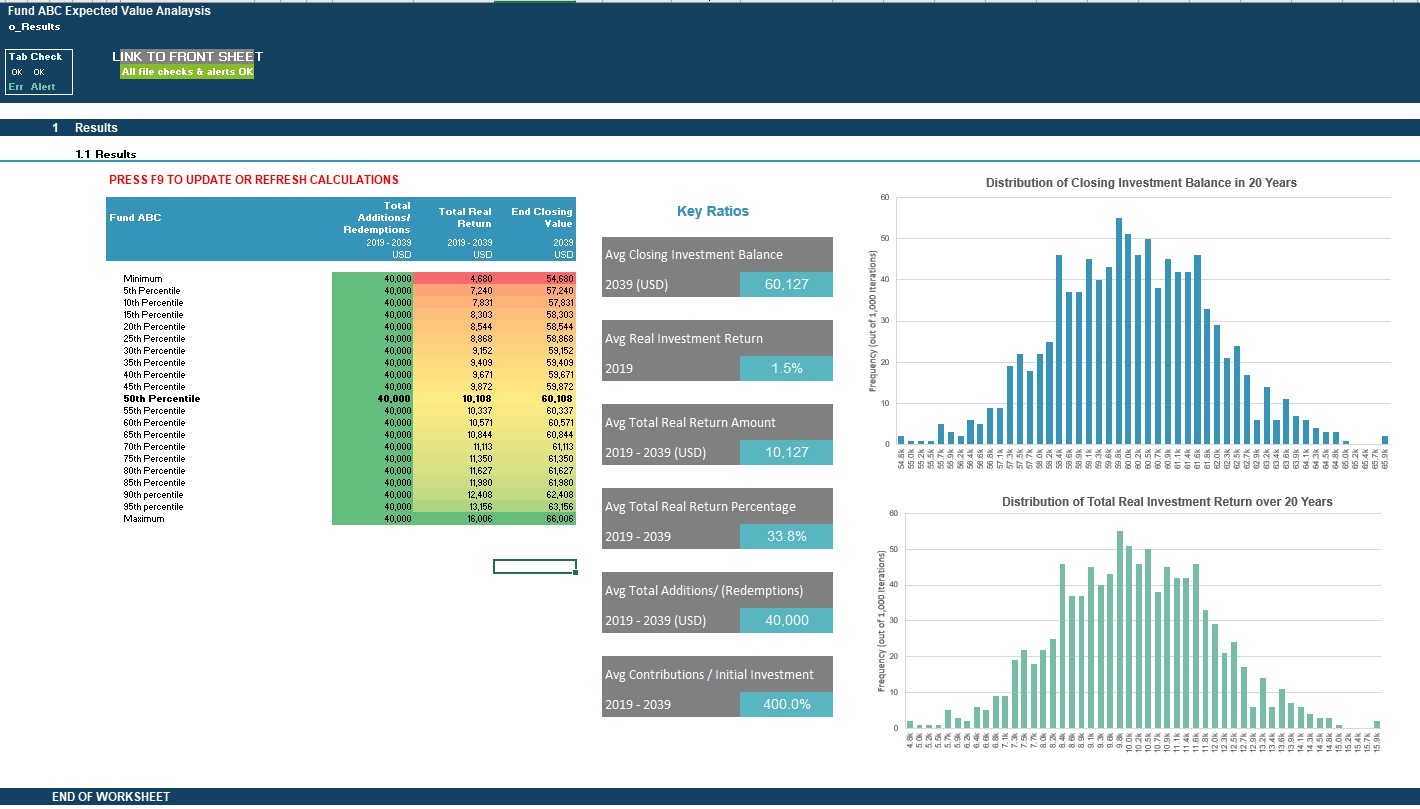
The key outputs include:
• Distribution chart of investment balances at end of investment period;
• Distribution chart of the total investment return over the investment period;
• Key results/ratios including average investment balance, average investment return, average total additions/redemptions;
• Table showing total investment balance, investment return and additions/redemptions across percentiles in intervals of 5%.
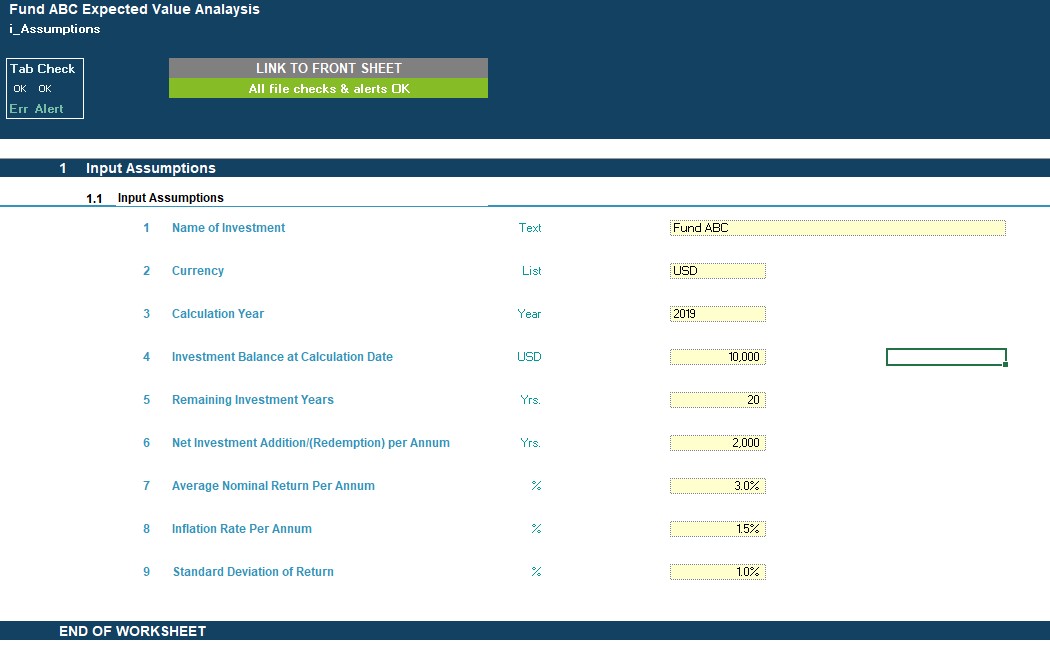
KEY INPUTS
The key inputs include
• Investment Name
• Currency
• Calculation Year
• Balance at Start
• Investment period in years
• Additions/redemptions per annum
• Average return per annum
• Inflation rate
• Standard deviation of return
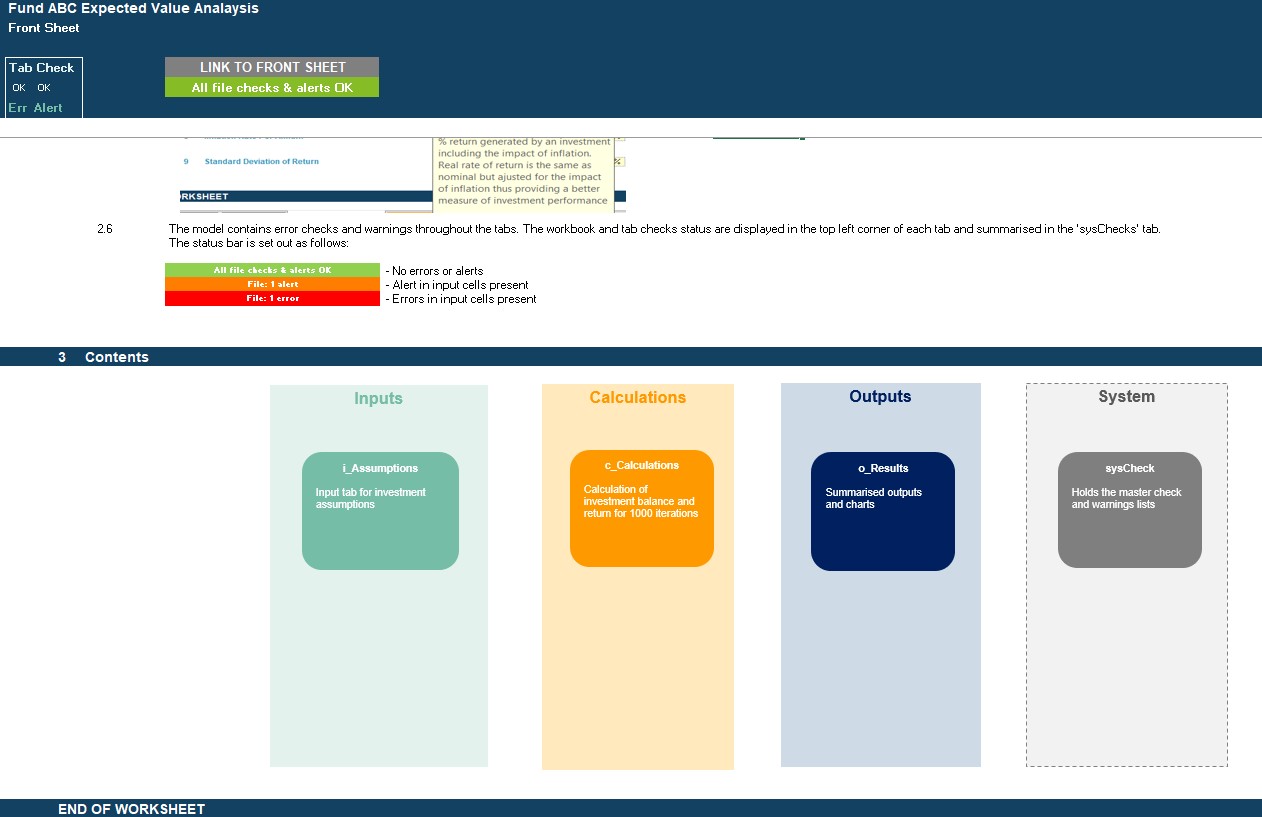
TOOL STRUCTURE
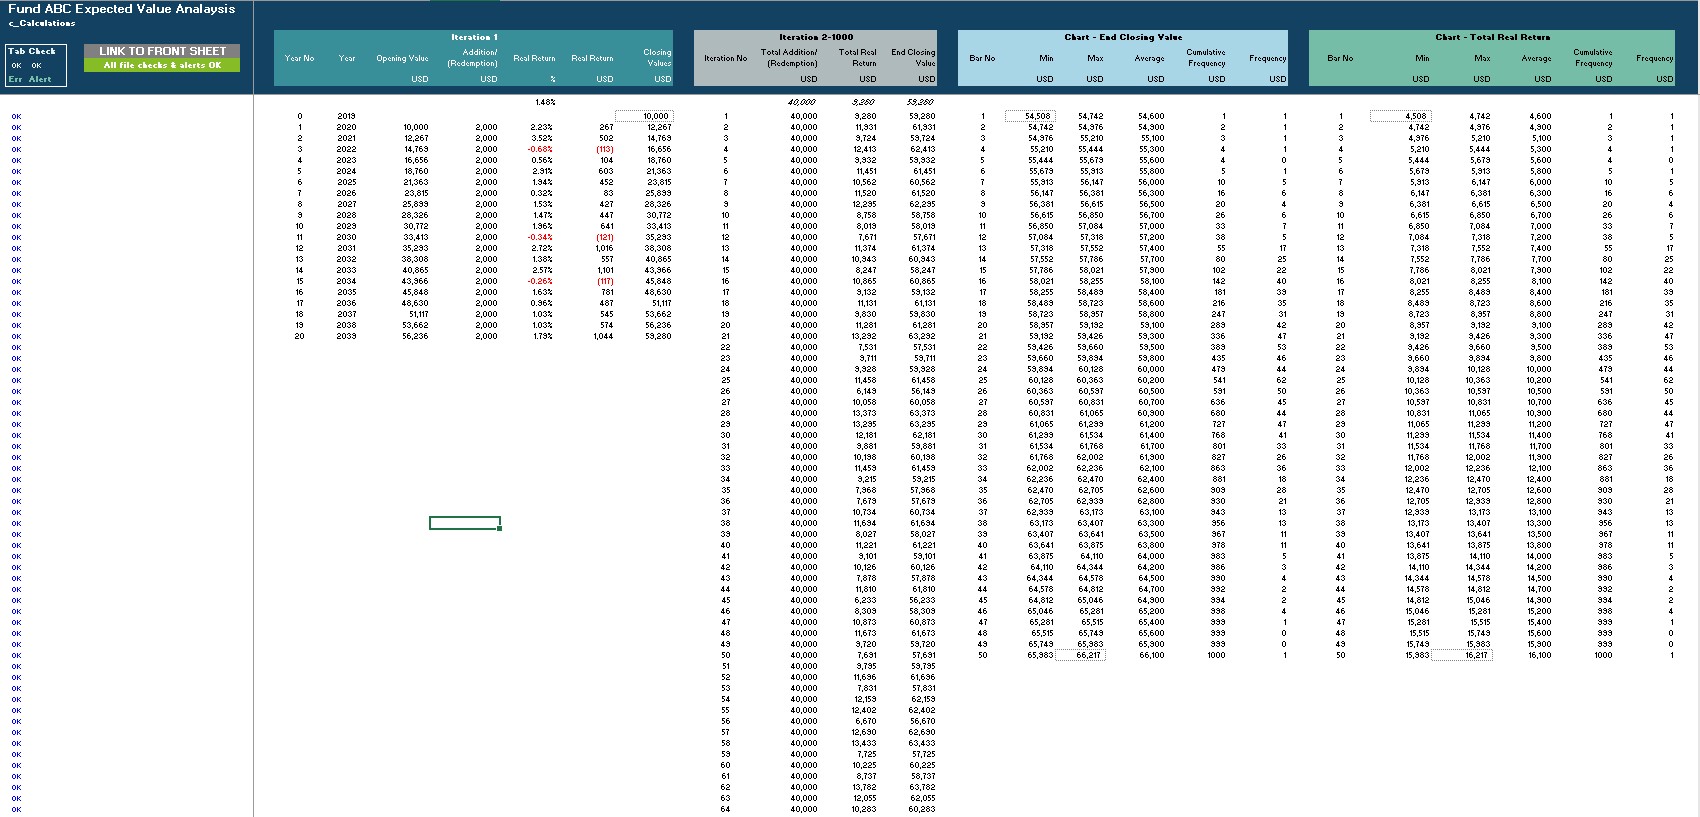
The tool contains, 5 tabs split into input ('i_'), calculation ('c_'), output ('o_') and system tabs. The tabs to be populated by the user is the input tab ('i_Assumptions'). The calculation tab uses the user-defined inputs to calculate and produce the projection outputs which are presented in ‘o_Results'
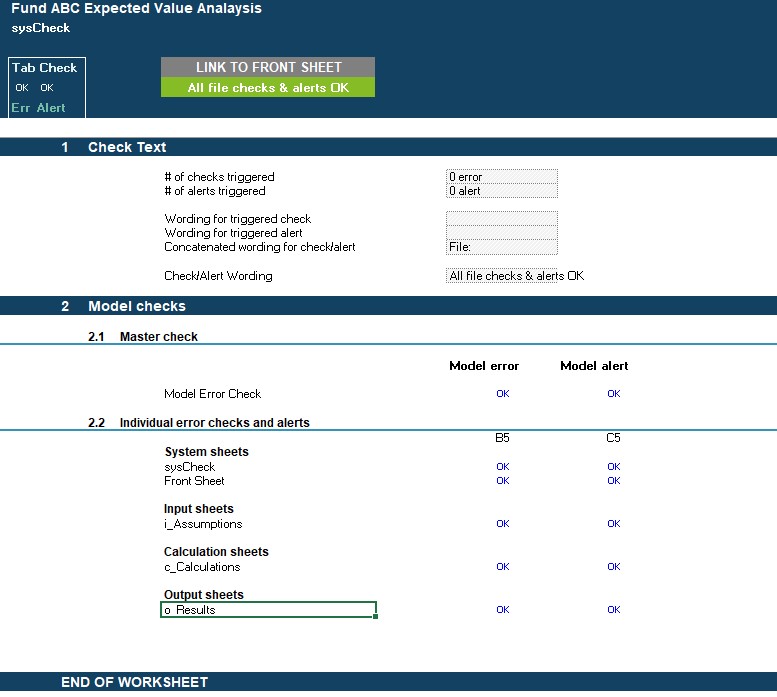
System tabs include:
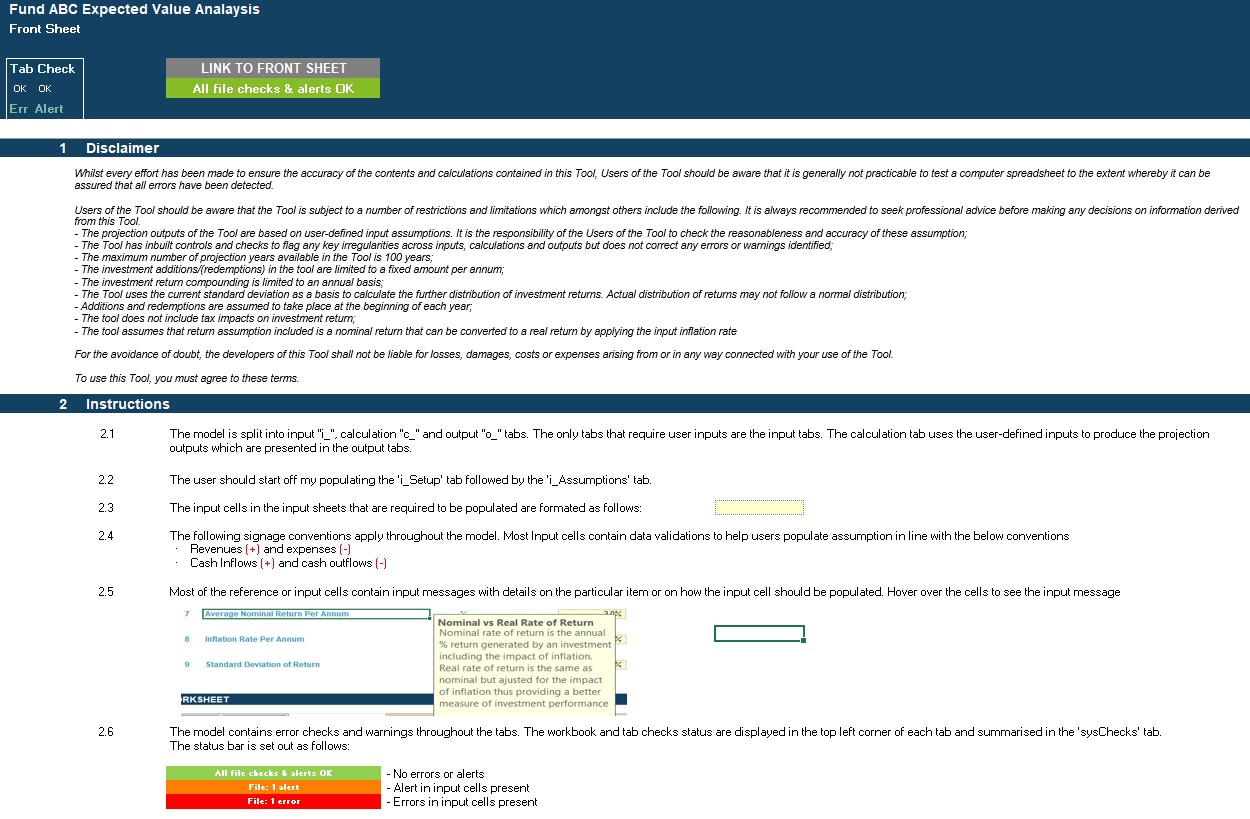
• A 'Front Sheet' containing a disclaimer, instructions and contents;
• A Checks dashboard containing a summary of checks by tab.
KEY FEATURES
Other key features of this model include the following:
• The tool follows best practice financial modelling guidelines and includes instructions, line item explanations, checks and input validations;
• The tool is not password protected and can be modified as required;
• The tool allows for a maximum remaining investment period of 100 years;
• The tool uses Monte Carlo analysis to simulate the investment return and balances for up to 1,000 iterations;
• Investment Name, currency, calculation year are fully customisable;
• The tool includes instructions, line item explanations, checks and input validations to help ensure input fields are populated accurately;
• The tool includes a checks dashboard which summarises all the checks included in the various tabs making it easier to identify any errors.
Got a question about the product? Email us at support@flevy.com or ask the author directly by using the "Ask the Author a Question" form. If you cannot view the preview above this document description, go here to view the large preview instead.
Source: Best Practices in Monte Carlo Excel: Investment Return Monte Carlo Simulation Excel Model Template Excel (XLSX) Spreadsheet, Projectify
ABOUT THE AUTHOR
We are financial modelling professionals, accountants and CFA charterholders with experience working within Deloitte supporting clients with their financial planning and decision support needs. Our aim is to provide robust and easy-to-use financial models that follow good practice financial modelling guidelines and assist individuals and businesses with key financial planning and analysis ... [read more]
Ask the Author a Question
You must be logged in to contact the author.
