
Personal Financial Planning Model with Monte Carlo Simulation – Excel XLSX
Excel (XLSX)
VIDEO DEMO
BENEFITS OF THIS DOWNLOADABLE EXCEL DOCUMENT
- Projection of personal or family cash flow and net worth on annual basis across up to 50-years both on deterministic and stochastic basis.
MONTE CARLO EXCEL DESCRIPTION
A Personal Financial Planning Model with Monte Carlo Simulation is a vital tool for individuals. It allows for comprehensive financial scenario analysis, helping assess retirement readiness, investment strategies, and risk tolerance. By simulating thousands of possible outcomes, it provides a realistic view of financial future, aiding in decision-making and goal setting. This model accounts for market volatility and uncertainties, ensuring prudent planning and risk management. It empowers individuals to make informed financial choices, optimize their financial security, and achieve their long-term goals, making it invaluable for personal financial well-being and peace of mind.
PURPOSE OF MODEL
Highly versatile and user-friendly Excel model for projecting the expected personal cash flow and net worth of an individual or family on an annual basis for a period of up to 50 years.
The model allows the user to project asset and liability balances and cash flows resulting from income streams, ongoing living expenses, income generating assets, loans and other assets and liabilities across a 50-year timeline which can have a mix of actual and forecast periods.
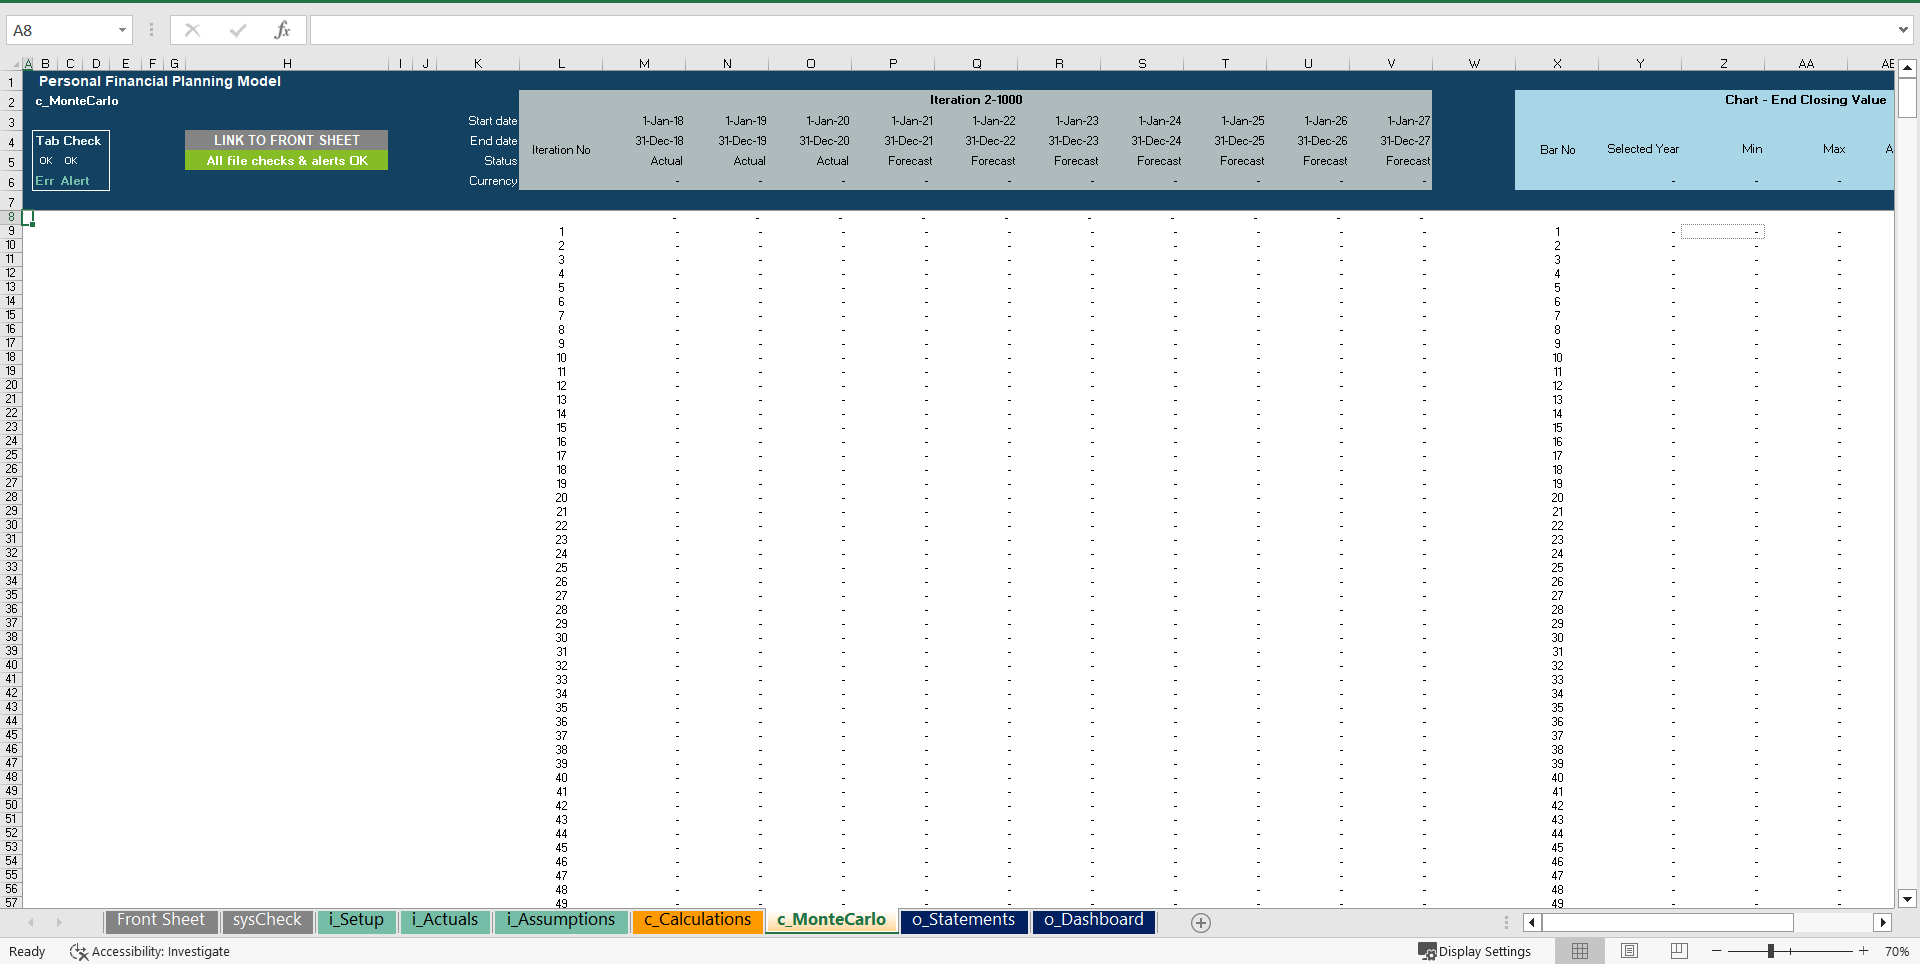
The model allows the user to run projections on both a deterministic and stochastic basis with the stochastic basis using Monte Carlo simulation for investment returns based on 1000 iterations. The model also allows the user to include the impact of special projects (e.g., purchase of yacht or home renovation) on overall savings, cash flows and net worth and to simulate market correction events (eg an economic downturn).
The model follows good practice financial modelling principles and includes instructions, line-item explanations, checks and input validations.
KEY OUTPUTS
The key outputs include:
• Projected Cash flow, and net worth projection statement containing splits for each income, expense, asset and liability category presented on an annual basis up to 50 years.
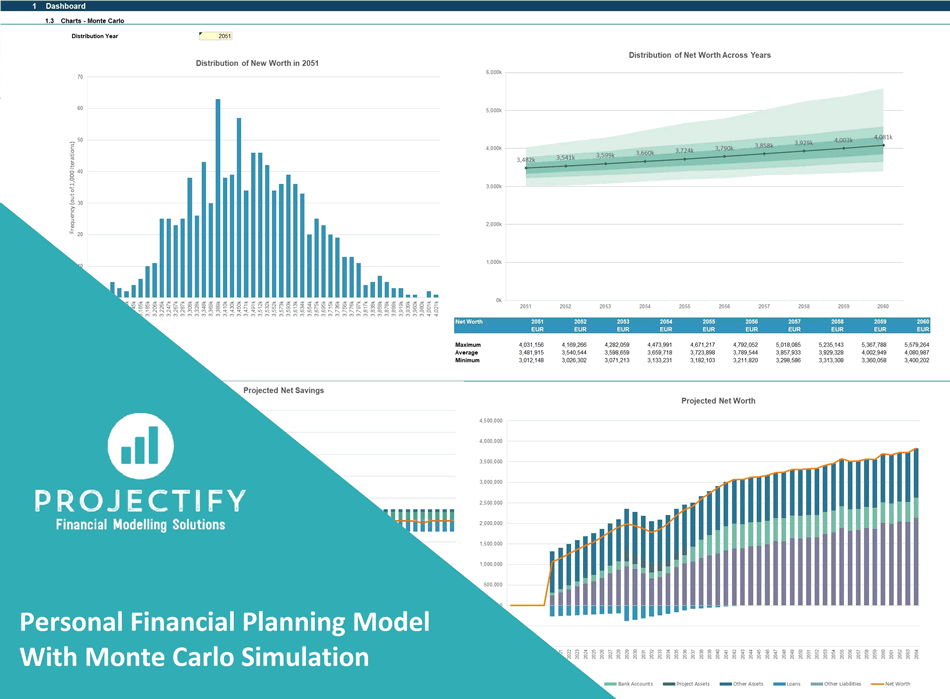
• Dashboard with:
Summarised projected cash flow and net worth statements;
Compounded Annual Growth rate (CAGR) for each summarised cash flow and net worth line item
List of key ratios including average income, savings and net worth growth, average % of expenses to income and average % of liabilities to assets;
Bar and line charts summarising projected savings and net worth across the projection period, distribution of net
worth for a particular year and variability of new worth across a chosen period of 10 years.
KEY INPUTS
Inputs are split into Income, expense, asset and liability inputs. Most inputs include user-friendly line item explanations and input validations to help users understand what the input is for and populate correctly.
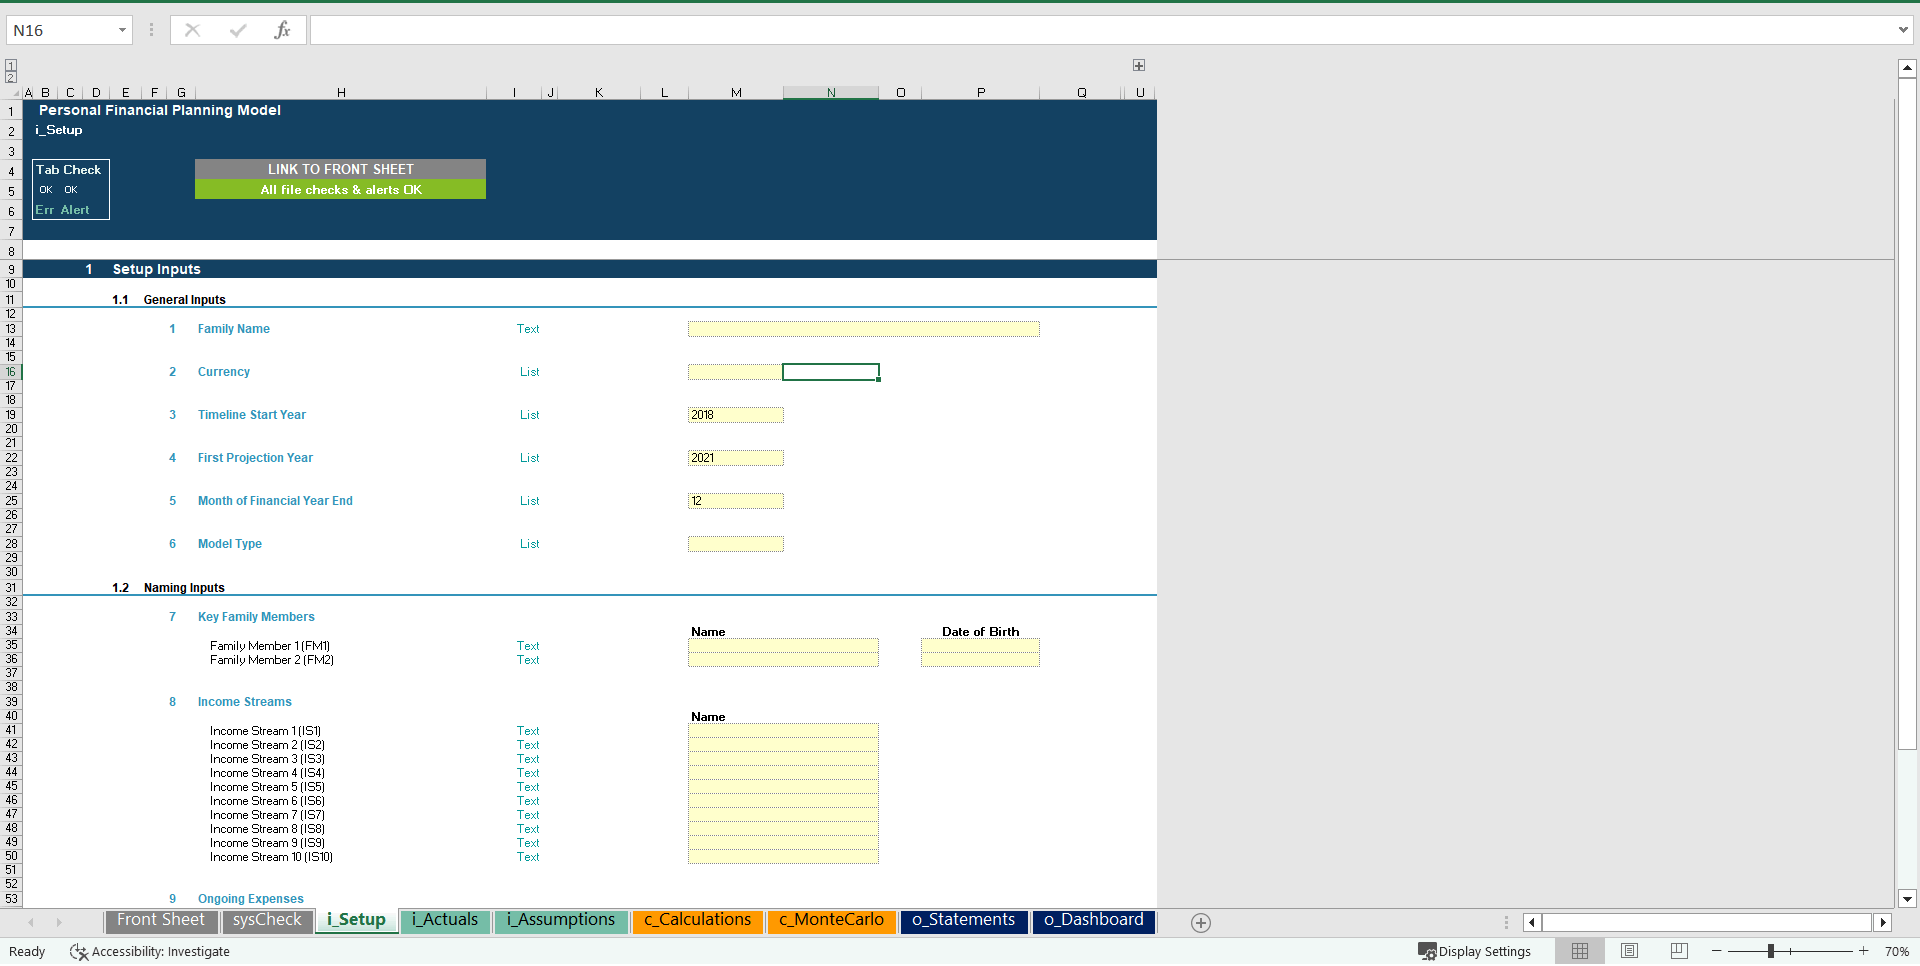
Setup Inputs:
• Name of individual or family;
• Currency;
• Timeline start year;
• First projection year;
• Month of financial year-end;
• Model type (deterministic or stochastic)
• Naming for family members, income streams, ongoing expenses, income generating assets, loans, other assets and liabilities, and projects.
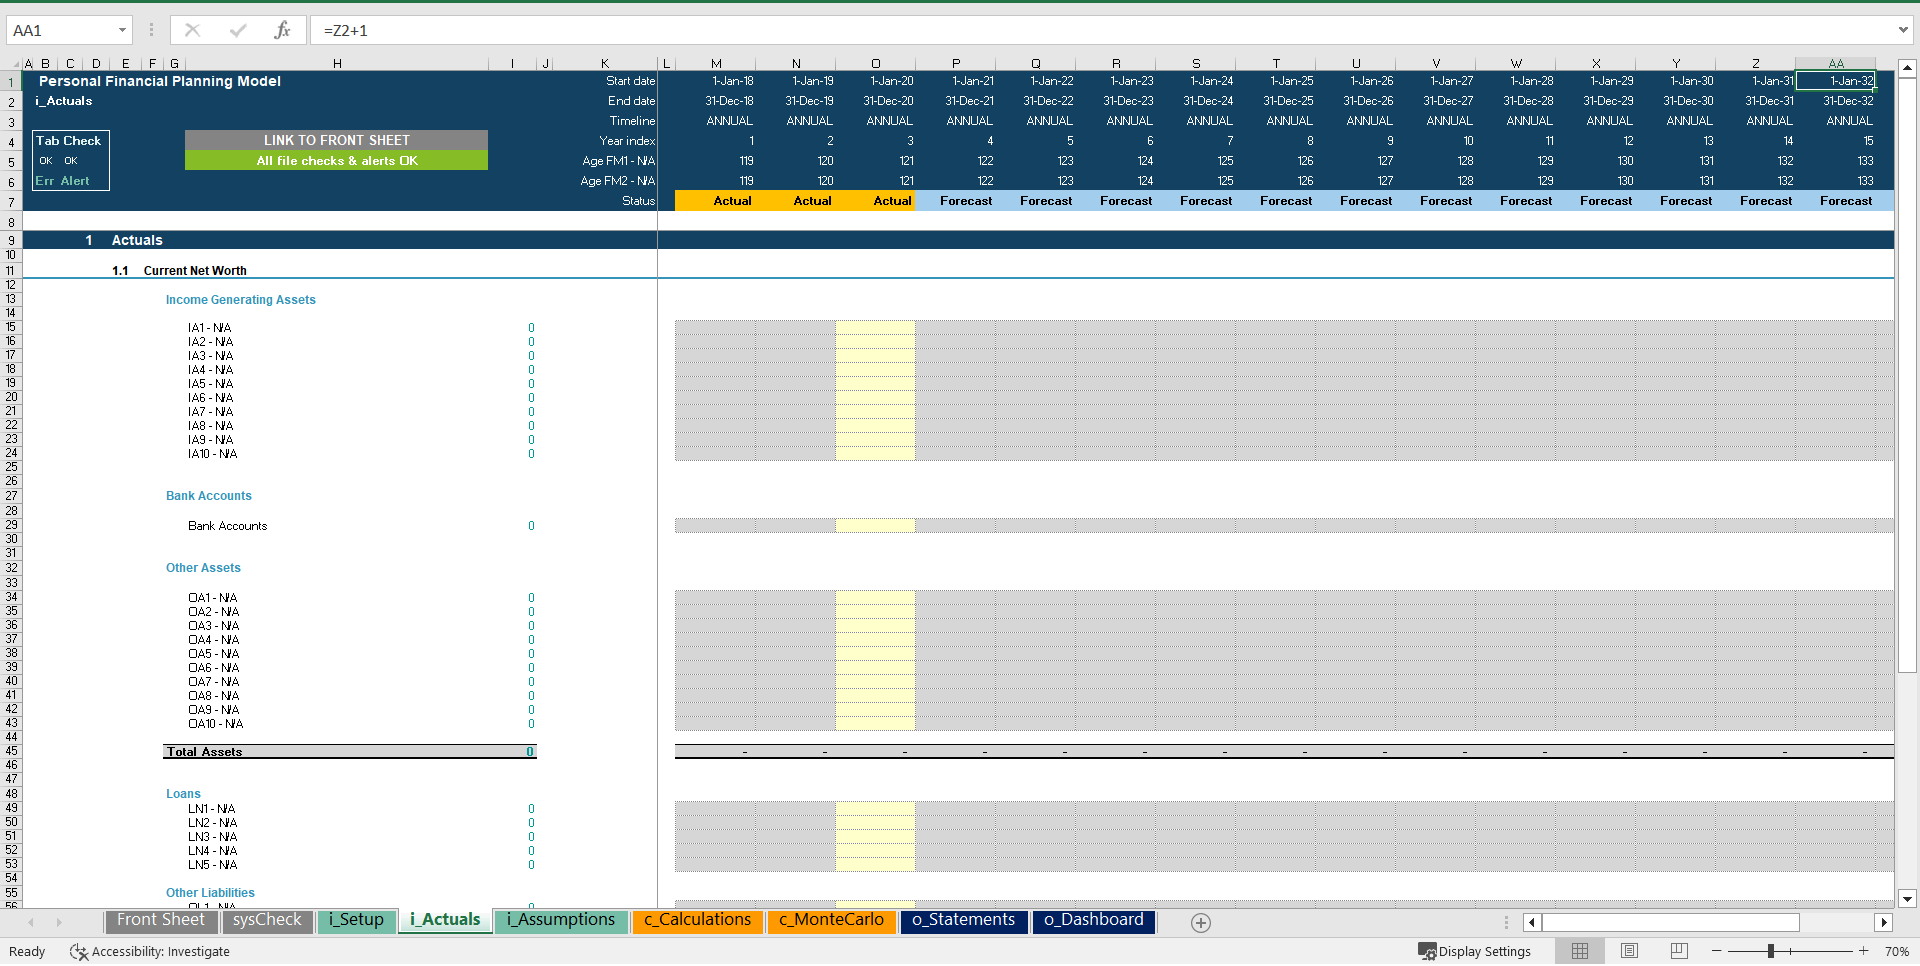
Actuals Inputs:
• Opening balances for individual income-generating assets, bank balances, loans and other assets and liabilities.
Projection Inputs:
• Income stream inputs including pre-tax income by year and whether or not income is subject to tax (10 categories in total);
• Ongoing expenses by year (15 categories in total);
• Income generating asset additions and reductions by year, total real return per annum, standard deviation of return, cash flow portion of return and taxability of returns for each category (10 in total);
• Loan additions and reductions by year, starting year, ending year, interest rate, grace periods for interest and principal for each loan (5 in total);
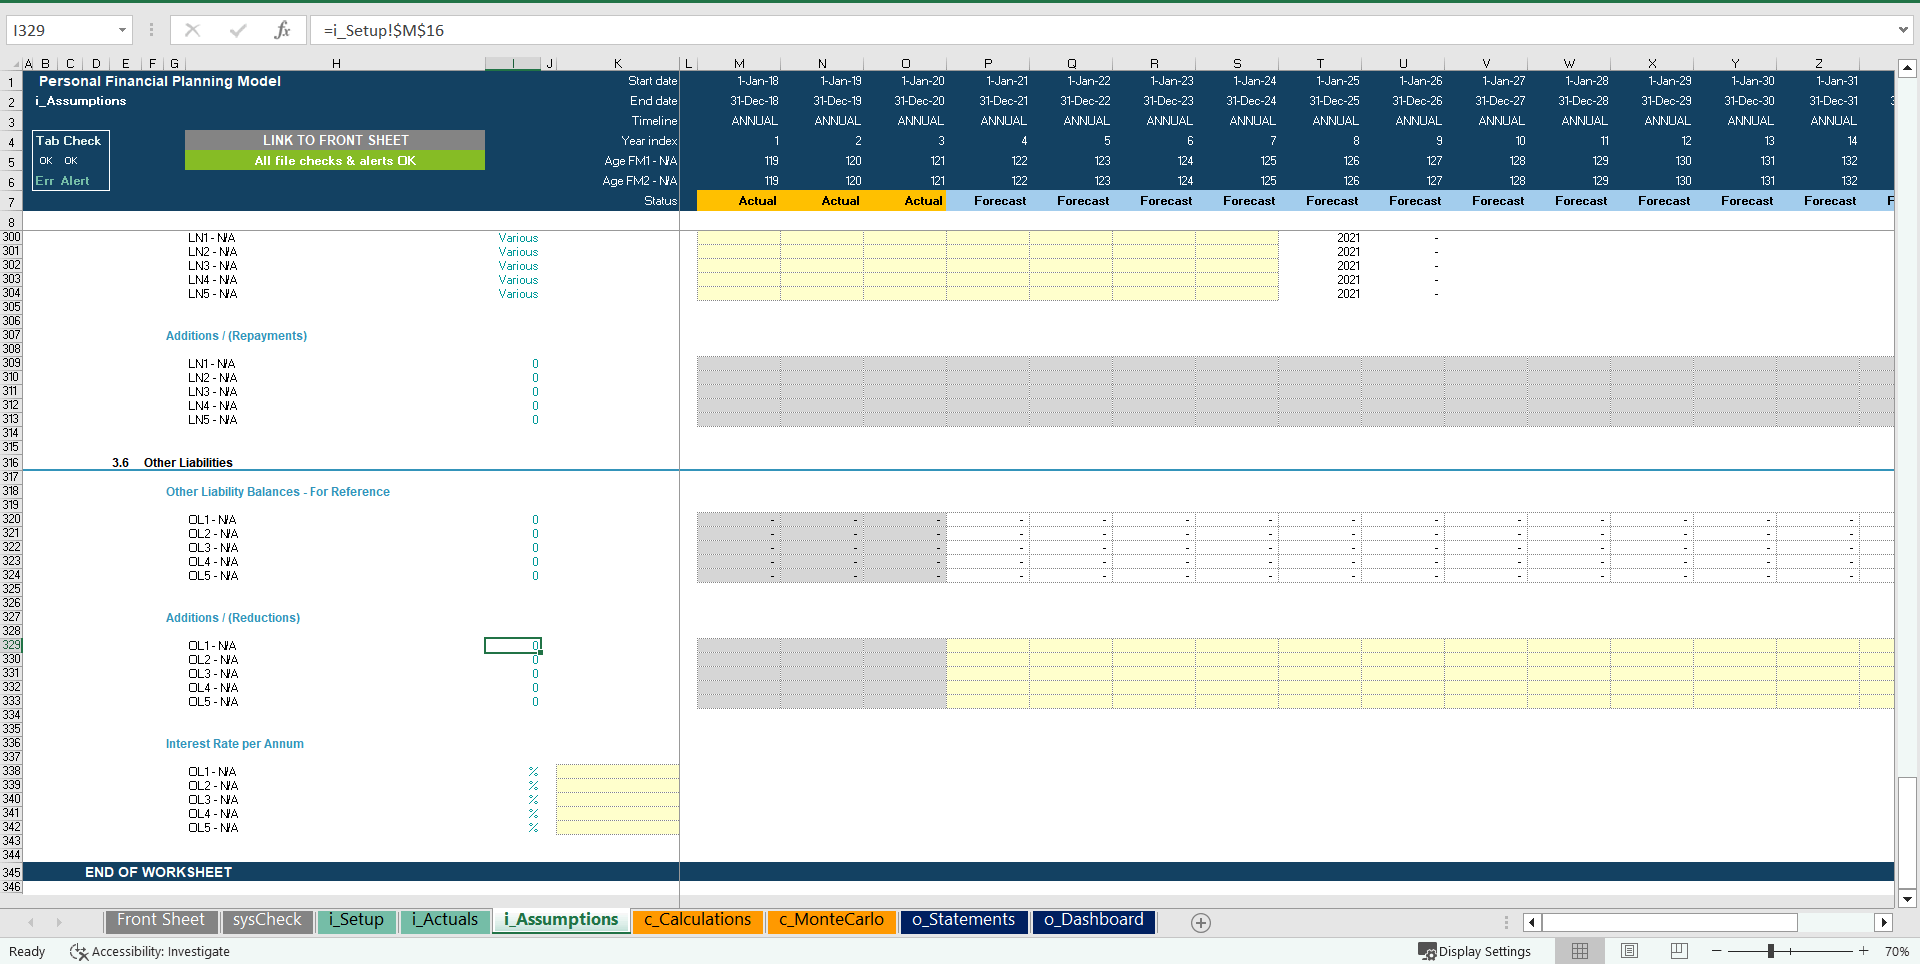
• Other assets additions and reductions by year, appreciations/depreciation rates per annum and transaction cost and taxes for each category (10 in total);
• Other liabilities additions and reductions by year and interest rate per annum for each category (5 in total);
• Project inputs including additions and disposals, appreciations/depreciation factors, ongoing income/expenses for each category (3 in total);
• Other cash flow movements per year for each category (5 in total);
• Income tax bands (5 in total) and capital loss balance;
• Market correction period and factors (to simulate an economic downturn).
MODEL STRUCTURE
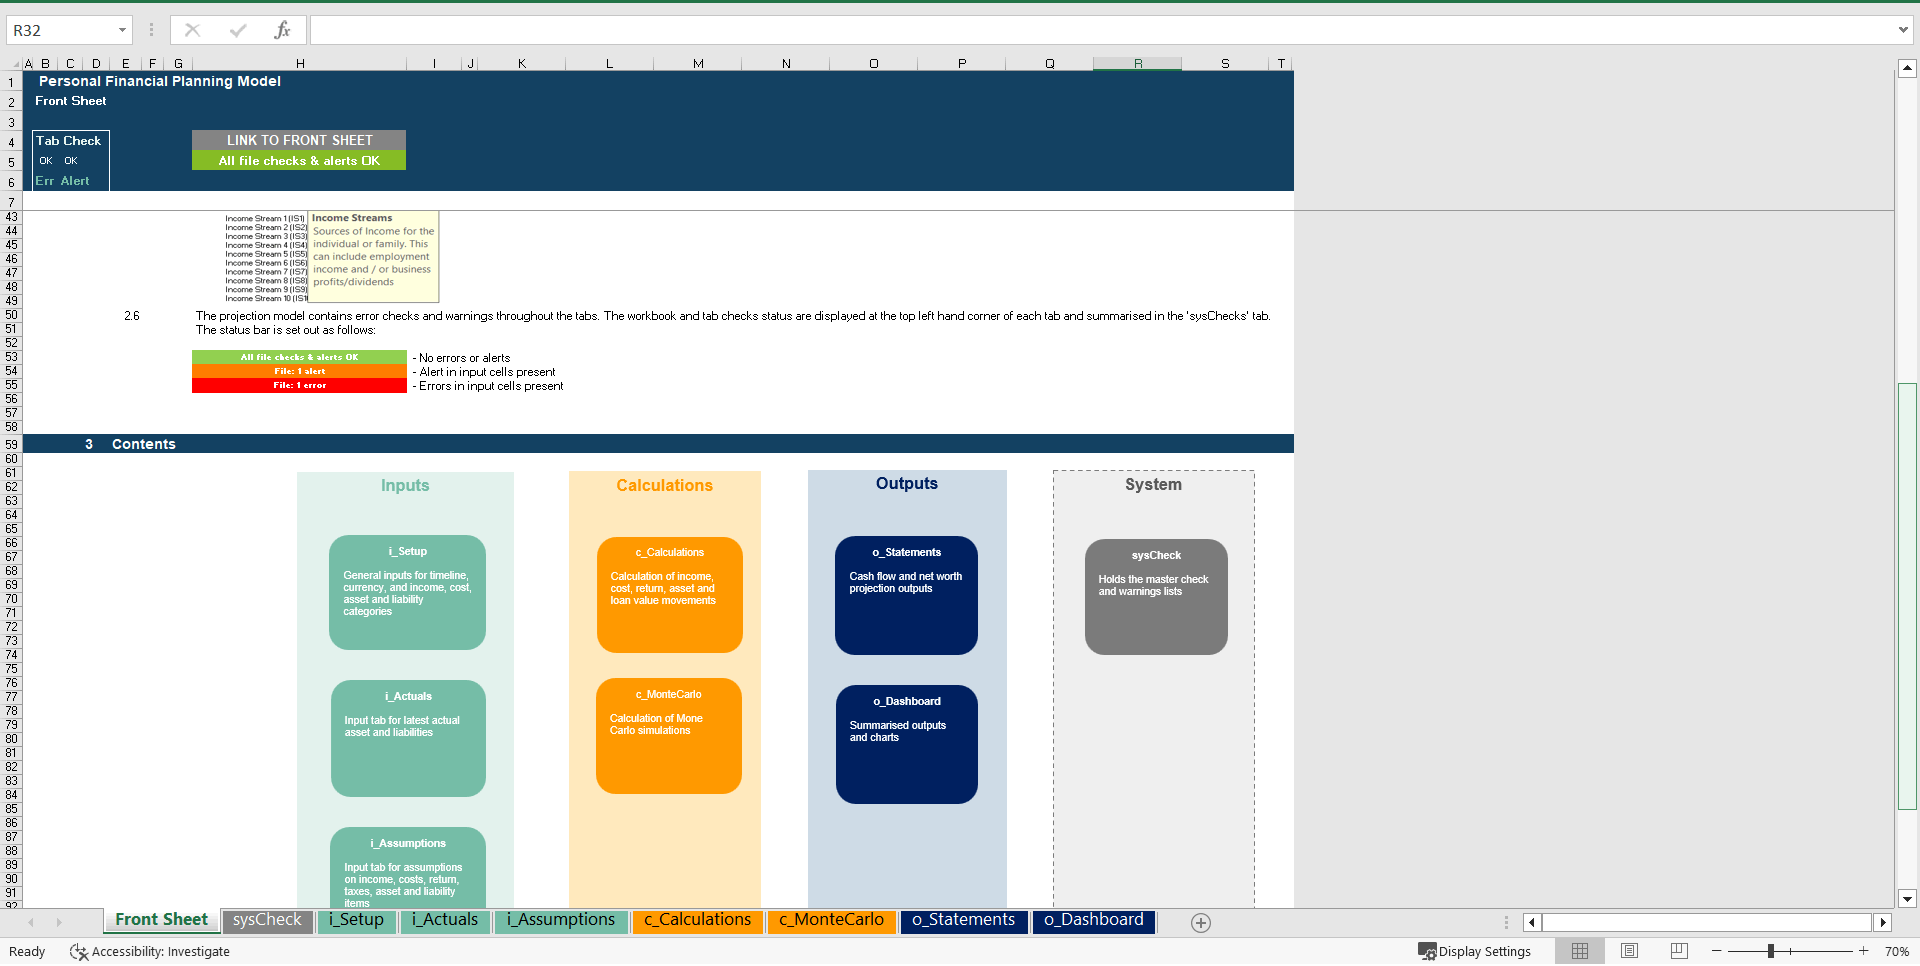
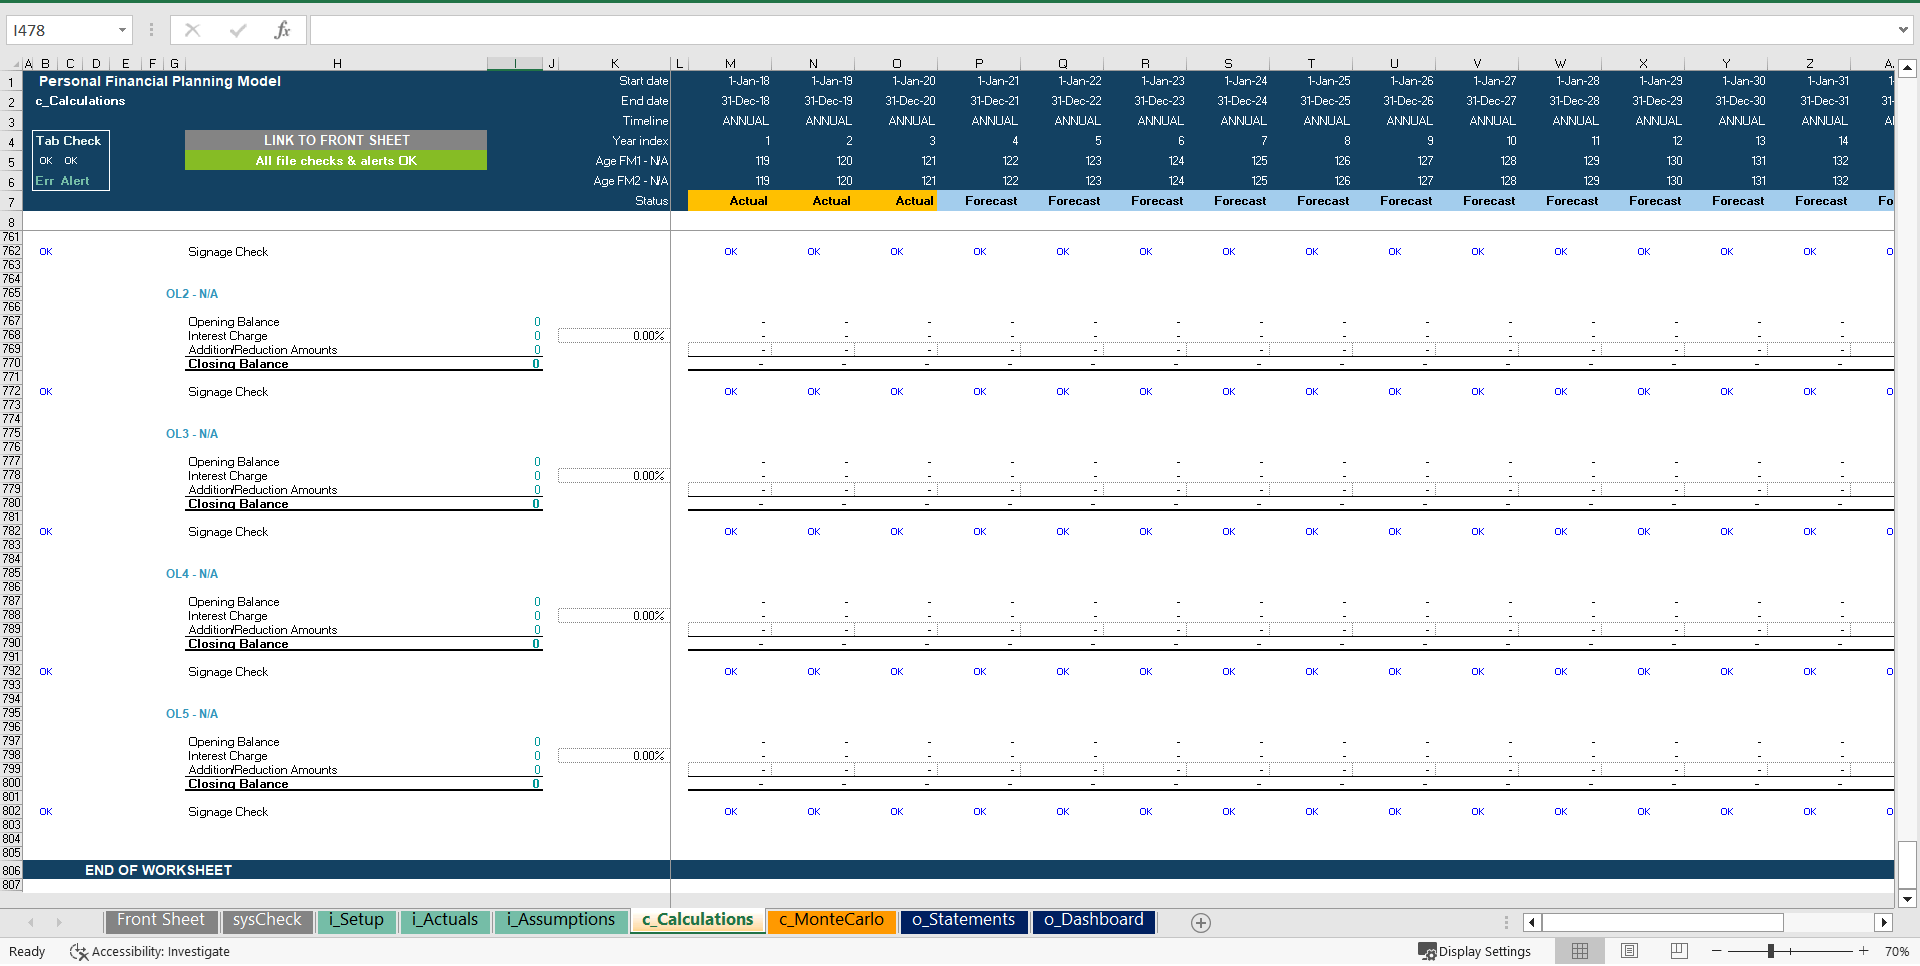
The model comprises of 9 tabs split into input ('i_'), calculation ('c_'), output ('o_') and system tabs. The tabs to be populated by the user are the input tabs ('i_Setup', ‘i_Actuals' and 'i_Assumptions'). The calculation tabs uses the user-defined inputs to calculate and produce the projection outputs which are presented in 'o_Statements, and ‘o_Dashboard'.
System tabs include:
• A 'Front Sheet' containing a disclaimer, instructions and contents;
• A Checks dashboard containing a summary of checks by tab.
KEY FEATURES
Other key features of this model include the following:
• The model follows best practice financial modelling guidelines and includes instructions, line-item explanations, checks and input validations;
• The model contains a flexible timeline that allows for a mix of Actual and Forecast period across a 50-year period. This allows projections to be easily rolled forward;
• The model allows for the following number of underlying categories for each line item (these can be easily expanded if required):
Income streams – 10 categories;
Ongoing expenses – 15 categories;
Income generating assets – 10 categories;
Other assets – 10 categories;
Loans – 5 categories;
Projects – 3 categories;
Other liabilities – 5 categories
Other cash flow movements – 5 categories.
• Apart from projecting asset and liability balances the model includes cash flow projections which increase or decrease the bank balances;
• The model can be run on a deterministic basis (1 set of results without randomness) or stochastic basis (1000 iterations based on normal distribution of investment returns) with the latter showing the possible variability in the results;
• Individual/family Name, currency, starting timeline, financial year-end and first projection year are fully customisable;
• Income, expense, asset and liability descriptions are fully customisable;
• The model includes instructions, line-item explanations, checks and input validations to help ensure input fields are populated accurately;
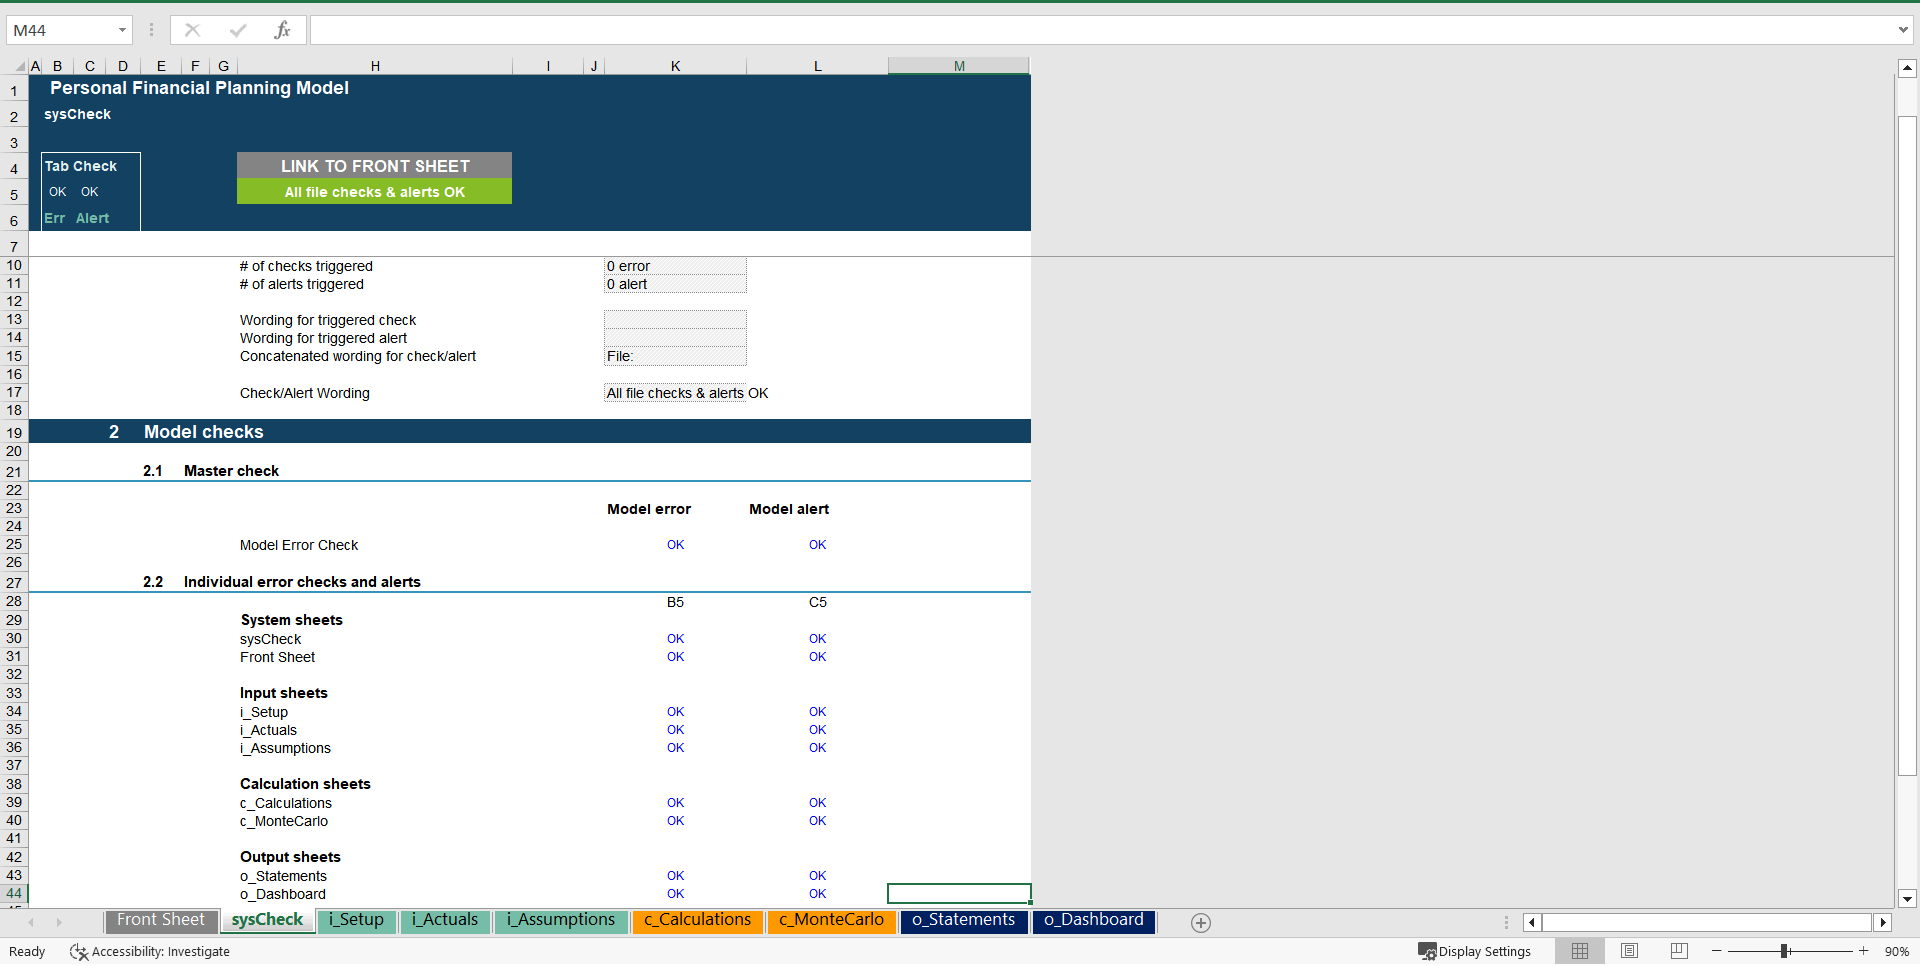
• The model includes a checks dashboard which summarises all the checks included in the various tabs making it easier to identify any errors.
Got a question about the product? Email us at support@flevy.com or ask the author directly by using the "Ask the Author a Question" form. If you cannot view the preview above this document description, go here to view the large preview instead.
Source: Best Practices in Monte Carlo Excel: Personal Financial Planning Model with Monte Carlo Simulation Excel (XLSX) Spreadsheet, Projectify
ABOUT THE AUTHOR
We are financial modelling professionals, accountants and CFA charterholders with experience working within Deloitte supporting clients with their financial planning and decision support needs. Our aim is to provide robust and easy-to-use financial models that follow good practice financial modelling guidelines and assist individuals and businesses with key financial planning and analysis ... [read more]
Ask the Author a Question
You must be logged in to contact the author.
