

Equity Portfolio Monte Carlo Simulation Investment Return Calculator Dashboard – Excel XLSX
Excel (XLSX) + Excel (XLSX)
MONTE CARLO EXCEL DESCRIPTION
Equity Portfolio Monte Carlo Simulation Investment is crucial for investors seeking to manage risk and optimize returns. It uses statistical models to simulate various market scenarios, providing insights into portfolio performance under different conditions. This helps in setting realistic expectations, adjusting asset allocations, and improving diversification. By assessing a range of outcomes, it enhances decision-making, mitigates potential losses, and maximizes long-term gains. In a volatile market, this strategy is invaluable for achieving financial goals while maintaining a balanced risk-reward profile, making it a cornerstone of modern investment management.
PURPOSE OF MODEL
User-friendly Excel model to calculate the expected value and return for a portfolio of equity investments using Monte Carlo simulation analysis. The model allows the user to specify individual equity investment holdings (up to 15 different currency holdings), expected return, expected standard deviation and the investment period to calculate a distribution of the expected total return and investment balance at the end of the investment period using Monte Carlo simulation.
The model uses Microsoft Excel Stock Data Type to automatically retrieve current/live and historical stock information to compute portfolio metrics/composition outputs and help determine / sense-check key projection assumptions including standard deviation and investment return. IMPORTANT: IN ORDER FOR STOCK DATA FUNCTION TO WORK, A MICROSOFT 365 SUBSCRIPTION IS REQUIRED.
The model follows best practice financial modelling principles and includes instructions, checks and input validations
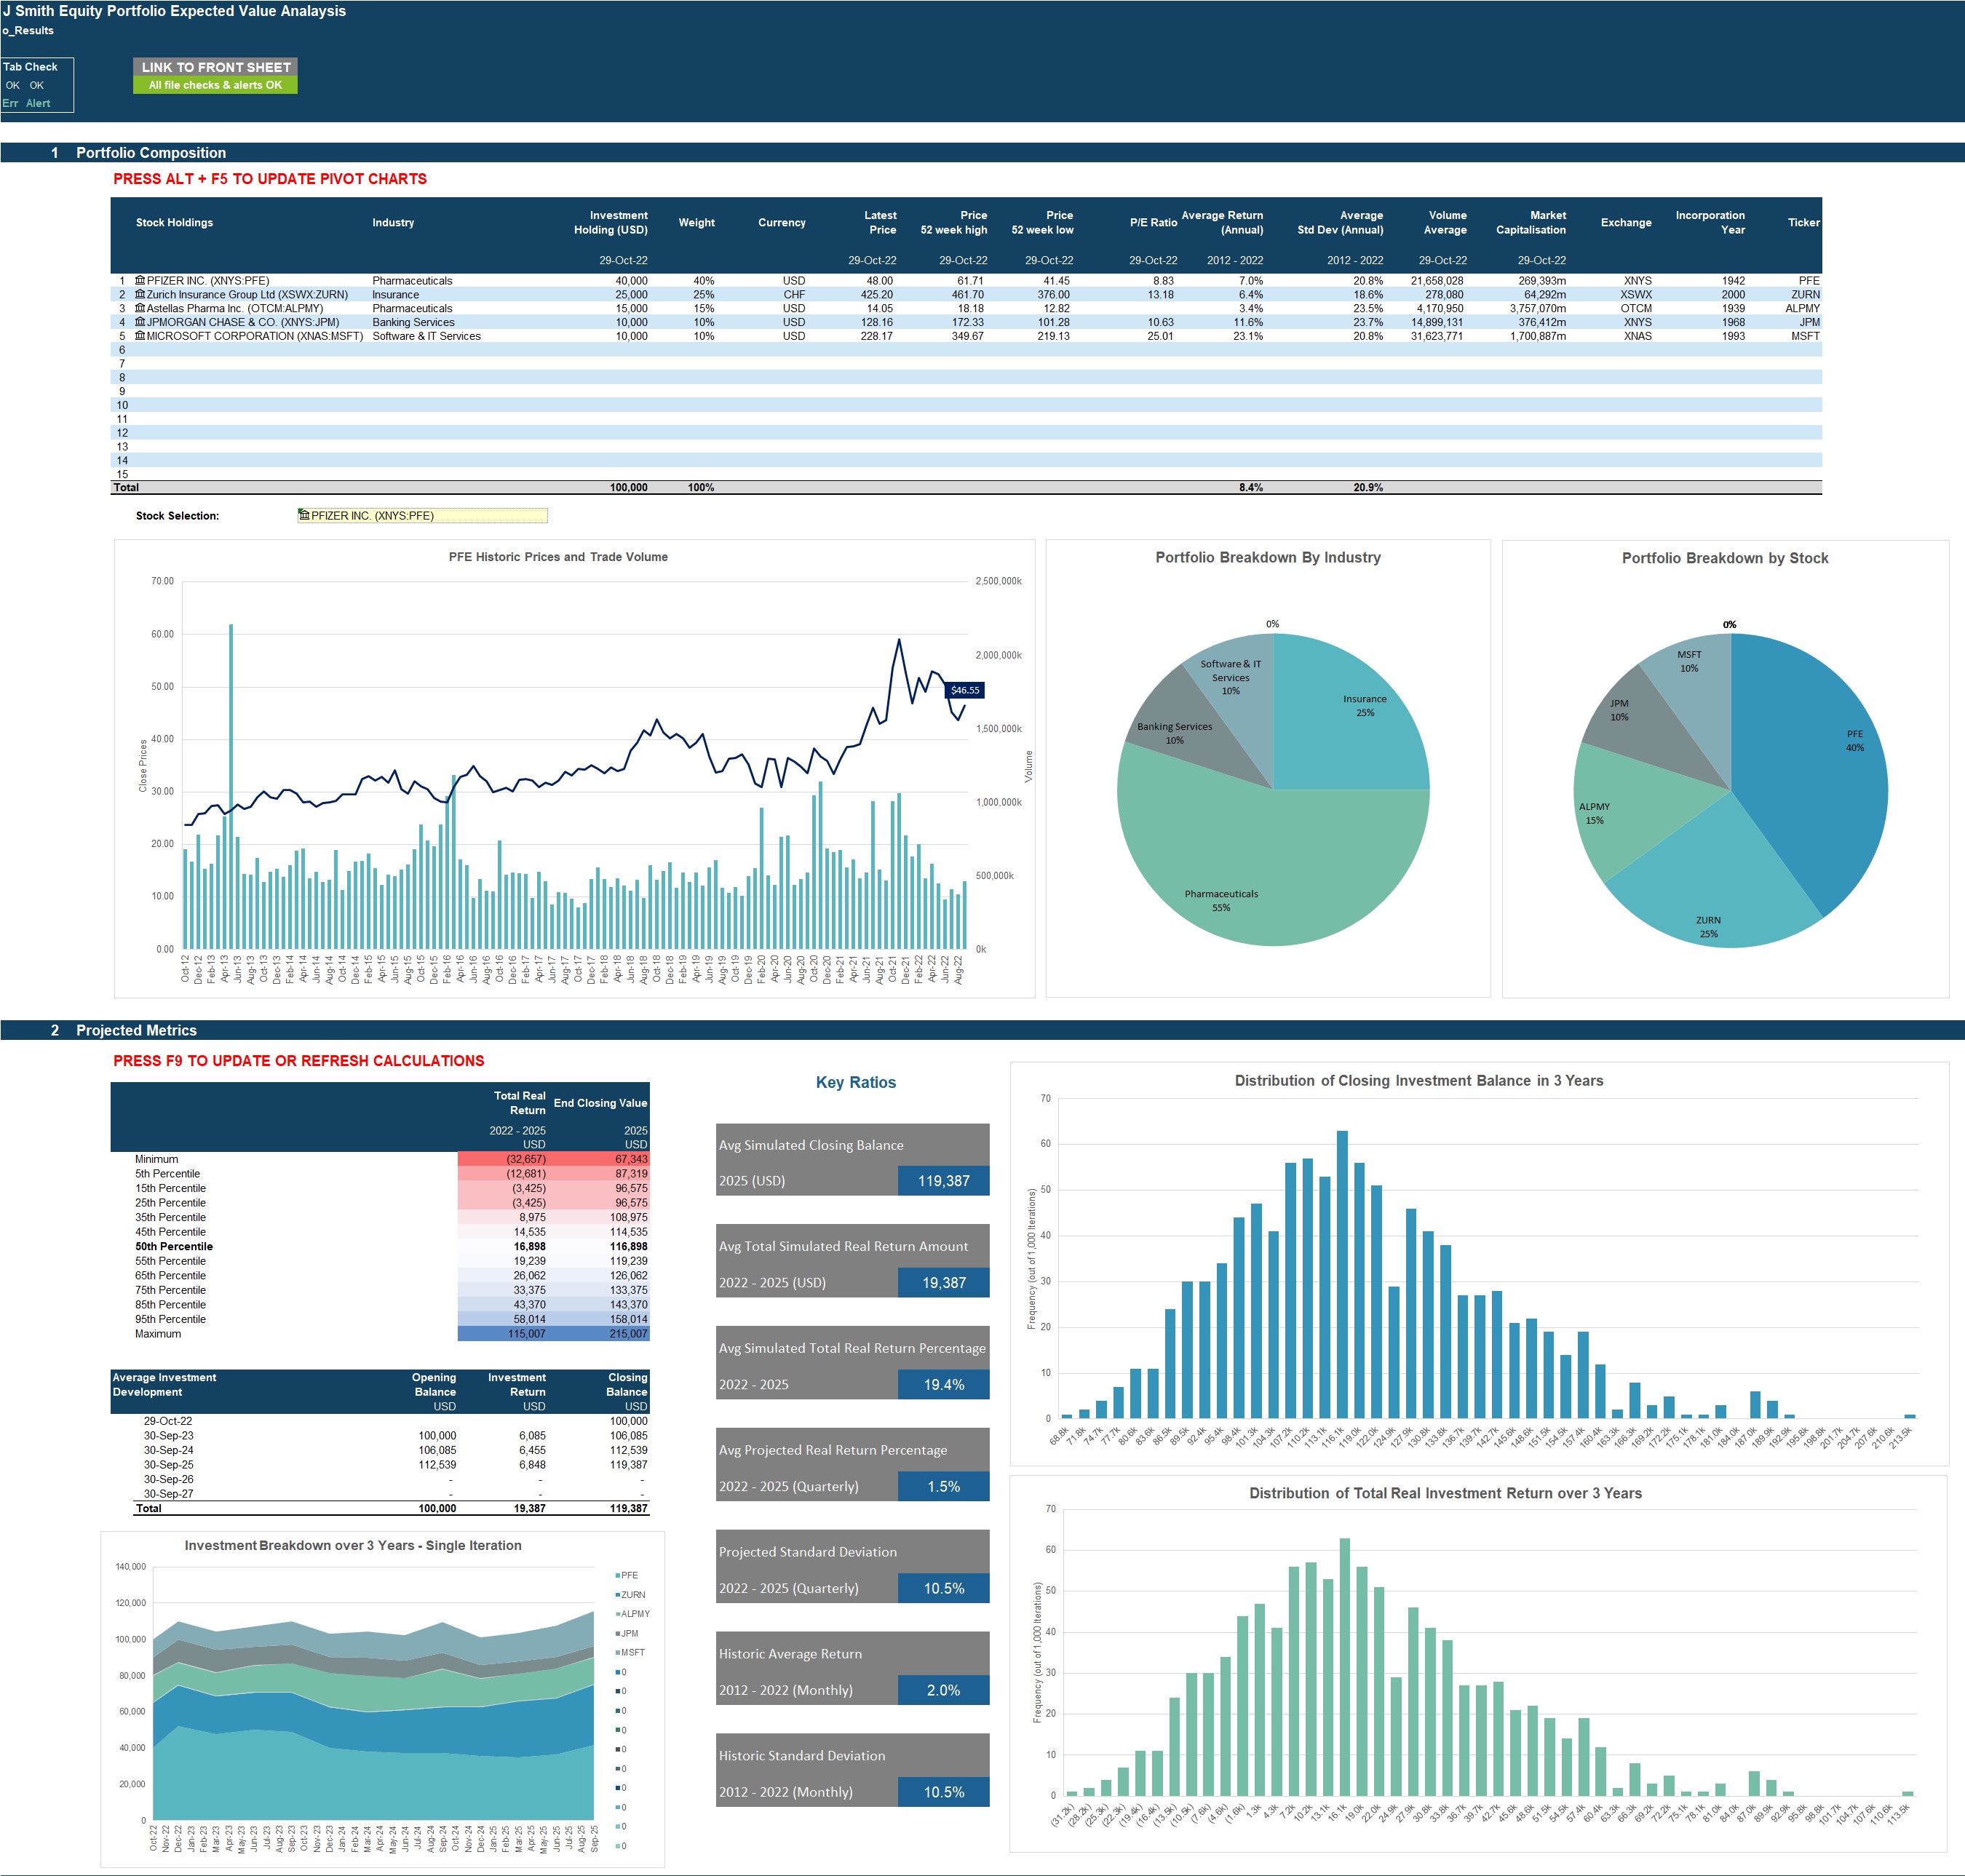
KEY OUTPUTS
The key outputs include:
• Distribution chart of investment balances at end of investment period;
• Distribution chart of the total investment return over the investment period;
• Chart showing investment holding breakdown for a single iteration across investment period;
• Key results/ratios including average investment balance, average investment return, historic average return and historic standard deviation;
• Table showing total investment balance and investment return across key percentiles
• Table showing average development of investment balance over projection period.
• Table and charts showing current portfolio composition and key metrics including historical price movement and volume charts.
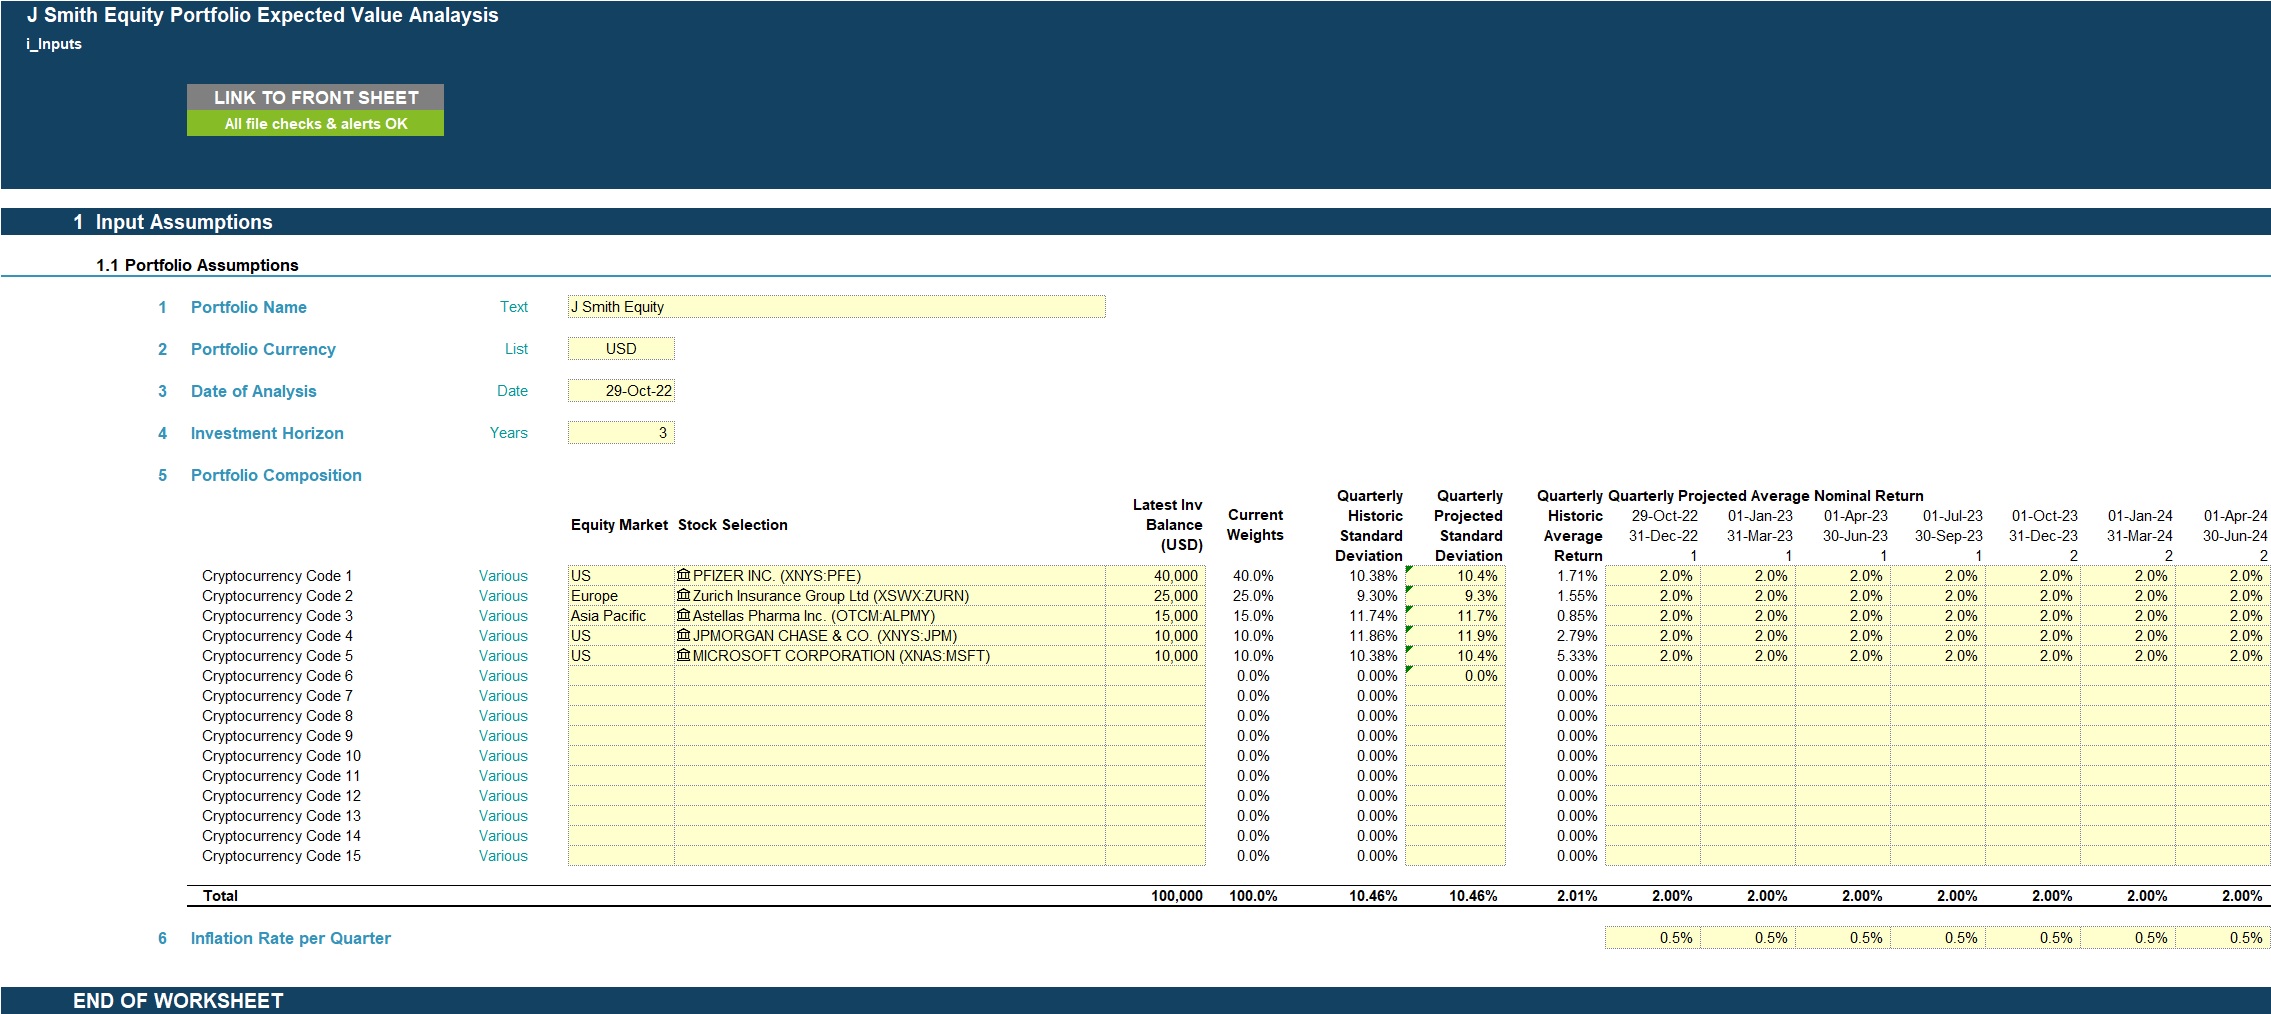
KEY INPUTS
The key inputs include
• Currency
• Date of analysis
• Projection years
• Portfolio composition (tickers and current investment balance by holding)
• Expected standard deviation
• Expected average return
• Expected inflation rates
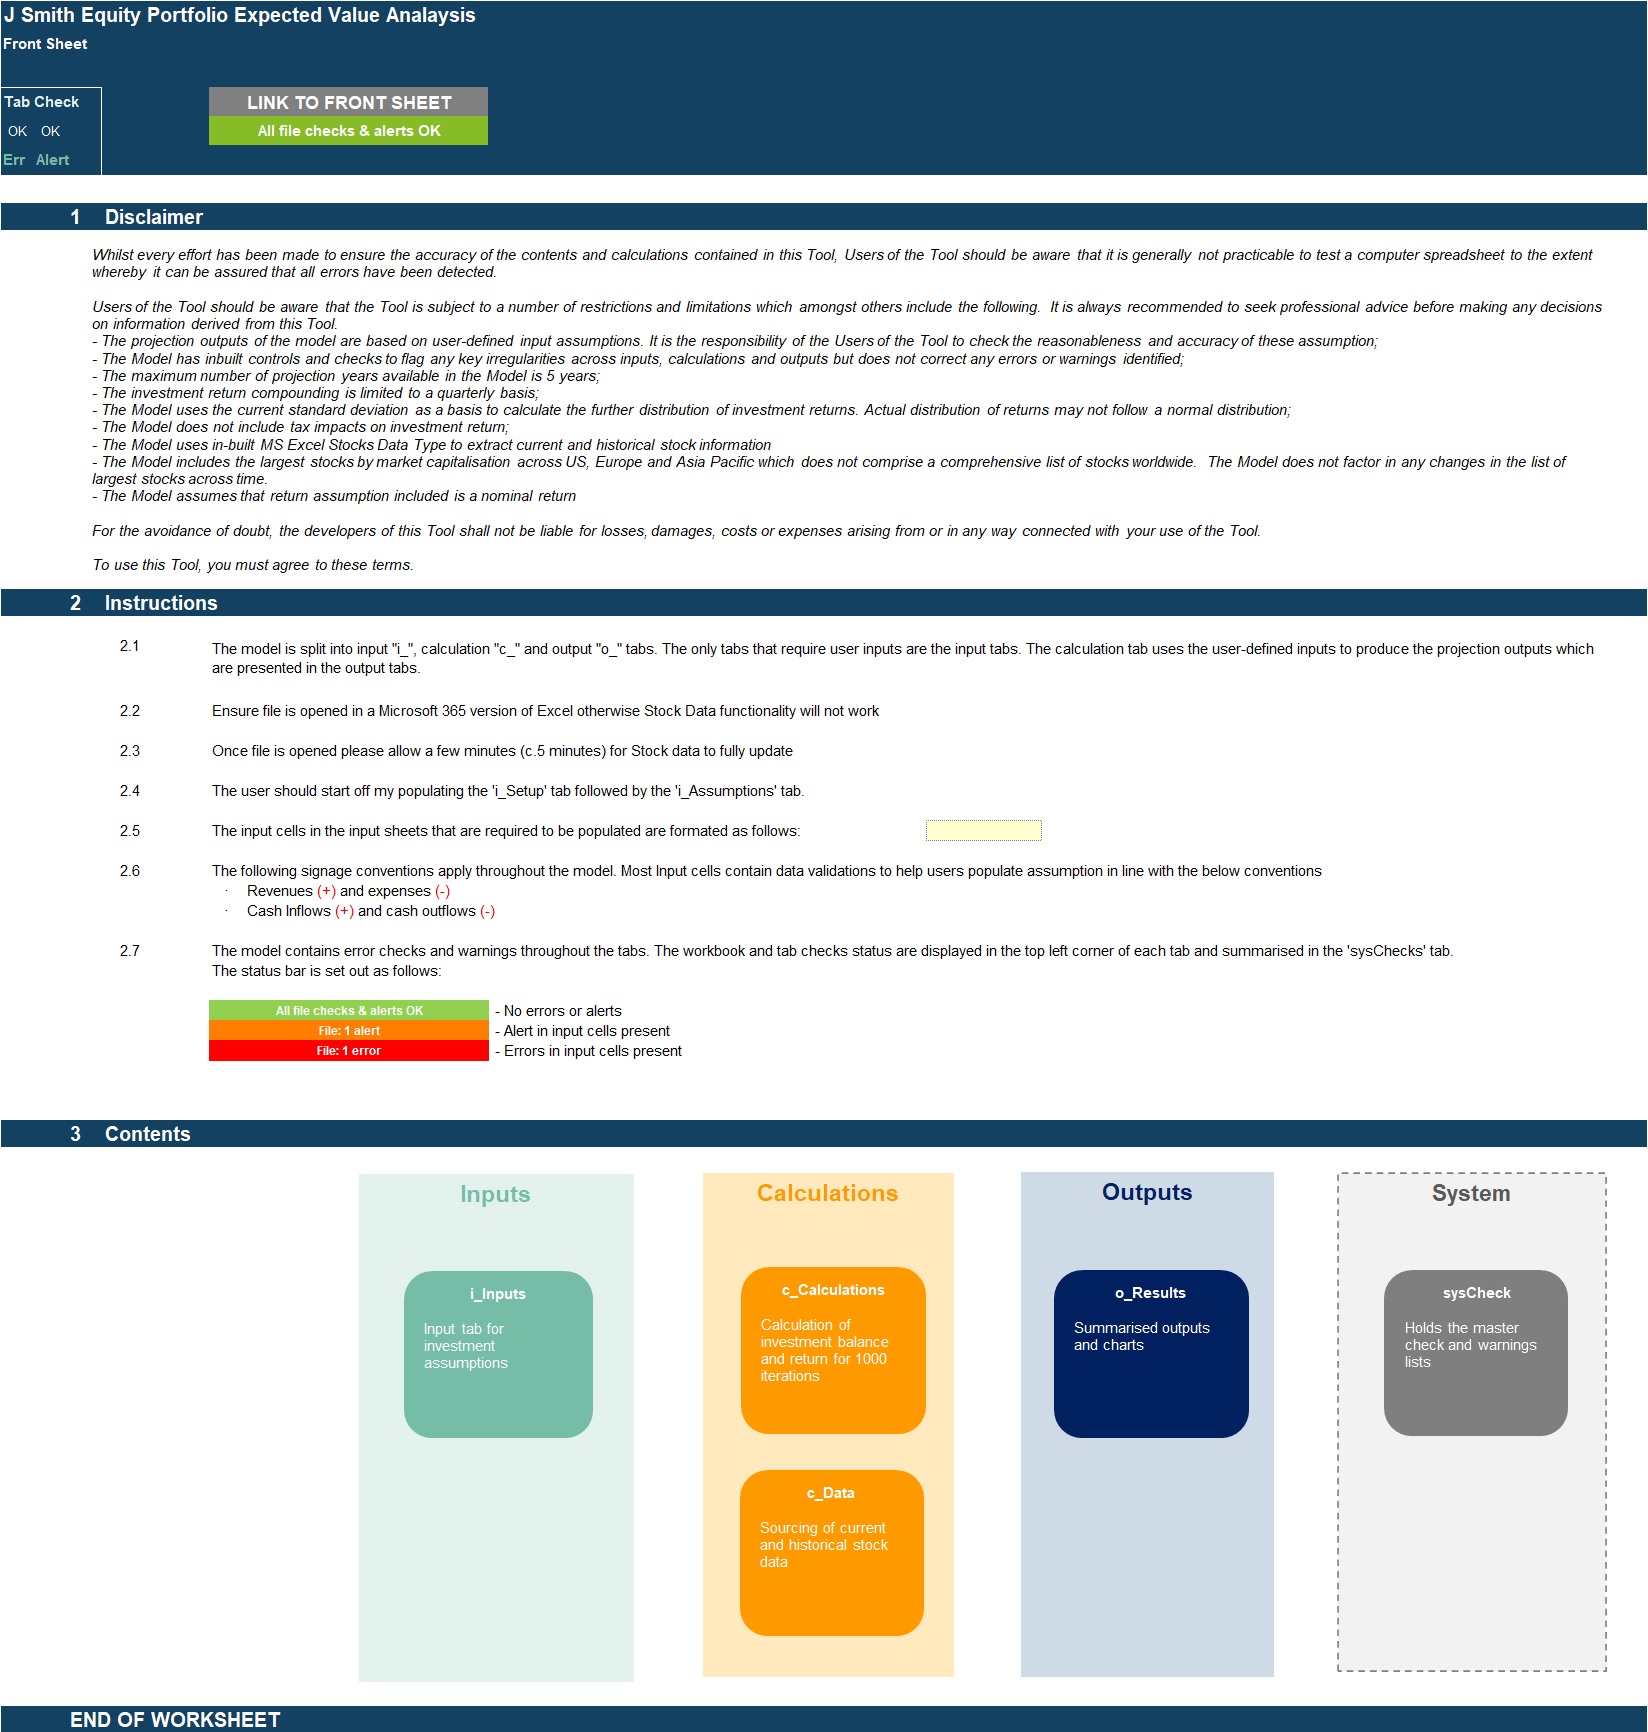
MODEL STRUCTURE
The model contains, 6 tabs split into input ('i_'), calculation ('c_'), output ('o_') and system tabs. The tabs to be populated by the user is the input tab ('i_Inputs'). The calculation tabs use the user-defined inputs to calculate and produce the projection outputs which are presented in ‘o_Results'
System tabs include:
• A 'Front Sheet' containing a disclaimer, instructions and contents;
• A Checks dashboard containing a summary of checks by tab.
KEY FEATURES
Other key features of this model include the following:
• The model follows best practice financial modelling guidelines and includes instructions, checks and input validations;
• The model allows for a maximum remaining investment period of 5 years;
• The model uses Monte Carlo analysis to simulate the investment return and balances for up to 1,000 iterations;
• Portfolio composition (investment holdings), currency, calculation year are fully customisable;
• The Model includes a prepopulated list containing the largest c.1500 stocks by market capitalisation across US, Europe and Asia Pacific, which can be extended by the model users if required;
• The model includes instructions, checks and input validations to help ensure input fields are populated accurately;
• The model includes a checks dashboard which summarises all the checks included in the various tabs making it easier to identify any errors.
Got a question about the product? Email us at support@flevy.com or ask the author directly by using the "Ask the Author a Question" form. If you cannot view the preview above this document description, go here to view the large preview instead.
Source: Best Practices in Monte Carlo Excel: Equity Portfolio Monte Carlo Simulation Investment Return Calculator Excel (XLSX) Spreadsheet, Projectify
ABOUT THE AUTHOR
We are financial modelling professionals, accountants and CFA charterholders with experience working within Deloitte supporting clients with their financial planning and decision support needs. Our aim is to provide robust and easy-to-use financial models that follow good practice financial modelling guidelines and assist individuals and businesses with key financial planning and analysis ... [read more]
Ask the Author a Question
You must be logged in to contact the author.
