
Industrial Real Estate Developer 10-Year Financial Model – Excel XLSX
Excel (XLSX)
BENEFITS OF THIS DOWNLOADABLE EXCEL DOCUMENT
- Provides a framework for developing an institutional-grade Industrial Real Estate development and portfolio management strategy fitting for your organization.
- Delivers a fully integrated 3-statement financial model purpose-built for underwriting, developing, leasing, and exiting industrial assets across a 10-year forecast horizon.
- Enables investment-committee-ready scenario analysis, NOI stress-testing, and development yield benchmarking tailored to your specific capital stack and portfolio strategy.
REAL ESTATE EXCEL DESCRIPTION
Curated by McKinsey-trained Executives
🏗️ Industrial Real Estate Developer Financial Model | Institutional-Grade Integrated 3-Statement 10-Year Forecast
Turn your industrial real estate development business into a bankable, fundable, investment-committee-ready enterprise – modeled with the institutional-grade precision used by the world's leading logistics developers, warehouse operators, distribution park sponsors, and light industrial platforms.
Whether you're an industrial developer raising equity for your next logistics park, a private equity real estate firm underwriting a warehouse acquisition, a CFO stress-testing development yields and debt service coverage ratios, an investment banker running an industrial REIT M&A process, or a corporate finance team benchmarking NOI margins against Prologis-style sector comps – this fully integrated 3-Statement Financial Model gives you the exact financial infrastructure to develop, lease, finance, refinance, and exit industrial assets with complete institutional confidence.
💡 What's Inside
This model covers every financial dimension of building and scaling an industrial real estate development business – from your first land acquisition through a 10-year path to stabilised NOI, development pipeline maturity, portfolio recapitalisation, or full disposition exit. Built on institutional real estate financial modeling best practices, it's fully dynamic, cross-linked across 17 tabs, and ready to customise for your specific asset type mix, development timeline, leasing structure, capital stack, and exit strategy.
📥 Inputs
• 🏗️ 4-Category Portfolio Engine – Separate modeling for Stabilised Income-Producing Assets (GLA × rent per sqft × occupancy), Development Projects (construction pipeline with phased cost draws and lease-up curves), Land Bank (held-for-development parcels with carrying costs), and Disposition Pipeline (assets marked for exit with exit cap rate and sale timing) – each with individual base-year inputs, annual growth assumptions, and NOI contribution – plus a fully independent rent and occupancy model with asset-level leasing inputs – every revenue dollar traced to its operational root cause, fully adjustable from a single Assumptions tab
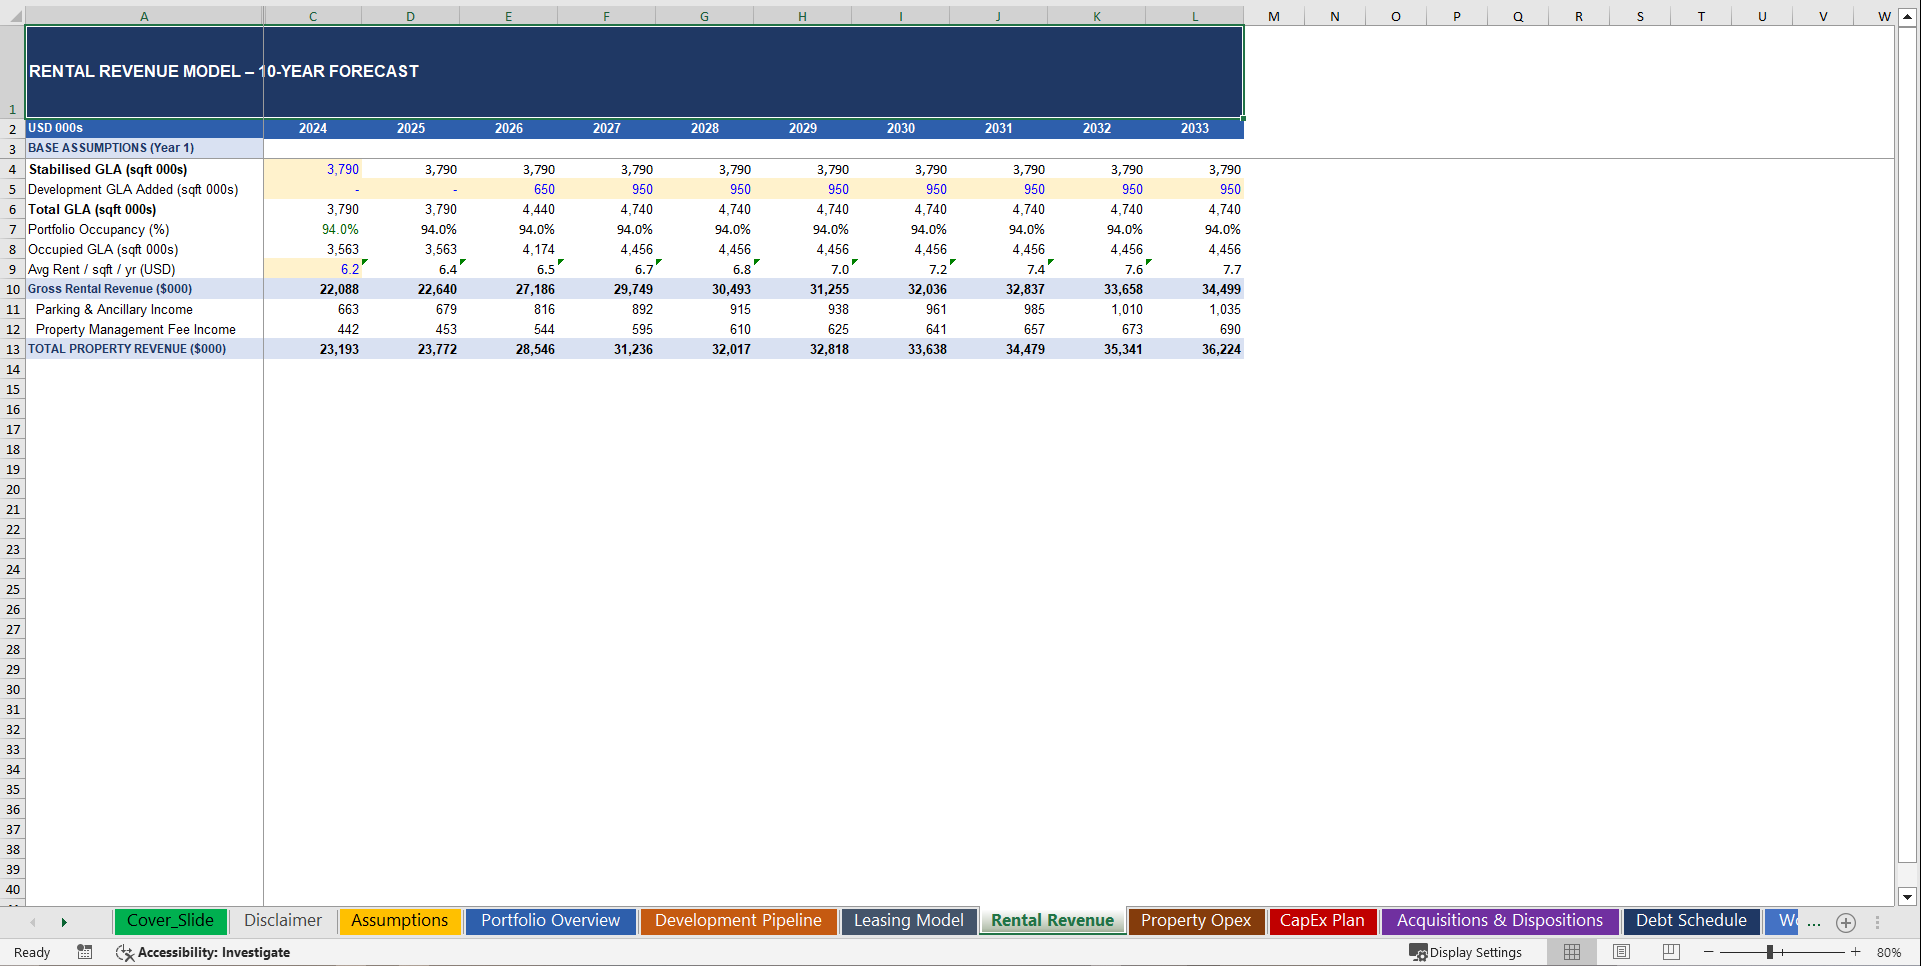
• 📊 Rent & Occupancy Model with Lease Escalation – Gross Leasable Area modeled by stabilised portfolio and development additions – occupancy rate tracked as a standalone lever – annual rent escalations of 2–3% compounded per period – effective rent per sqft realised computed separately from headline asking rate – revenue per occupied sqft and portfolio NOI per sqft calculated for every period across all 10 years
• 👥 Lease Rollover & Tenant Retention Engine – Lease expiry schedule with gross GLA rolling per year, annual renewal probability applied per period, re-leasing spread modeled separately from renewal spread, and void downtime between tenants modeled explicitly – success fee and performance rent structures layered on top – recurring income percentage and retainer-equivalent retainer revenue as a share of total portfolio income tracked as stability metrics – the exact lease rollover intelligence every REIT analyst, PE real estate buyer, and senior lender interrogates on page one of their underwriting checklist
• 🔩 7-Component Property Operating Expense Engine – Property Management, Maintenance & Repairs, Utilities, Insurance, Property Taxes, Security & Landscaping, and Other OpEx – each with individual revenue-proportional scaling and inflation sensitivity – plus NOI margin analysis including OpEx as a percentage of rental revenue and cost per occupied sqft – every cost component individually modeled and reconciled back to Net Operating Income
• 👤 Development Pipeline with Full Project Cost Stack – Hard Costs (cost per sqft × GLA), Soft Costs (12% of hard costs), Contingency (5%), Developer Fee (3%) – compounding annually at a configurable construction cost inflation rate – plus Land Acquisition Cost as a percentage of Total Project Cost, construction loan interest reserve, development timeline from land close through stabilisation – Total Development Cost, Stabilised Value, Development Yield, Development Profit, and IRR computed for every project in the pipeline
• 🔬 Development Yield & Return Analytics – Development Yield (Stabilised NOI ÷ Total Project Cost) tracked for every project and blended across the pipeline – target range 6%–9% benchmarked against industrial sector comps – Loan-to-Cost on construction financing, interest carry during construction, and lease-up period economics fully modeled – the exact development return metrics that institutional equity partners, construction lenders, and REPE fund managers benchmark against logistics sector underwriting standards
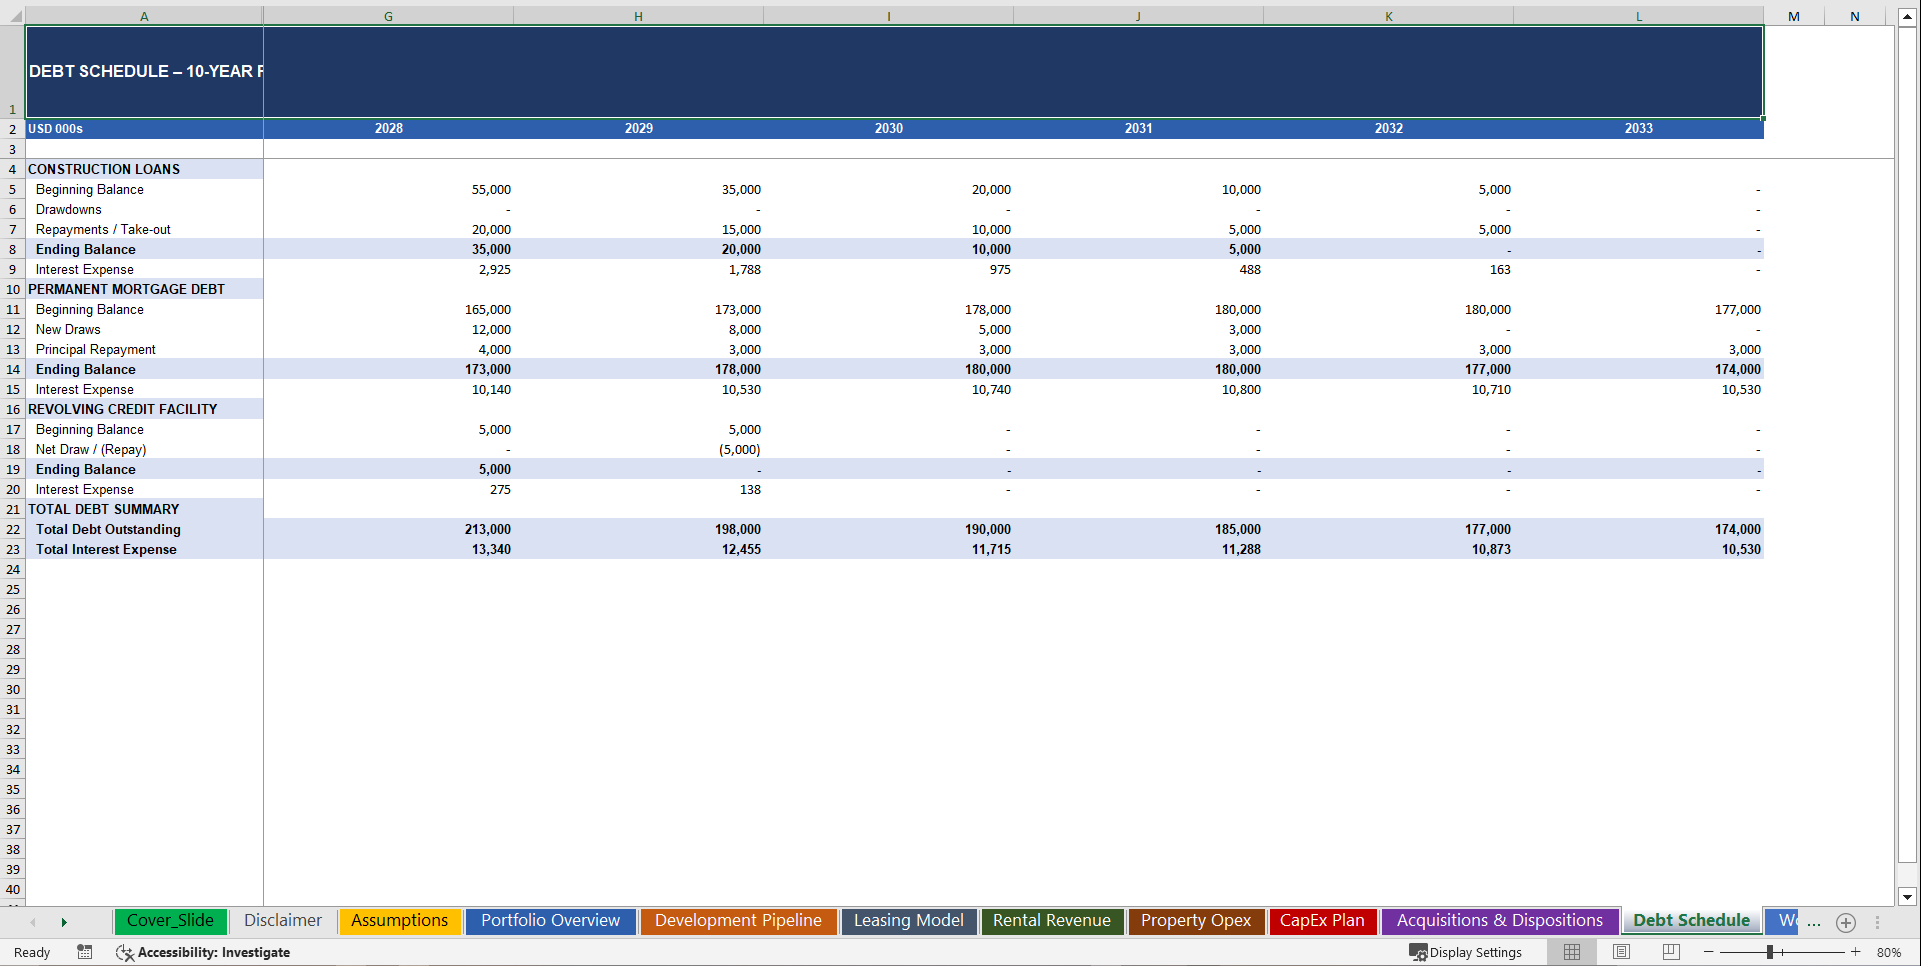
• 🏦 3-Tranche Real Estate Capital Stack – Construction Loans modeled with configurable Loan-to-Cost, floating interest rate, draw schedule, and take-out trigger – Permanent Mortgage Debt modeled with configurable Loan-to-Value, fixed rate, amortisation schedule, and maturity – Revolving Credit Facility modeled with configurable capacity, draw/repayment schedule, and spread – interest expense flowing directly into the Income Statement – closing debt balances feeding the Balance Sheet – Net Debt, LTV, LTC, DSCR, and Net Debt / EBITDA calculated for every period of the forecast
• 📦 Working Capital & Tenant Receivables Model – Accounts Receivable sized by configurable Days Sales Outstanding on rental income – Accounts Payable sized by configurable Days Payable Outstanding on operating expenses – Accrued Expenses sized as a percentage of total opex – Prepaid Expenses as a percentage of revenue – Net Working Capital and Change in NWC fully linked into the Cash Flow Statement – DSO actual, DPO actual, NWC as a percentage of revenue, and Cash Conversion Cycle tracked as efficiency metrics
• 📊 3-Table Sensitivity & Scenario Engine – Year 5 NOI sensitivity matrix across Rent Growth vs. Occupancy Rate (25 scenario intersections, heat-map color-coded) – Portfolio Value sensitivity matrix across NOI Change vs. Exit Cap Rate (49 scenario intersections) – Development Yield sensitivity matrix across Build Cost per sqft vs. Interest Rate (49 scenario intersections) – plus a full 10-year scenario comparison table across Base Case / High Growth / Slow Leasing / Construction Cost Inflation / Economic Downturn / Aggressive Acquisition – giving you instant stress-test answers across 3 independent risk dimensions without touching a single formula
📤 Outputs
• 📈 10-Year Fully Integrated 3-Statement Financial Model – Income Statement, Balance Sheet, and Cash Flow Statement fully cross-linked and auto-balancing across all 10 annual periods – every line item formula-driven, zero hardcoded numbers outside the Assumptions tab – Balance Sheet confirmed balanced with a live reconciliation check for every year
• 🎯 4-Category Revenue Waterfall with Sub-Line Transparency – Annual projections for Rental Income, Parking & Ancillary Income, Property Management Fee Income, Development Profits, and Gains on Asset Sales – with year-over-year growth rates, revenue mix percentages, recurring income percentage, NOI per sqft, effective rent per occupied sqft, and total revenue per sqft of GLA computed for every year of the 10-year forecast
• 📋 NOI & Leasing Intelligence – Blended portfolio occupancy, portfolio NOI, NOI margin, portfolio cap rate, and development yield tracked annually – occupancy as the primary NOI lever fully isolated from rent growth – the exact operating metrics every industrial REIT analyst, REPE operating partner, and logistics asset acquirer uses to benchmark delivery efficiency
• 🔩 Property OpEx Waterfall – Property management, maintenance, utilities, insurance, property taxes, and security – Total Property OpEx reconciled back to NOI with blended NOI Margin % for every period – gross margin analysis including OpEx-to-revenue ratio and cost per sqft computed as portfolio efficiency metrics
• 🔬 Development Project Cost Schedule – 4 active development projects with individual hard cost, soft cost, contingency, developer fee, and land cost build-ups – Total Development Cost, Stabilised Value, Development Yield, Development Profit, and estimated IRR computed per project – pipeline totals reconciled and flowing into CapEx and Balance Sheet Construction-in-Progress
• 🏭 Industrial Real Estate Unit Economics – NOI per sqft, rent per occupied sqft, occupancy rate, development yield, cap rate compression/expansion, WALT, re-leasing spread, TI allowance per sqft, leasing commission as a percentage of rent – industrial sector NOI margin and EBITDA margin benchmarks built into the model structure – so every efficiency gain in your leasing and development engine is visible, defensible, and benchmarkable against Prologis-style logistics sector comps
• 💼 CapEx & Asset Value Schedule – Routine maintenance CapEx (1.5% of portfolio value), Tenant Improvements (per sqft), Leasing Commissions (% of first year rent), Roof & Structure Replacements, Development Spend, and Land Acquisitions – Total CapEx and CapEx as a percentage of portfolio value for every year, Construction-in-Progress balance, and Total Investing Cash Outflow fully linked to the Cash Flow Statement
• 📦 Working Capital Schedules – Tenant Receivables, Prepaid Expenses, Accounts Payable, Accrued Expenses, Net Working Capital, and Change in NWC fully linked to the Cash Flow Statement – DSO actual, DPO actual, NWC as a percentage of revenue, and Cash Conversion Cycle computed annually – Current Ratio, LTV, DSCR, Net Debt, Net Debt / EBITDA, Return on Equity, and Return on Assets tracked as balance sheet health metrics
• 🔄 Cash Flow Statement – Full Indirect Method – Net Income, D&A add-back, individual working capital movement lines, CapEx, development spend, asset acquisitions, asset sale proceeds, debt drawdowns, debt repayments, equity contributions – Free Cash Flow, FCF Margin %, FFO, AFFO, and Closing Cash reconciled to Balance Sheet cash for every year
• 📐 Executive Dashboard with 4 Live Charts & 10 KPI Cards – Portfolio GAV & NOI combo bar/line chart, Rental Revenue & FFO trend line chart, Debt vs. Equity stacked bar chart, and Portfolio Occupancy Rate trend line – plus KPI cards covering Portfolio GAV, Net Asset Value, NOI, Portfolio Occupancy, Cash Balance, Total GLA, Portfolio Cap Rate, LTV Ratio, DSCR, and FFO – all auto-updating from a single Assumptions tab
🏆 Why This Model Stands Out
✅ Fully integrated – every sheet talks to every other sheet. Change one assumption and 1,780+ formulas update instantly across all 17 tabs
✅ Investor and lender-ready – structured and formatted to answer the exact questions REPE acquirers, institutional co-investors, construction lenders, permanent debt providers, and REIT analysts ask on day one of an industrial real estate diligence process: What is the development yield? What is portfolio NOI? What is the LTV on the permanent stack? What is the DSCR? What does portfolio value look like under a 50bps cap rate expansion? When does the development pipeline generate meaningful stabilised cash flow?
✅ Industrial real estate industry realistic – built around how logistics developers, warehouse operators, and distribution park sponsors actually generate and protect value: NOI compounding through rent escalation and occupancy improvement offset by lease rollover risk, development yield protecting against margin compression as construction costs inflate, retainer-equivalent stabilised income building as the leased portfolio deepens, disposition profits diversifying cash flow beyond recurring rental income – not generic assumptions recycled from a corporate finance template
✅ Institutional color-coding throughout – blue inputs, black formulas, green cross-sheet links – Financial Modeling World Cup color conventions used throughout, so any investor, lender, operator, or acquirer can open it and immediately understand the logic, trace every number to its source, and audit every formula without a guide
✅ Fully dynamic and scalable – all 50+ assumptions centralized on a single Assumptions tab. Adjust rent growth, occupancy targets, development pipeline, construction costs, exit cap rates, capital stack leverage, DSO, and tax rate from one place and watch 17 tabs reprice instantly – built for the CFO who needs to run 6 scenarios before a Monday investment committee meeting
✅ Fully unlocked – no protected sheets, no black-box formulas, no hidden logic. Every assumption is visible. Every formula is auditable. Present it to any REPE firm, institutional equity partner, construction lender, permanent debt provider, or investment committee with complete confidence
📋 Model Structure – 17 Sheets
• Executive Dashboard – 4 live charts + 10 KPI cards covering all key portfolio value, NOI, occupancy, leverage, and cash metrics, auto-updating from a single Assumptions tab
• Assumptions – Every input centralized: 50+ individually configurable drivers covering rent growth, occupancy, cap rates, construction costs, development timelines, capital stack terms, operating expense ratios, working capital days, tax rate, and 6-scenario toggles – all blue-coded for instant editing
• Portfolio Overview – 10-asset register with live NOI, cap rate, WALT, and occupancy calculations across Stabilised, Development, Land Bank, and Disposition categories
• Development Pipeline – 4 active projects with individual hard cost, soft cost, contingency, developer fee, and land cost build-ups – Development Yield, Profit, and IRR computed per project
• Leasing Model – Lease expiry rollover schedule, renewal rates, void periods, TI and leasing commission costs, re-leasing spreads, and net effective rent change tracked annually
• Rental Revenue – GLA × rent × occupancy model with annual escalations, development GLA additions, and total portfolio revenue build-up for every annual period
• Property OpEx – 7-component expense model flowing directly to NOI with OpEx-to-revenue ratio and NOI margin computed for every year
• CapEx Plan – Maintenance CapEx, TI allowance, leasing commissions, development spend, and land acquisitions with total investing cash outflow linked to the Cash Flow Statement
• Acquisitions & Dispositions – Acquisition pipeline with purchase price and closing costs, disposition pipeline with sale proceeds, book value, and gain on sale flowing into the Income Statement
• Debt Schedule – Construction loans, permanent mortgage debt, and revolving credit facility – each with opening balance, drawdowns, repayments, interest expense, and closing balance linked to the Balance Sheet
• Working Capital – DSO-driven receivables, DPO-driven payables, accrued expenses, NWC, Change in NWC, and Cash Conversion Cycle fully linked to the Cash Flow Statement
• Income Statement – Rental income through Net Income with full revenue waterfall, Property OpEx, NOI, corporate G&A, EBITDA, depreciation, EBIT, interest, taxes, FFO, and AFFO – all key margin percentages for every period
• Balance Sheet – Full asset, liability, and equity stack with auto-balancing reconciliation check + leverage ratios including LTV, DSCR, Net Debt / EBITDA, ROE, and ROA – confirming financial integrity across all 10 annual periods
• Cash Flow Statement – Full indirect method with individual working capital movements, development CapEx, asset acquisitions, disposition proceeds, debt drawdowns, equity contributions, FCF, FFO, AFFO, and closing cash reconciled to the Balance Sheet
• RE Metrics – Portfolio valuation, NOI metrics, debt metrics, and return metrics including NAV, Cap Rate, LTV, DSCR, Equity Multiple, FFO Yield, and WALT tracked across all 10 years
• Sensitivity Analysis – 3 independent stress-test tables across NOI, Portfolio Value, and Development Yield – 100+ instant scenario data points color-coded for at-a-glance risk assessment
• Scenario Analysis – Full 10-year output comparison across Base Case / High Growth / Slow Leasing / Construction Cost Inflation / Economic Downturn / Aggressive Acquisition – every key metric repriced under every scenario in a single side-by-side view
Key Words:
Strategy & Transformation, Growth Strategy, Strategic Planning, Strategy Frameworks, Innovation Management, Pricing Strategy, Core Competencies, Strategy Development, Business Transformation, Marketing Plan Development, Product Strategy, Breakout Strategy, Competitive Advantage, Mission, Vision, Values, Strategy Deployment & Execution, Innovation, Vision Statement, Core Competencies Analysis, Corporate Strategy, Product Launch Strategy, BMI, Blue Ocean Strategy, Breakthrough Strategy, Business Model Innovation, Business Strategy Example, Corporate Transformation, Critical Success Factors, Customer Segmentation, Customer Value Proposition, Distinctive Capabilities, Enterprise Performance Management, KPI, Key Performance Indicators, Market Analysis, Market Entry Example, Market Entry Plan, Market Intelligence, Market Research, Market Segmentation, Market Sizing, Marketing, Michael Porter's Value Chain, Organizational Transformation, Performance Management, Performance Measurement, Platform Strategy, Product Go-to-Market Strategy, Reorganization, Restructuring, SWOT, SWOT Analysis, Service 4.0, Service Strategy, Service Transformation, Strategic Analysis, Strategic Plan Example, Strategy Deployment, Strategy Execution, Strategy Frameworks Compilation, Strategy Methodologies, Strategy Report Example, Value Chain, Value Chain Analysis, Value Innovation, Value Proposition, Vision Statement, Corporate Strategy, Business Development, Business plan pdf, business plan, PDF, Business Plan DOC, Business Plan Template, PPT, Market strategy playbook, strategic market planning, competitive analysis tools, market segmentation frameworks, growth strategy templates, product positioning strategy, market execution toolkit, strategic alignment playbook, KPI and OKR frameworks, business growth strategy guide, cross-functional strategy templates, market risk management, market strategy PowerPoint doc, guide, ebook, e-book ,McKinsey Change Playbook, Organizational change management toolkit, Change management frameworks 2025, Influence model for change, Change leadership strategies, Behavioral change in organizations, Change management PowerPoint templates, Transformational leadership in change, supply chain KPIs, supply chain KPI toolkit, supply chain PowerPoint template, logistics KPIs, procurement KPIs, inventory management KPIs, supply chain performance metrics, manufacturing KPIs, supply chain dashboard, supply chain strategy KPIs, reverse logistics KPIs, sustainability KPIs in supply chain, financial supply chain KPIs, warehouse KPIs, digital supply chain KPIs, 1200 KPIs, supply chain scorecard, KPI examples, supply chain templates, Corporate Finance SOPs, Finance SOP Excel Template, CFO Toolkit, Finance Department Procedures, Financial Planning SOPs, Treasury SOPs, Accounts Payable SOPs, Accounts Receivable SOPs, General Ledger SOPs, Accounting Policies Template, Internal Controls SOPs, Finance Process Standardization, Finance Operating Procedures, Finance Department Excel Template, FP&A Process Documentation, Corporate Finance Template, Finance SOP Toolkit, CFO Process Templates, Accounting SOP Package, Tax Compliance SOPs, Financial Risk Management Procedures.
NOTE: Our digital products are sold on an "as is" basis, making returns and refunds unavailable post-download. Please preview and inquire before purchasing. Please contact us before purchasing if you have any questions! This policy aligns with the standard Flevy Terms of Usage.
Got a question about the product? Email us at support@flevy.com or ask the author directly by using the "Ask the Author a Question" form. If you cannot view the preview above this document description, go here to view the large preview instead.
Source: Best Practices in Real Estate, Integrated Financial Model Excel: Industrial Real Estate Developer 10-Year Financial Model Excel (XLSX) Spreadsheet, SB Consulting
ABOUT THE AUTHOR
SB Consulting is dedicated to empowering businesses to communicate their ideas with impact. This consulting firm specializes in teaching organizations how to create effective corporate and management presentations. With training from top-tier global consulting firms, including McKinsey, BCG, and Porsche Consulting, extensive expertise in presentation design and ... [read more]
Ask the Author a Question
You must be logged in to contact the author.
