
Hotel 10-Year 3 Statement Financial Model – Excel XLSX
Excel (XLSX)
BENEFITS OF THIS DOWNLOADABLE EXCEL DOCUMENT
- Here are 3 sentences in that style: "Provides a fully integrated 3-statement financial framework for underwriting hotel acquisitions, developments, and operational planning across a 10-year forecast horizon.
- Delivers a complete hotel revenue model built from room-level operating drivers -- occupancy, ADR, and room type segmentation -- feeding directly into departmental profit and investor-ready financial statements.
- Enables hospitality CFOs, developers, and real estate investors to stress-test financial outcomes across five defined scenarios with a dynamically balancing Balance Sheet and live executive dashboard.
HOTEL INDUSTRY EXCEL DESCRIPTION
Curated by McKinsey-trained Executives
🏨 Hotel Financial Model Excel Template – Fully Integrated 3-Statement Pro Forma for Hotel Investments
The Complete Financial Projection System for Hotel Developers, Asset Managers, Hospitality CFOs & Real Estate Investors
Stop building hotel projections in disconnected spreadsheets.
Stop presenting lenders and equity partners with occupancy assumptions that have no balance sheet logic.
Stop guessing how RevPAR growth, CapEx cycles, and debt service actually connect to your bottom line.
If you are developing, acquiring, or operating a hotel asset, your financial model is not "just a forecast."
It is your:
• Acquisition underwriting foundation
• Lender and equity pitch justification
• Debt service coverage proof
• Capital planning and renovation engine
• Asset management performance dashboard
• Investor credibility and exit strategy tool
This Excel model is a fully integrated hotel financial projection system – built with real hospitality revenue logic, real departmental cost structure, and a complete 3-statement framework purpose-built for the hotel industry.
No fluff. No inflated features. Just what is actually inside the file.
💼 What You Get Inside the Excel File
✅ Executive Dashboard with Hotel KPIs and Charts
✅ Centralized Assumptions Sheet (Single Source of Truth)
✅ Occupancy & Revenue Model (Room Type Segmentation + Ancillary Stack)
✅ Departmental Cost Schedule (Rooms, F&B, Spa, Ancillary)
✅ Operating Expense Forecast (Labor by Role, S&M, G&A, Property Ops)
✅ CapEx & Depreciation Schedule (3-Class Straight-Line)
✅ Debt Amortization Schedule with DSCR
✅ Working Capital Schedule (DSO / DIO / DPO)
✅ Fully Integrated Income Statement
✅ Cash Flow Statement (Indirect Method)
✅ Balance Sheet (Dynamically Balancing with Balance Check)
✅ Sensitivity & Scenario Analysis
✅ 10-Year Annual Forecast
✅ Fully Linked, Formula-Driven Excel Architecture – Zero Hardcoded Numbers Outside Assumptions
Everything connects. Everything updates dynamically.
📊 What's Inside – Sheet by Sheet Breakdown
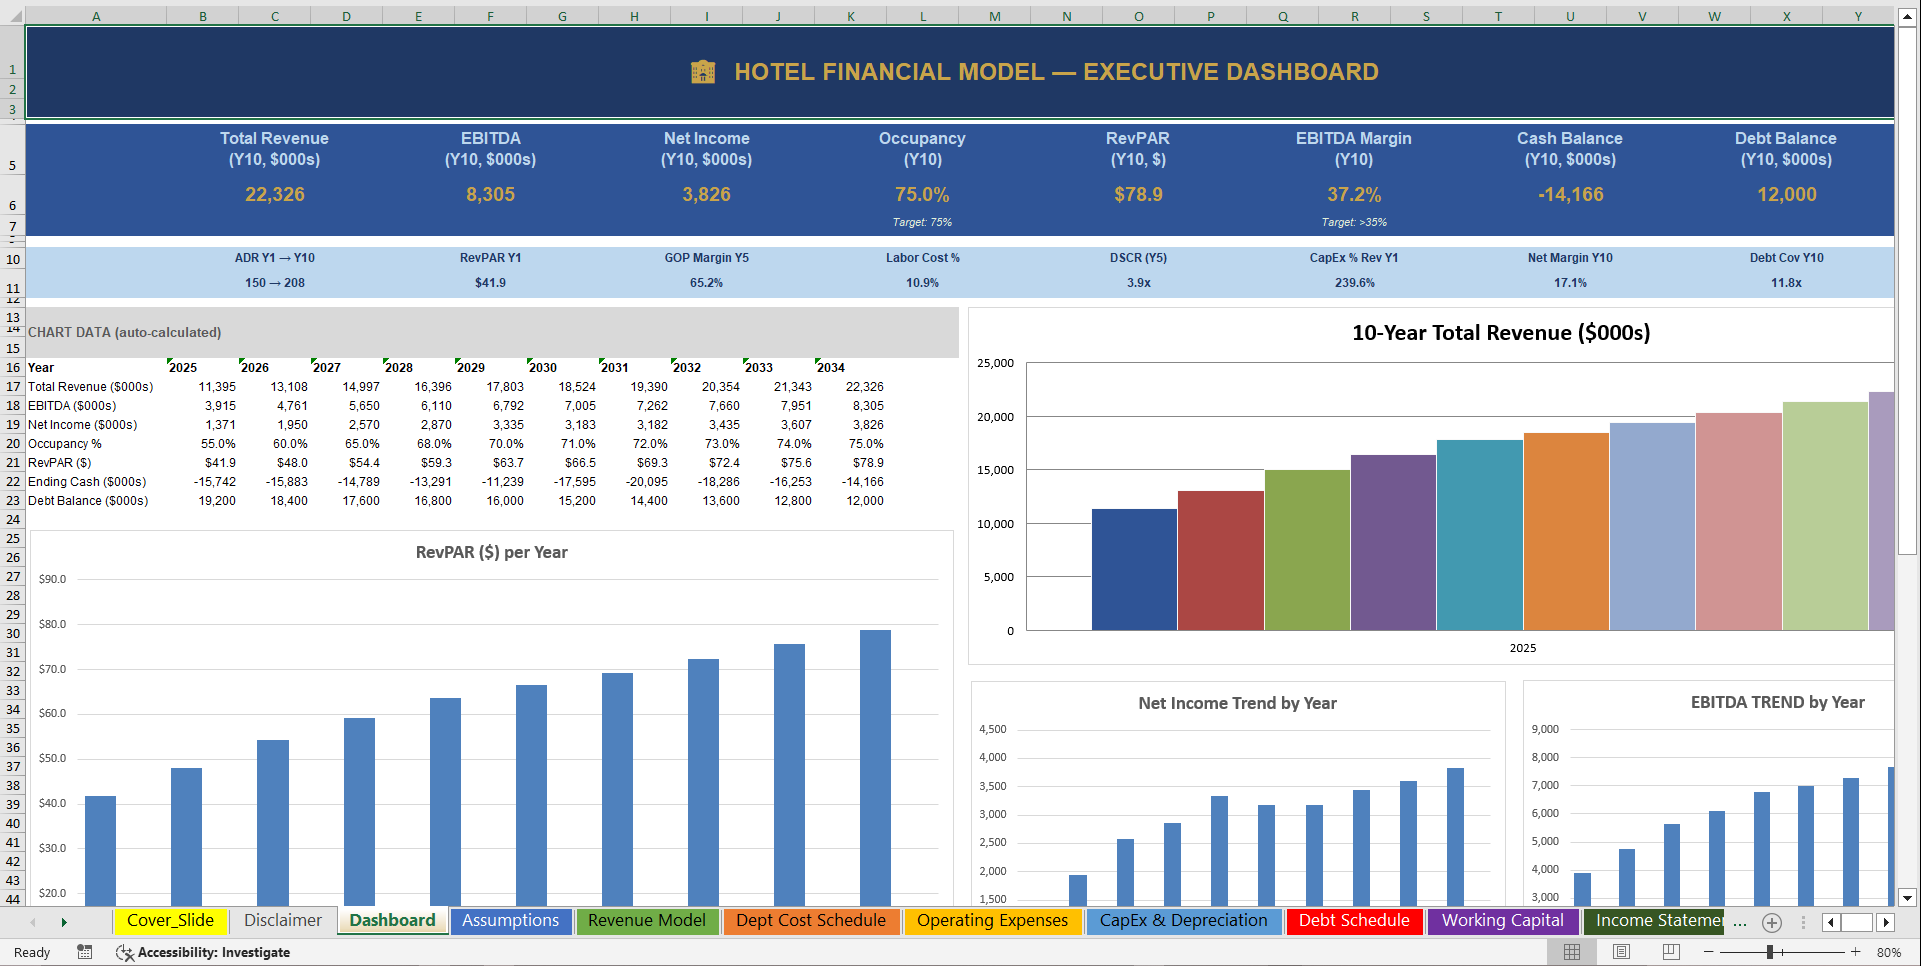
1️⃣ Executive Dashboard
Built for investor presentations, lender packages, and asset management reviews.
Eight primary KPI cards display Year 10 outputs:
• Total Revenue
• EBITDA
• Net Income
• Occupancy Rate
• RevPAR
• EBITDA Margin
• Cash Balance
• Debt Balance
Eight secondary metric cards display:
• ADR range (Year 1 to Year 10)
• RevPAR Year 1
• GOP Margin Year 5
• Labor Cost as % of Revenue
• DSCR Year 5
• CapEx as % of Revenue Year 1
• Net Margin Year 10
• Interest Coverage Year 10
Six embedded charts pull live from the model:
• 10-Year Total Revenue (bar chart)
• EBITDA Trend
• Net Income Trend
• Occupancy Rate Trend
• RevPAR Trend
• Ending Cash Balance Trend
This is the visual command center of the entire system – designed to open in front of a capital partner and communicate the full financial story instantly.
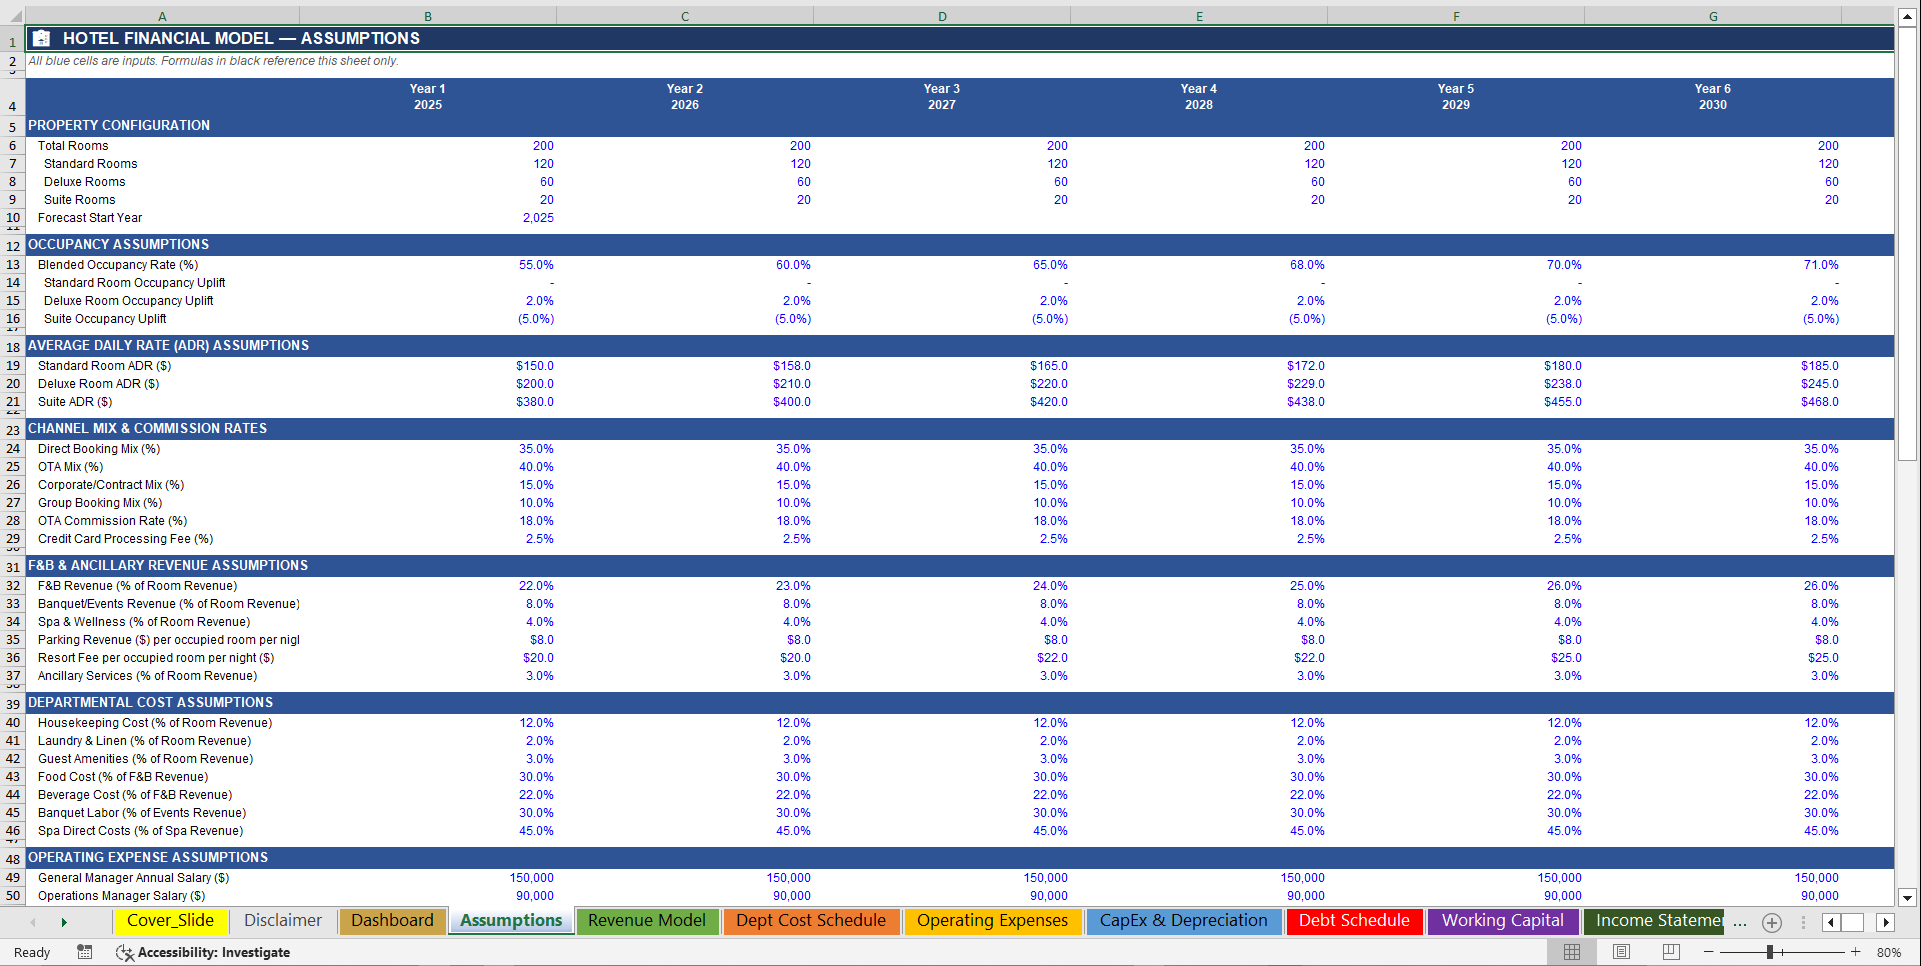
2️⃣ Assumptions Sheet (Single Source of Truth)
Every driver in the model flows from one centralized assumptions tab. No numbers are hardcoded anywhere else in the model.
Organized into eight structured sections:
Property Configuration:
• Total rooms (200 modeled)
• Room mix: Standard (120), Deluxe (60), Suite (20)
• Forecast start year
Occupancy Assumptions:
• Blended occupancy rate by year (55% in Year 1 ramping to 75% in Year 10)
• Occupancy uplift by room type (Deluxe and Suite adjustments)
ADR Assumptions:
• Standard Room ADR ($150 in Year 1 to $208 in Year 10)
• Deluxe Room ADR ($200 to $275)
• Suite ADR ($380 to $526)
Channel Mix & Commission Rates:
• Direct booking mix (35%)
• OTA mix (40%)
• Corporate/Contract mix (15%)
• Group booking mix (10%)
• OTA commission rate (18%)
• Credit card processing fee (2.5%)
F&B & Ancillary Revenue Drivers:
• F&B revenue as % of Room Revenue (22% to 28%)
• Banquet & Events as % of Room Revenue (8%)
• Spa & Wellness as % of Room Revenue (4%)
• Parking revenue per occupied room night ($8)
• Resort fee per occupied room night ($20 escalating to $30)
• Ancillary services as % of Room Revenue (3%)
Departmental Cost Rates:
• Housekeeping labor, laundry, guest amenities (% of Room Revenue)
• Food cost, beverage cost, kitchen labor (% of F&B Revenue)
• Banquet labor (% of Events Revenue)
• Spa direct costs (% of Spa Revenue)
Labor Model (Role by Role):
• General Manager, Operations Manager, Revenue Manager base salaries
• Front Desk FTEs and average salary
• Maintenance FTEs and average salary
• Sales Team FTEs and average salary
• Administrative FTEs and average salary
• Annual salary raise rate (3%)
• Payroll taxes and benefits loading (20% of salary)
Fixed & Semi-Fixed Operating Costs:
• Advertising and brand spend
• OTA marketing spend
• Legal and insurance
• IT systems
• Property taxes
• Fixed and variable utilities
• Repairs and maintenance budget
• Replacement reserve (% of Revenue)
• Management fee (% of Revenue)
CapEx Inputs:
• Building and construction CapEx by year ($25M Year 1, $8M renovation in Year 6)
• FF&E by year ($2M Year 1, $1.5M renovation year)
• Technology by year ($300K Year 1, refresh in renovation year)
Debt & Financing:
• Initial loan amount ($20M)
• Interest rate (5.5%)
• Loan term (25 years)
• Annual principal repayment ($800K)
• Equity contributions ($10M Year 1)
• Dividend payout policy (0% Years 1–5, scaling to 40% by Year 10)
Financial & Tax:
• Corporate tax rate (25%)
• Inflation rate (3%)
• WACC / Discount rate (10%)
Seasonality Reference Table:
• Monthly occupancy index factors (January through December)
• Monthly ADR index factors (January through December)
• Provided as reference inputs for operator planning use
Change one input – the entire 10-year model recalculates automatically.
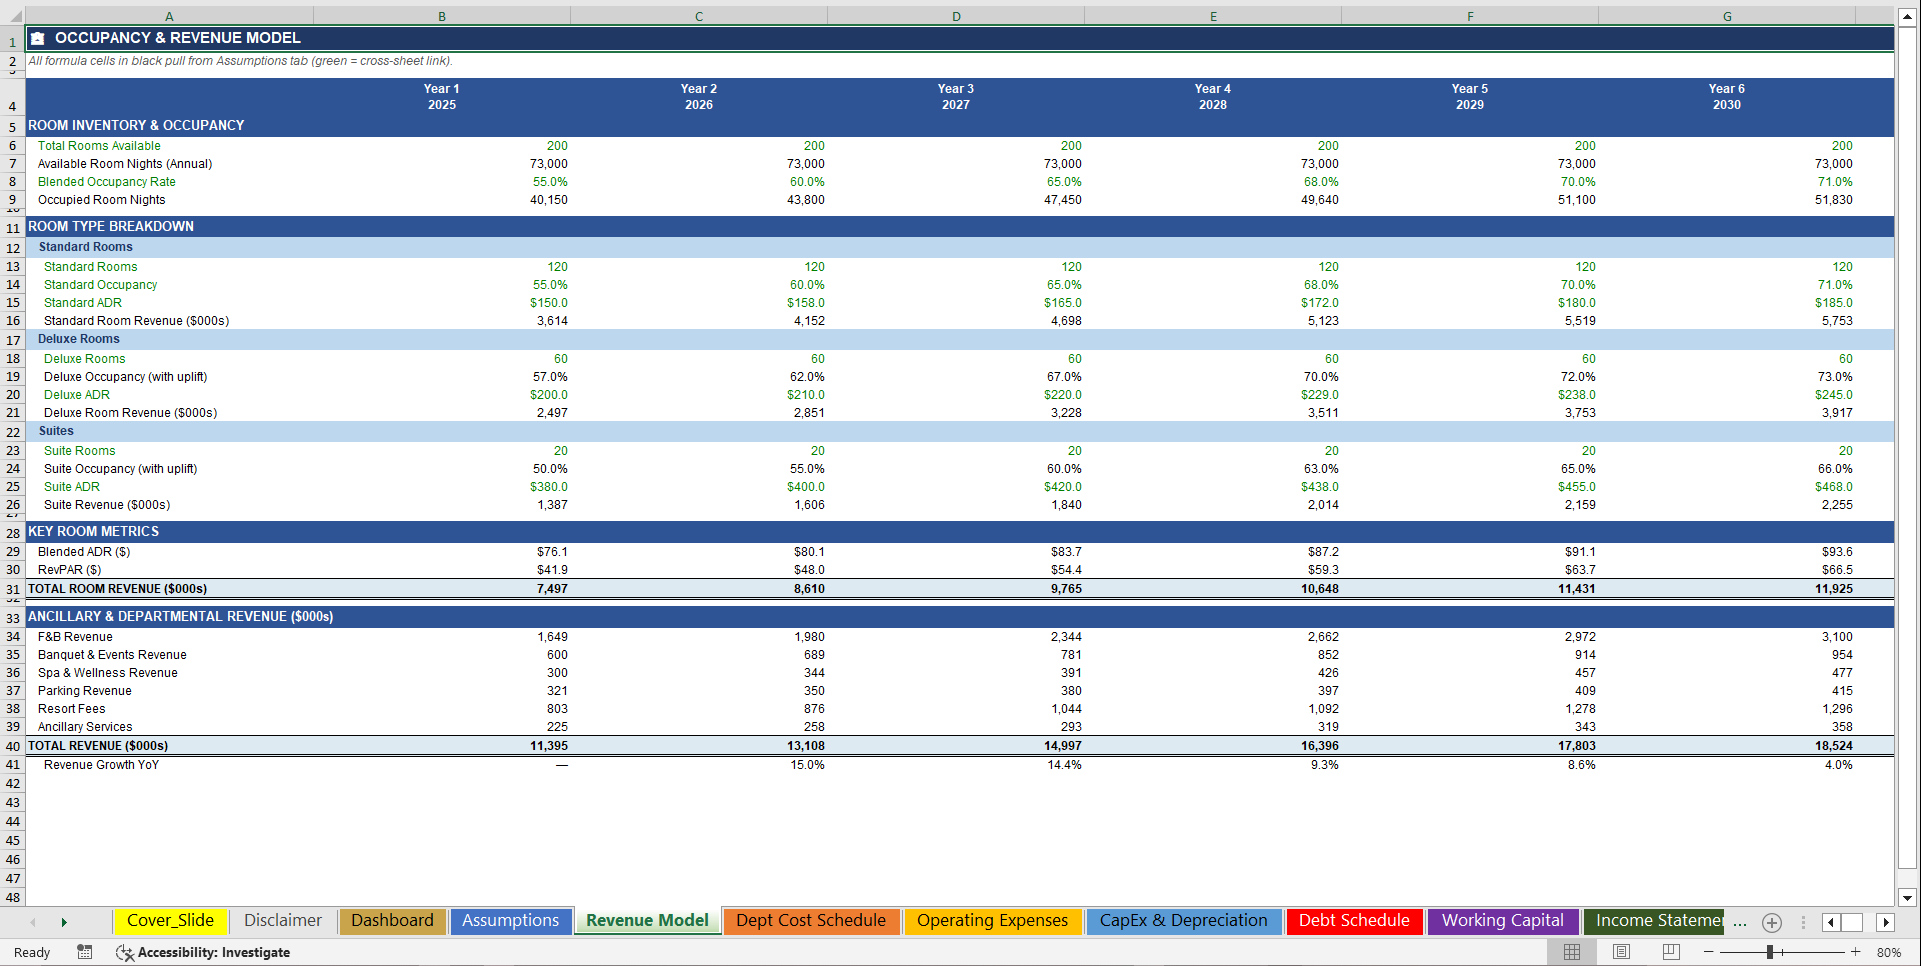
3️⃣ Occupancy & Revenue Model
Revenue is built entirely from hotel operating drivers – not flat percentage growth assumptions.
Room Inventory Mechanics:
• Available Room Nights = Total Rooms × 365
• Occupied Room Nights = Available Room Nights × Occupancy Rate
• Blended ADR derived from room-type weighted calculation
• RevPAR = Blended ADR × Occupancy Rate
Room Type Revenue (calculated separately for each class):
• Standard Room Revenue = Standard Rooms × 365 × Occupancy × Standard ADR
• Deluxe Room Revenue = Deluxe Rooms × 365 × (Occupancy + Uplift) × Deluxe ADR
• Suite Revenue = Suite Rooms × 365 × (Occupancy + Uplift) × Suite ADR
Ancillary Revenue Stack (all formula-driven):
• F&B Revenue – % of Total Room Revenue, scaling annually
• Banquet & Events Revenue – % of Total Room Revenue
• Spa & Wellness Revenue – % of Total Room Revenue
• Parking Revenue – $ per occupied room night × occupied room nights
• Resort Fees – $ per occupied room night × occupied room nights
• Ancillary Services – % of Total Room Revenue
Summary metrics calculated for all 10 years:
• Total Room Revenue
• Total Revenue (all departments)
• Year-over-Year Revenue Growth %
Every revenue line feeds directly into the Income Statement, Cash Flow Statement, and Balance Sheet with zero manual entry.
4️⃣ Departmental Cost Schedule
Hotel gross profit is only meaningful when costs are built by operating department.
Rooms Department Costs:
• Housekeeping labor (% of Room Revenue)
• Laundry and linen (% of Room Revenue)
• Guest amenities and supplies (% of Room Revenue)
• OTA commissions (applied to OTA channel mix share of Room Revenue)
• Credit card processing fees (% of Total Revenue)
F&B Department Costs:
• Food cost (% of F&B Revenue)
• Beverage cost (% of F&B Revenue)
• Kitchen and service staff labor (25% of F&B Revenue)
• Banquet and events labor (% of Events Revenue)
Spa & Other Department Costs:
• Spa direct operating costs (% of Spa Revenue)
• Parking operating costs (20% of Parking Revenue)
• Ancillary service costs (40% of Ancillary Revenue)
Output: Gross Operating Profit (GOP) and GOP Margin % calculated dynamically for all 10 years – the primary profitability benchmark used by hotel investors and operators worldwide.
5️⃣ Operating Expense Forecast
Labor & Payroll – Built Role by Role:
• General Manager salary with annual compounding raises
• Operations Manager salary with annual raises
• Revenue Manager salary with annual raises
• Front Desk team: FTE count × salary × (1 + raise rate)^year
• Maintenance team: FTE count × salary × annual escalation
• Sales team: FTE count × salary × annual escalation
• Administrative team: FTE count × salary × annual escalation
• Payroll taxes and benefits loaded at 20% of total salary base
• FTE headcount grows by year in line with operational scaling
Sales & Marketing:
• Advertising and brand campaigns (hardcoded annual budget, adjustable)
• OTA marketing spend (hardcoded annual budget, adjustable)
General & Administrative:
• Legal and insurance
• IT systems and property management software
• Property taxes (escalating annually)
Property Operations & Maintenance:
• Fixed utilities (annual budget input)
• Variable utilities (% of Total Revenue)
• Repairs and maintenance (annual budget input, escalating)
• Replacement reserve (% of Total Revenue – hotel industry standard)
• Management fee (% of Total Revenue)
All operating expenses feed directly into EBITDA on the Income Statement.
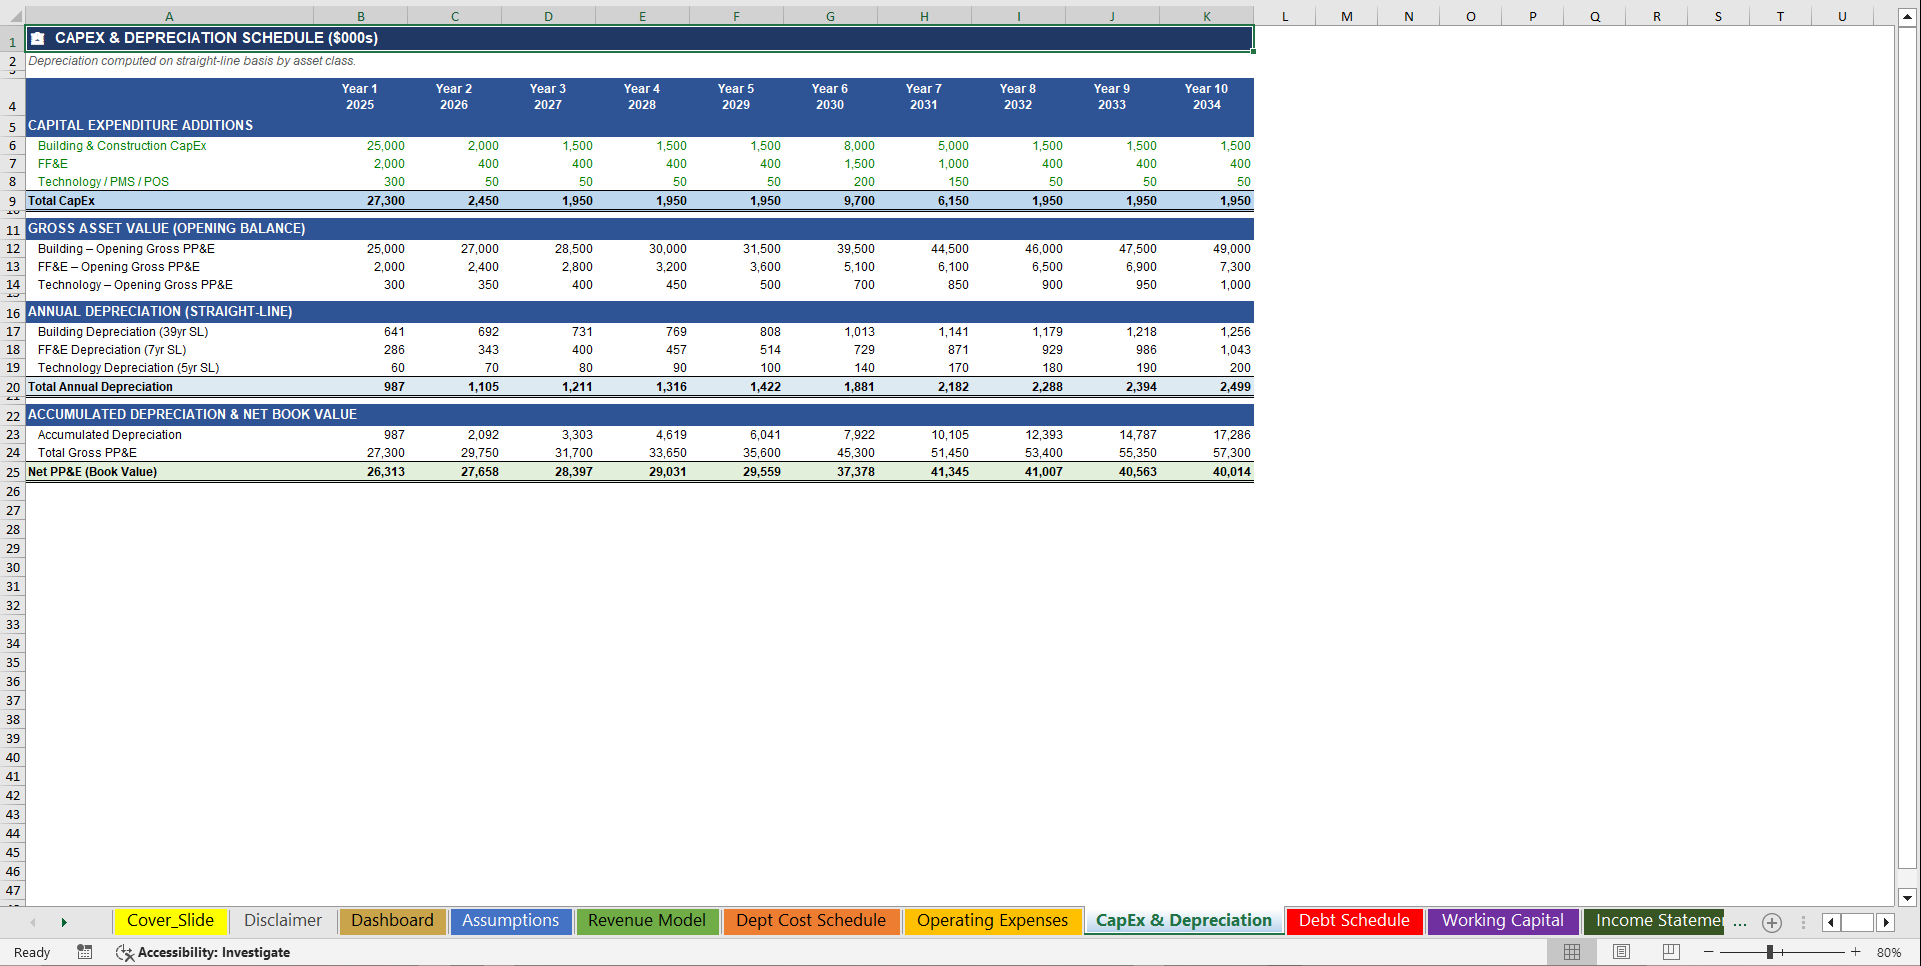
6️⃣ CapEx & Depreciation Schedule
Three asset classes tracked separately with individual depreciation treatment:
• Building & Construction – 39-year straight-line depreciation
• Furniture, Fixtures & Equipment (FF&E) – 7-year straight-line
• Technology / PMS / POS Systems – 5-year straight-line
For each asset class, the schedule tracks:
• Annual CapEx additions
• Gross PP&E roll-forward (cumulative additions year over year)
• Annual depreciation on cumulative gross asset base
• Total accumulated depreciation
• Net PP&E (book value) = Gross PP&E minus Accumulated Depreciation
Modeled capital events:
• Year 1: Initial construction / acquisition ($25M building, $2M FF&E, $300K technology)
• Years 2–4: Annual maintenance CapEx
• Year 6: Major renovation cycle ($8M building, $1.5M FF&E, $200K technology)
• Years 7–10: Return to maintenance CapEx levels
Net PP&E flows directly into the Balance Sheet. Depreciation flows into EBIT and Cash Flow from Operations.
7️⃣ Debt Amortization Schedule
• Opening loan balance ($20M, fully adjustable in Assumptions)
• Annual interest expense = Opening Balance × Interest Rate
• Annual principal repayment (fixed $800K per year, capped at remaining balance)
• Closing loan balance rolls forward year over year
• Current vs. long-term debt split calculated for proper Balance Sheet classification
• Total Debt Service = Principal + Interest, used for DSCR calculation
• Interest expense flows directly into Pre-Tax Income on the Income Statement
• Principal repayment flows into Cash from Financing on the Cash Flow Statement
8️⃣ Working Capital Schedule
Working capital is where most hotel financial models break down entirely. This model handles it with full DSO / DIO / DPO mechanics.
Current Assets tracked:
• Accounts Receivable – Revenue ÷ 365 × DSO (20 days default)
• F&B Inventory – F&B Revenue ÷ 365 × DIO (10 days default)
• Prepaid Expenses – 1% of Total Revenue
Current Liabilities tracked:
• Accounts Payable – Departmental Costs ÷ 365 × DPO (30 days default)
• Accrued Expenses – Total OpEx ÷ 12 (one month accrual)
• Deferred Revenue (advance deposits) – 5% of Total Revenue
Year-over-year changes calculated for Cash Flow integration:
• Change in Accounts Receivable
• Change in Inventory
• Change in Accounts Payable
• Change in Accrued Expenses
• Change in Deferred Revenue
All five working capital change lines feed directly into Cash from Operations, ensuring the cash flow statement reflects real liquidity movement – not just accounting profit.
9️⃣ Income Statement
• Room Revenue, F&B, Events, Spa, Parking and Resort Fees, Ancillary
• Less: Departmental Costs → Gross Operating Profit (GOP)
• GOP Margin % calculated dynamically
• Less: Total Operating Expenses → EBITDA
• EBITDA Margin % calculated dynamically
• Less: Depreciation & Amortization → EBIT
• Less: Interest Expense → Pre-Tax Income (EBT)
• Less: Income Tax (applied only on positive EBT) → Net Income
• Net Margin % calculated dynamically
• Dividends paid (per policy in Assumptions)
• Incremental Retained Earnings (Net Income minus Dividends)
🔟 Cash Flow Statement (Indirect Method)
Cash from Operations:
• Starts with Net Income
• Adds back Depreciation & Amortization
• Adjusts for five working capital line changes (AR, Inventory, AP, Accrued, Deferred Revenue)
Cash from Investing:
• Building and construction CapEx (negative)
• FF&E purchases (negative)
• Technology investments (negative)
Cash from Financing:
• Equity contributions (positive)
• Principal debt repayment (negative)
• Dividends paid (negative)
Reconciliation:
• Net Change in Cash = Operations + Investing + Financing
• Beginning Cash balance rolls from prior year ending balance
• Ending Cash Balance ties directly to Cash on the Balance Sheet
1️⃣1️⃣ Balance Sheet
Assets:
• Cash (from Cash Flow Statement)
• Accounts Receivable (from Working Capital)
• F&B Inventory (from Working Capital)
• Prepaid Expenses (from Working Capital)
• Gross PP&E (from CapEx Schedule)
• Less: Accumulated Depreciation (from CapEx Schedule)
• Net PP&E
Liabilities:
• Accounts Payable (from Working Capital)
• Accrued Expenses (from Working Capital)
• Deferred Revenue (from Working Capital)
• Current Portion of Long-Term Debt (from Debt Schedule)
• Long-Term Debt (from Debt Schedule)
Equity:
• Paid-In Capital – cumulative equity contributions from Assumptions
• Retained Earnings – cumulative Net Income minus cumulative Dividends
Balance check row confirms Assets = Liabilities + Equity for every single year.
If the check shows anything other than zero, a formula linkage error exists somewhere in the model. In the delivered file it reads zero across all 10 years.
1️⃣2️⃣ Sensitivity & Scenario Analysis
Base Case KPI Pull (Year 5 snapshot):
• Total Revenue, EBITDA, Net Income, Occupancy Rate, RevPAR, EBITDA Margin – all live from the model
5-Scenario Comparison (Year 5 EBITDA estimated output):
• Base Case – model as-built
• High Tourism Growth (+5% occupancy, +10% ADR)
• Recession Case (−12% occupancy, −15% ADR)
• Rate Compression Case (flat occupancy, −10% ADR)
• High Inflation Case (−3% occupancy, +5% ADR)
2-Dimensional Sensitivity Table:
• Rows: Occupancy rate adjustments from −10% to +10% (five steps)
• Columns: ADR adjustments from −15% to +15% (seven steps)
• Output: Estimated Year 5 EBITDA at every intersection – 35 data points
💎 What Makes This Model Different
✔ Revenue built from actual hotel operating drivers – rooms × occupancy × ADR by room type – not top-line growth guesses
✔ Three room types (Standard, Deluxe, Suite) with separate ADR tiers and individual occupancy dynamics
✔ Full departmental P&L: Rooms, F&B, Events, Spa, Parking, Ancillary – each with its own cost structure
✔ GOP calculated by department – the metric hotel operators and investors actually use to benchmark performance
✔ Role-by-role labor model with annual raises, FTE headcount scaling, and payroll tax loading
✔ 3-class CapEx and depreciation treatment matching commercial real estate standards (39yr / 7yr / 5yr)
✔ Major renovation cycle in Year 6 fully modeled with capital and depreciation impact
✔ Debt amortization with current vs. long-term split and DSCR calculation
✔ Working capital mechanics with DSO, DIO, and DPO – properly reflected in Cash from Operations
✔ Dynamically balancing Balance Sheet with a built-in zero-check row confirmed across all 10 years
✔ Indirect method Cash Flow Statement with all five working capital adjustments
✔ Executive Dashboard with 16 KPI outputs and 6 live charts
✔ 5-scenario comparison and 35-point 2D sensitivity table
✔ Zero hardcoded numbers outside the Assumptions tab
✔ Zero formula errors across 1,814 linked cells
This is not a basic occupancy calculator with a revenue tab bolted on.
This is a structured hotel investment financial model built to institutional standards.
🎯 Who This Is For
• Hotel developers underwriting new construction or acquisition projects
• Real estate private equity firms evaluating hospitality assets
• Independent hotel owners planning for refinancing or sale
• Hospitality CFOs building lender packages and equity decks
• Asset managers tracking operational performance against underwriting
• Consultants building institutional-grade financial models for hospitality clients
• MBA students and finance professionals learning hotel financial modeling
If you need credible, lender-ready, investor-grade hotel financial projections – this model was built for exactly that purpose.
🧠 What This Model Enables You To Do
With this system, you can:
• Underwrite a hotel acquisition or ground-up development from scratch
• Build a complete lender package with DSCR and debt coverage analysis
• Model RevPAR growth and see the direct impact on EBITDA and cash flow
• Stress-test occupancy and ADR assumptions across five defined scenarios
• Present a dynamically balancing Balance Sheet to equity partners
• Track renovation cycle capital impact on cash position and leverage ratios
• Plan dividend distributions tied to net income policy from Year 6 onward
• Demonstrate financial credibility to institutional capital partners with 16 live KPIs and 6 charts
Instead of guessing how occupancy changes affect your debt coverage – you see it, fully integrated, across 10 years.
🚨 The Cost of Using a Basic Hotel Template
Without a properly structured hotel financial model, you risk:
• Overstating RevPAR-to-EBITDA conversion with no departmental cost logic
• Ignoring working capital and advance deposit dynamics that directly affect cash
• Missing the Balance Sheet entirely – which every lender and equity partner will check
• Presenting DSCR calculations that do not tie to an actual debt amortization schedule
• Underestimating CapEx requirements and renovation reserve needs
• Producing broken statement linkage that falls apart under investor scrutiny
• Losing credibility with lenders, equity partners, or acquirers at the worst possible moment
Institutional capital requires institutional modeling.
⚡ Build Your Hotel Investment on a Real Financial Foundation
If you are serious about:
• Raising debt or equity capital for a hotel asset
• Presenting credible projections to lenders and institutional investors
• Running a 10-year underwriting with full 3-statement integration
• Stress-testing your deal before you commit capital
• Building the complete financial backbone of a real hospitality business
This Hotel Financial Model Excel Template gives you the complete structural foundation to do it correctly – from opening occupancy ramp to stabilized cash flow and beyond.
👉 Download the Hotel Financial Model today – and underwrite your hotel investment with complete financial integration, institutional-grade structure, and full 10-year precision.
Key Words:
Strategy & Transformation, Growth Strategy, Strategic Planning, Strategy Frameworks, Innovation Management, Pricing Strategy, Core Competencies, Strategy Development, Business Transformation, Marketing Plan Development, Product Strategy, Breakout Strategy, Competitive Advantage, Mission, Vision, Values, Strategy Deployment & Execution, Innovation, Vision Statement, Core Competencies Analysis, Corporate Strategy, Product Launch Strategy, BMI, Blue Ocean Strategy, Breakthrough Strategy, Business Model Innovation, Business Strategy Example, Corporate Transformation, Critical Success Factors, Customer Segmentation, Customer Value Proposition, Distinctive Capabilities, Enterprise Performance Management, KPI, Key Performance Indicators, Market Analysis, Market Entry Example, Market Entry Plan, Market Intelligence, Market Research, Market Segmentation, Market Sizing, Marketing, Michael Porter's Value Chain, Organizational Transformation, Performance Management, Performance Measurement, Platform Strategy, Product Go-to-Market Strategy, Reorganization, Restructuring, SWOT, SWOT Analysis, Service 4.0, Service Strategy, Service Transformation, Strategic Analysis, Strategic Plan Example, Strategy Deployment, Strategy Execution, Strategy Frameworks Compilation, Strategy Methodologies, Strategy Report Example, Value Chain, Value Chain Analysis, Value Innovation, Value Proposition, Vision Statement, Corporate Strategy, Business Development, Business plan pdf, business plan, PDF, Business Plan DOC, Business Plan Template, PPT, Market strategy playbook, strategic market planning, competitive analysis tools, market segmentation frameworks, growth strategy templates, product positioning strategy, market execution toolkit, strategic alignment playbook, KPI and OKR frameworks, business growth strategy guide, cross-functional strategy templates, market risk management, market strategy PowerPoint doc, guide, ebook, e-book ,McKinsey Change Playbook, Organizational change management toolkit, Change management frameworks 2025, Influence model for change, Change leadership strategies, Behavioral change in organizations, Change management PowerPoint templates, Transformational leadership in change, supply chain KPIs, supply chain KPI toolkit, supply chain PowerPoint template, logistics KPIs, procurement KPIs, inventory management KPIs, supply chain performance metrics, manufacturing KPIs, supply chain dashboard, supply chain strategy KPIs, reverse logistics KPIs, sustainability KPIs in supply chain, financial supply chain KPIs, warehouse KPIs, digital supply chain KPIs, 1200 KPIs, supply chain scorecard, KPI examples, supply chain templates, Corporate Finance SOPs, Finance SOP Excel Template, CFO Toolkit, Finance Department Procedures, Financial Planning SOPs, Treasury SOPs, Accounts Payable SOPs, Accounts Receivable SOPs, General Ledger SOPs, Accounting Policies Template, Internal Controls SOPs, Finance Process Standardization, Finance Operating Procedures, Finance Department Excel Template, FP&A Process Documentation, Corporate Finance Template, Finance SOP Toolkit, CFO Process Templates, Accounting SOP Package, Tax Compliance SOPs, Financial Risk Management Procedures.
NOTE**: Our digital products are sold on an "as is" basis, making returns and refunds unavailable post-download. Please preview and inquire before purchasing. Please contact us before purchasing if you have any questions! This policy aligns with the standard Flevy Terms of Usage.
Got a question about the product? Email us at support@flevy.com or ask the author directly by using the "Ask the Author a Question" form. If you cannot view the preview above this document description, go here to view the large preview instead.
Source: Best Practices in Hotel Industry, Integrated Financial Model Excel: Hotel 10-Year 3 Statement Financial Model Excel (XLSX) Spreadsheet, SB Consulting
ABOUT THE AUTHOR
SB Consulting is dedicated to empowering businesses to communicate their ideas with impact. This consulting firm specializes in teaching organizations how to create effective corporate and management presentations. With training from top-tier global consulting firms, including McKinsey, BCG, and Porsche Consulting, extensive expertise in presentation design and ... [read more]
Ask the Author a Question
You must be logged in to contact the author.
