
Holding Company 10-Year 3 Statement Financial Model – Excel XLSX
Excel (XLSX)
BENEFITS OF THIS DOWNLOADABLE EXCEL DOCUMENT
- Provides a fully integrated 3-statement financial framework for modeling a holding company with multiple operating subsidiaries and investment assets.
- Delivers a 10-year consolidated forecast covering subsidiary revenue, portfolio returns, acquisitions, debt financing, and capital allocation in one investor-ready model.
- Equips holding company operators, family offices, and private equity teams with the financial infrastructure to plan, fund, and present a diversified multi-entity business with institutional-grade precision.
INTEGRATED FINANCIAL MODEL EXCEL DESCRIPTION
Curated by McKinsey-trained Executives
🏛️ Holding Company Financial Model | 3-Statement 10-Year Forecast
Stop running your holding company on gut instinct. Stop losing LP confidence to weak consolidation reporting. Stop walking into capital allocation meetings without a fully integrated, investor-grade financial infrastructure behind every number.
This is the exact multi-subsidiary financial model family office principals, private equity operators, holding company CFOs, and institutional investors use to consolidate operating businesses, model portfolio returns, plan acquisitions, and present a boardroom-ready 10-year financial picture – built to institutional financial modeling standards, cross-linked across 13 professional tabs.
💡 What's Inside
One model. Every financial dimension of building, funding, and scaling a multi-entity holding company structure – from Year 1 subsidiary ramp through a 10-year path to portfolio maturity, strategic refinancing, or full exit. Five operating businesses. Six investment asset classes. Two modeled acquisitions. Three fully integrated financial statements. All linked. All live. All yours.
📥 Inputs
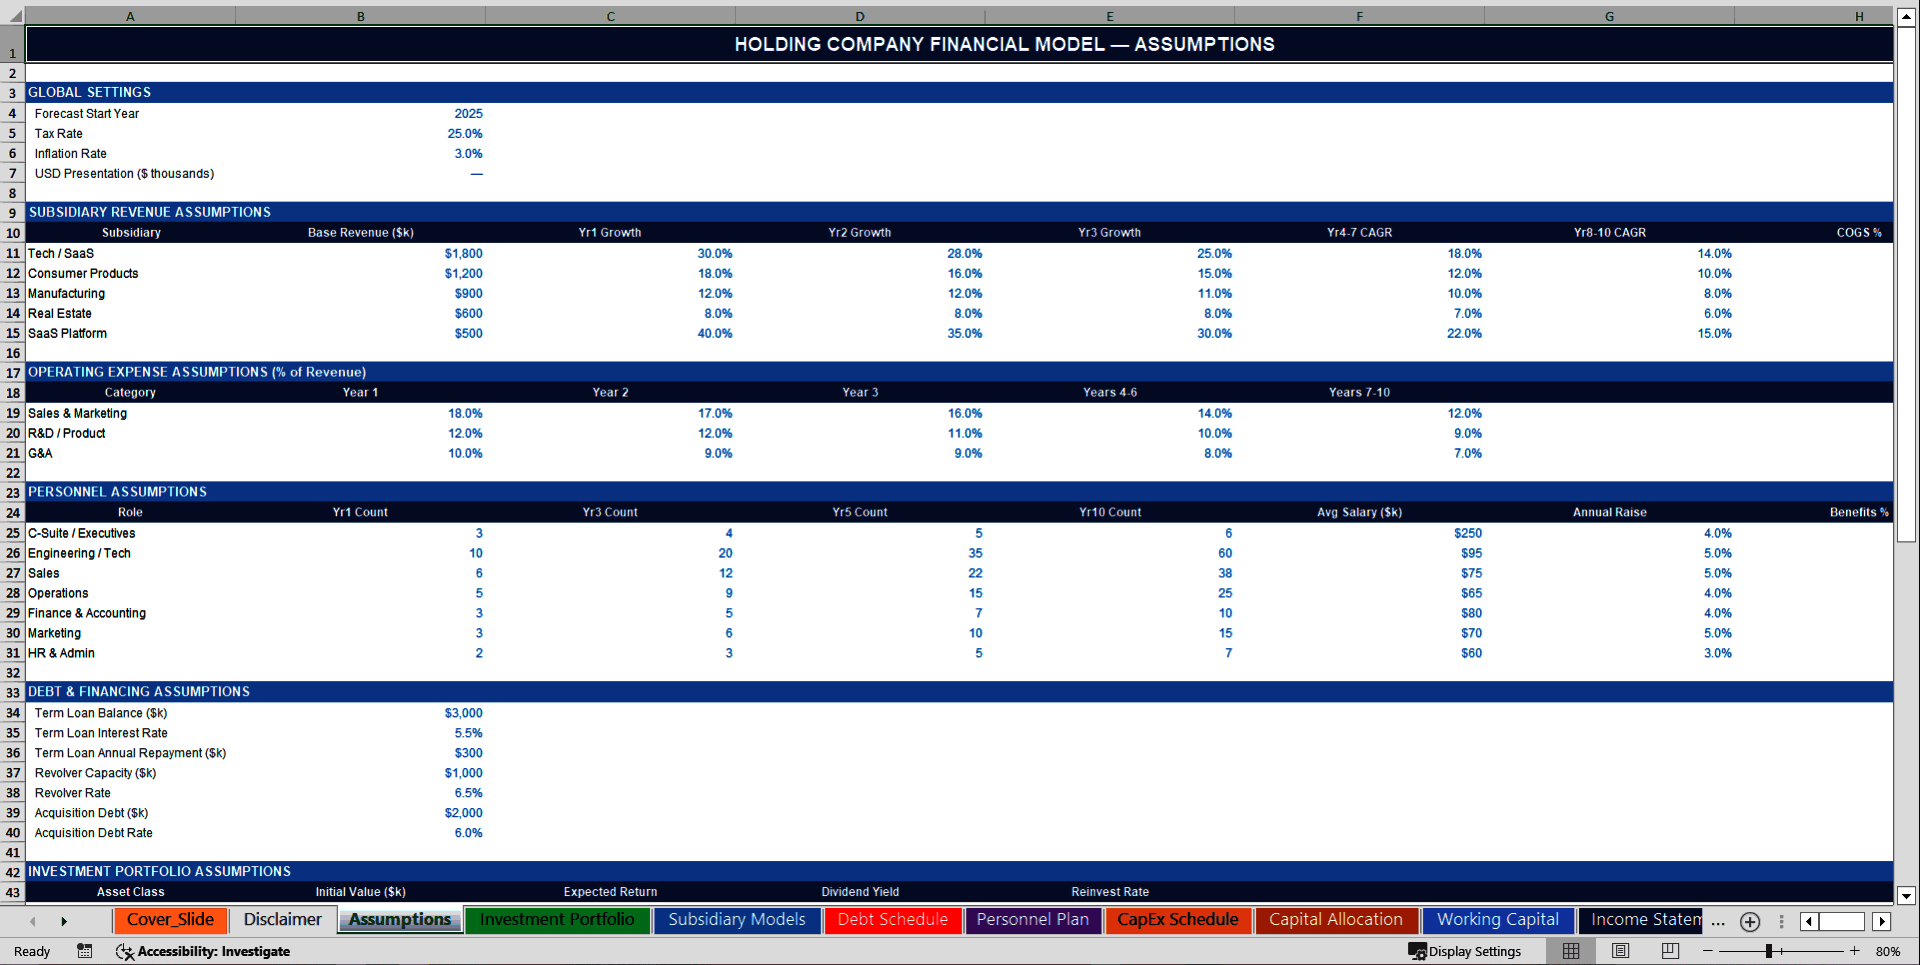
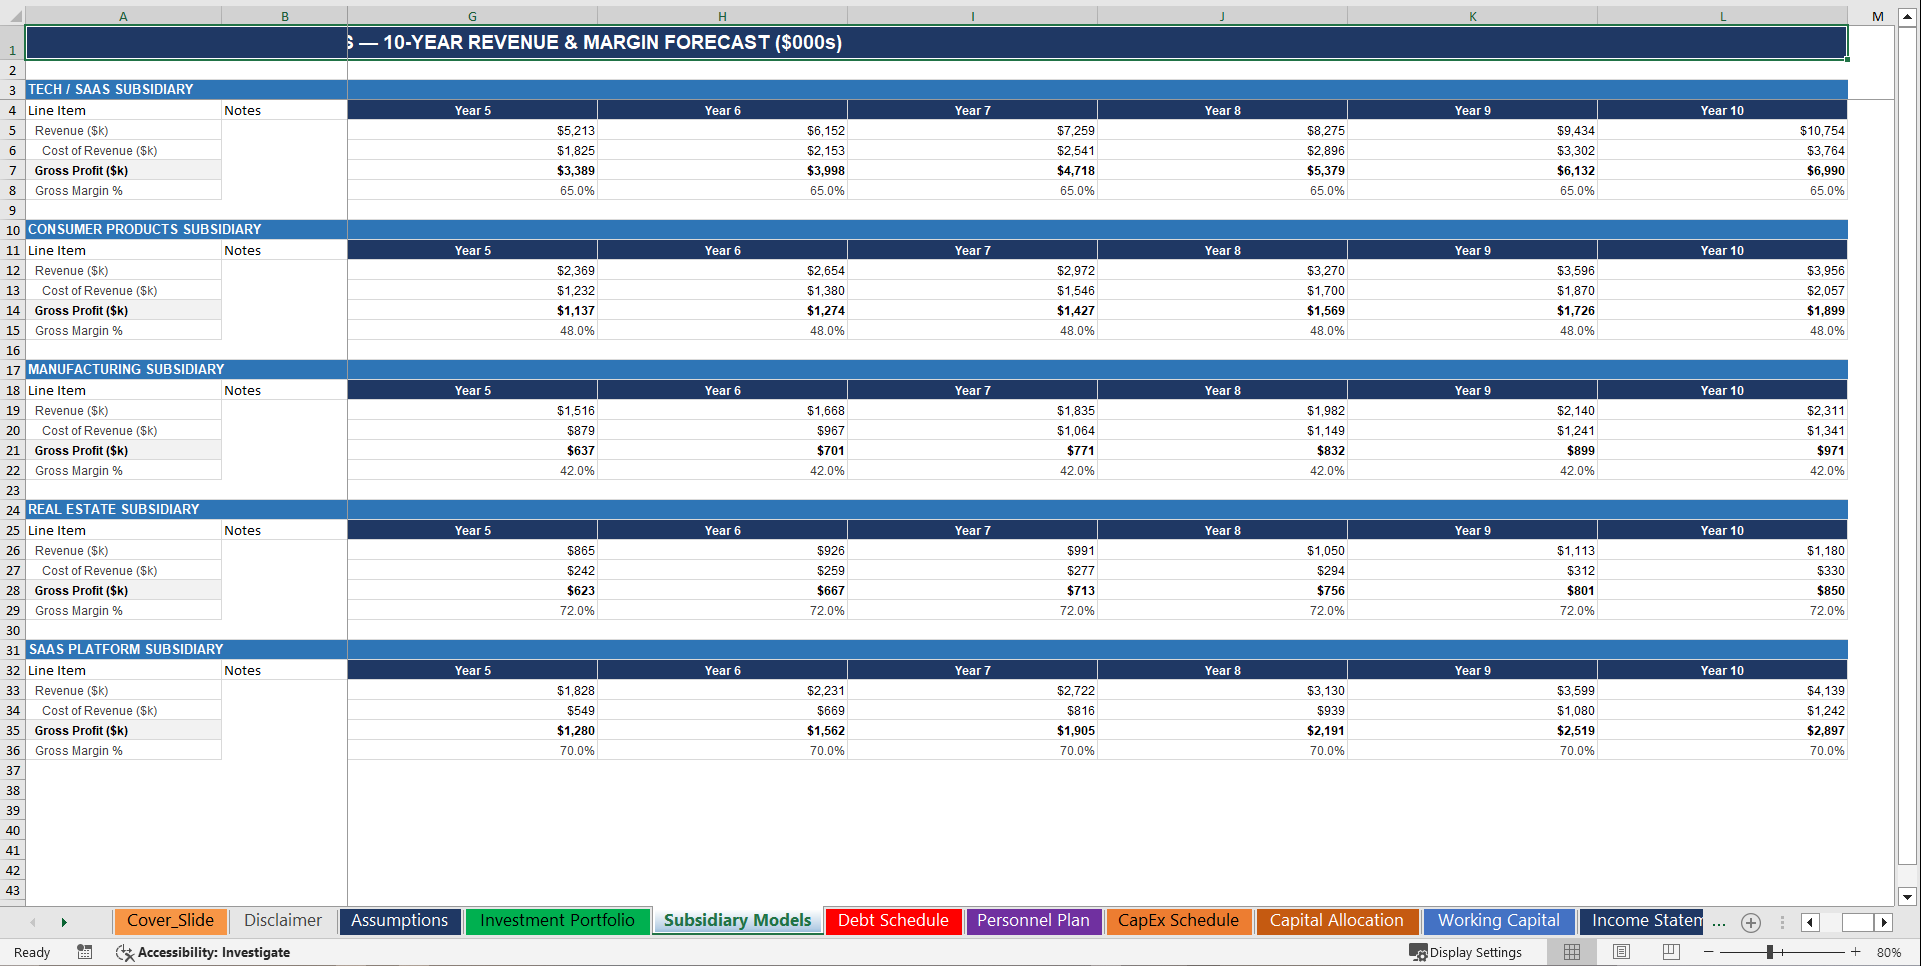
• 🏢 5-Subsidiary Operating Engine – Tech / SaaS / Consumer Products / Manufacturing / Real Estate / SaaS Platform – each with its own base revenue, year-by-year growth rates, and COGS ratio / every subsidiary independently configurable from a single Assumptions tab / no hardcoded numbers outside inputs / full auditability from revenue driver to consolidated P&L
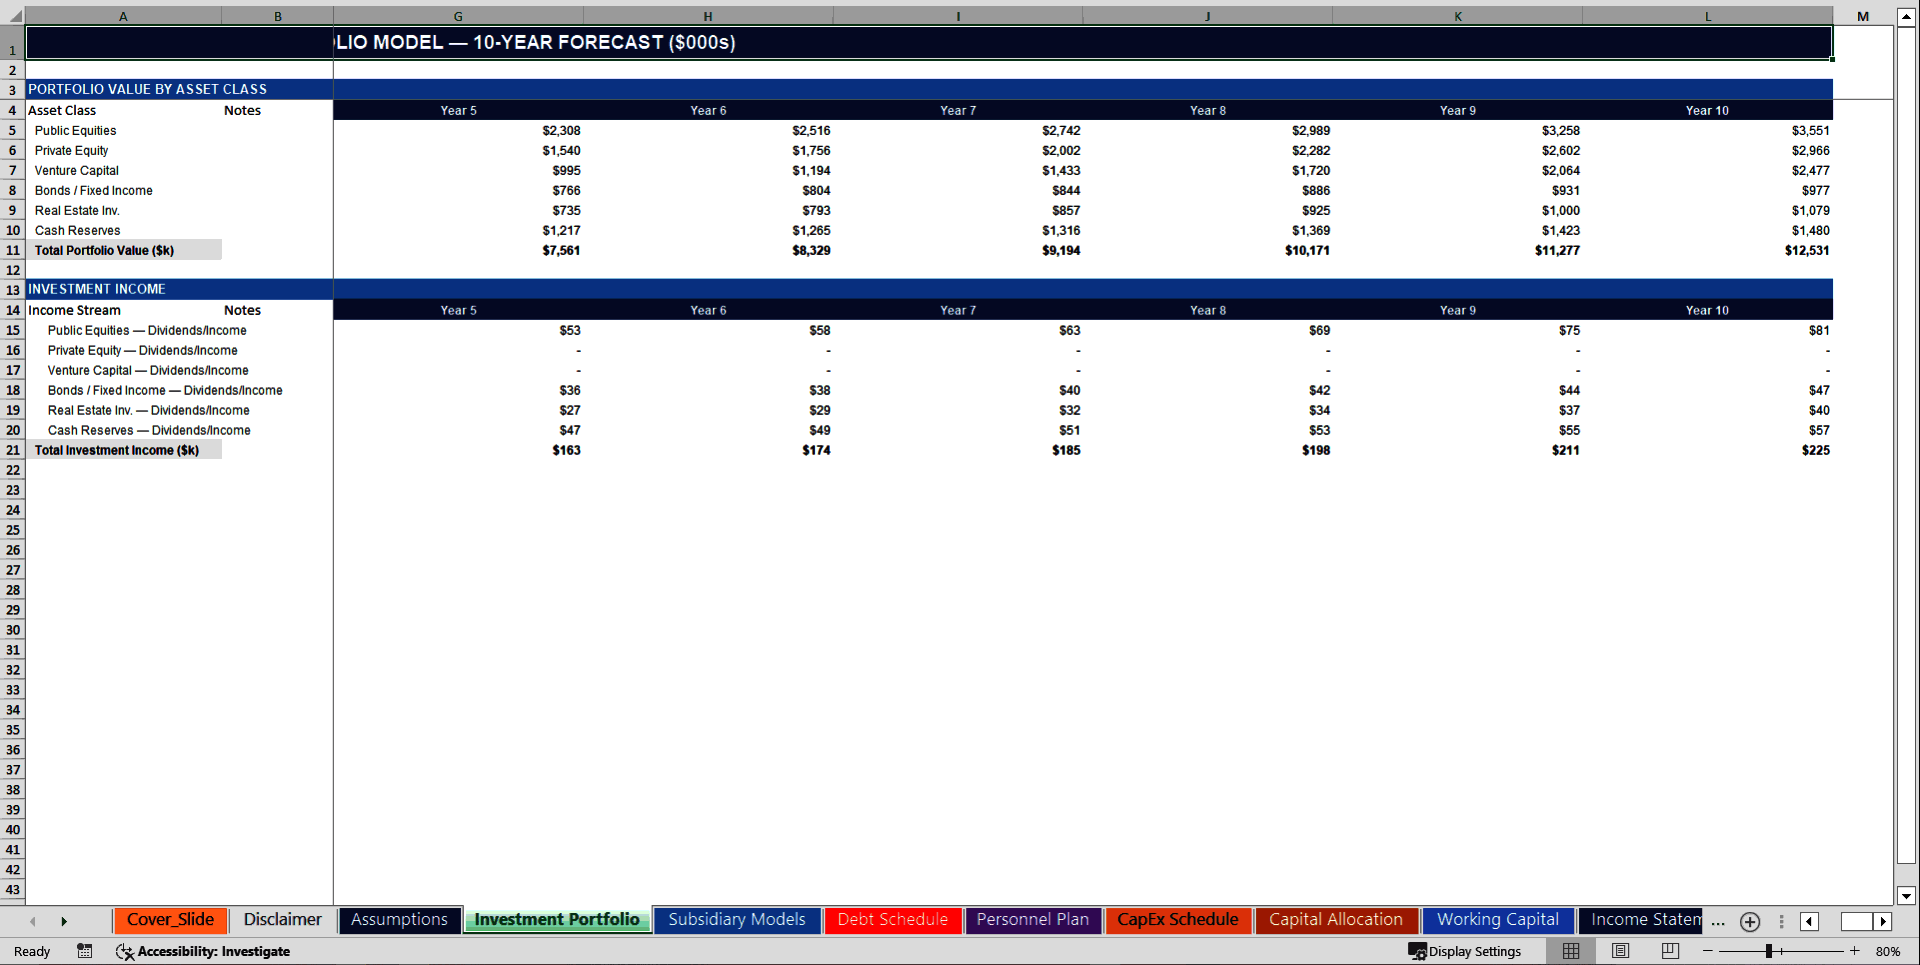
• 💼 6-Asset Investment Portfolio – Public Equities / Private Equity / Venture Capital / Bonds & Fixed Income / Real Estate Investments / Cash Reserves – each with initial value / annual return assumption / dividend yield / reinvestment rate / portfolio value compounding annually across all 10 years / total investment income flowing directly into the consolidated Income Statement
• 📊 Multi-Tier Revenue Architecture – subsidiary operating revenue across 5 business lines / investment income across 6 asset classes / acquisition revenue contributions modeled from the year of closing / every dollar traced back to its operational or portfolio root cause / blended consolidation auto-calculated with no manual aggregation
• 👥 7-Role Personnel Scaling Plan – C-Suite / Engineering & Tech / Sales / Operations / Finance & Accounting / Marketing / HR & Admin – Year 1 through Year 10 headcount interpolated across milestone years / role-level salaries / annual raise compounding at 3–5% / benefits load at 18–22% / total personnel cost flowing directly into the Income Statement as a discrete line
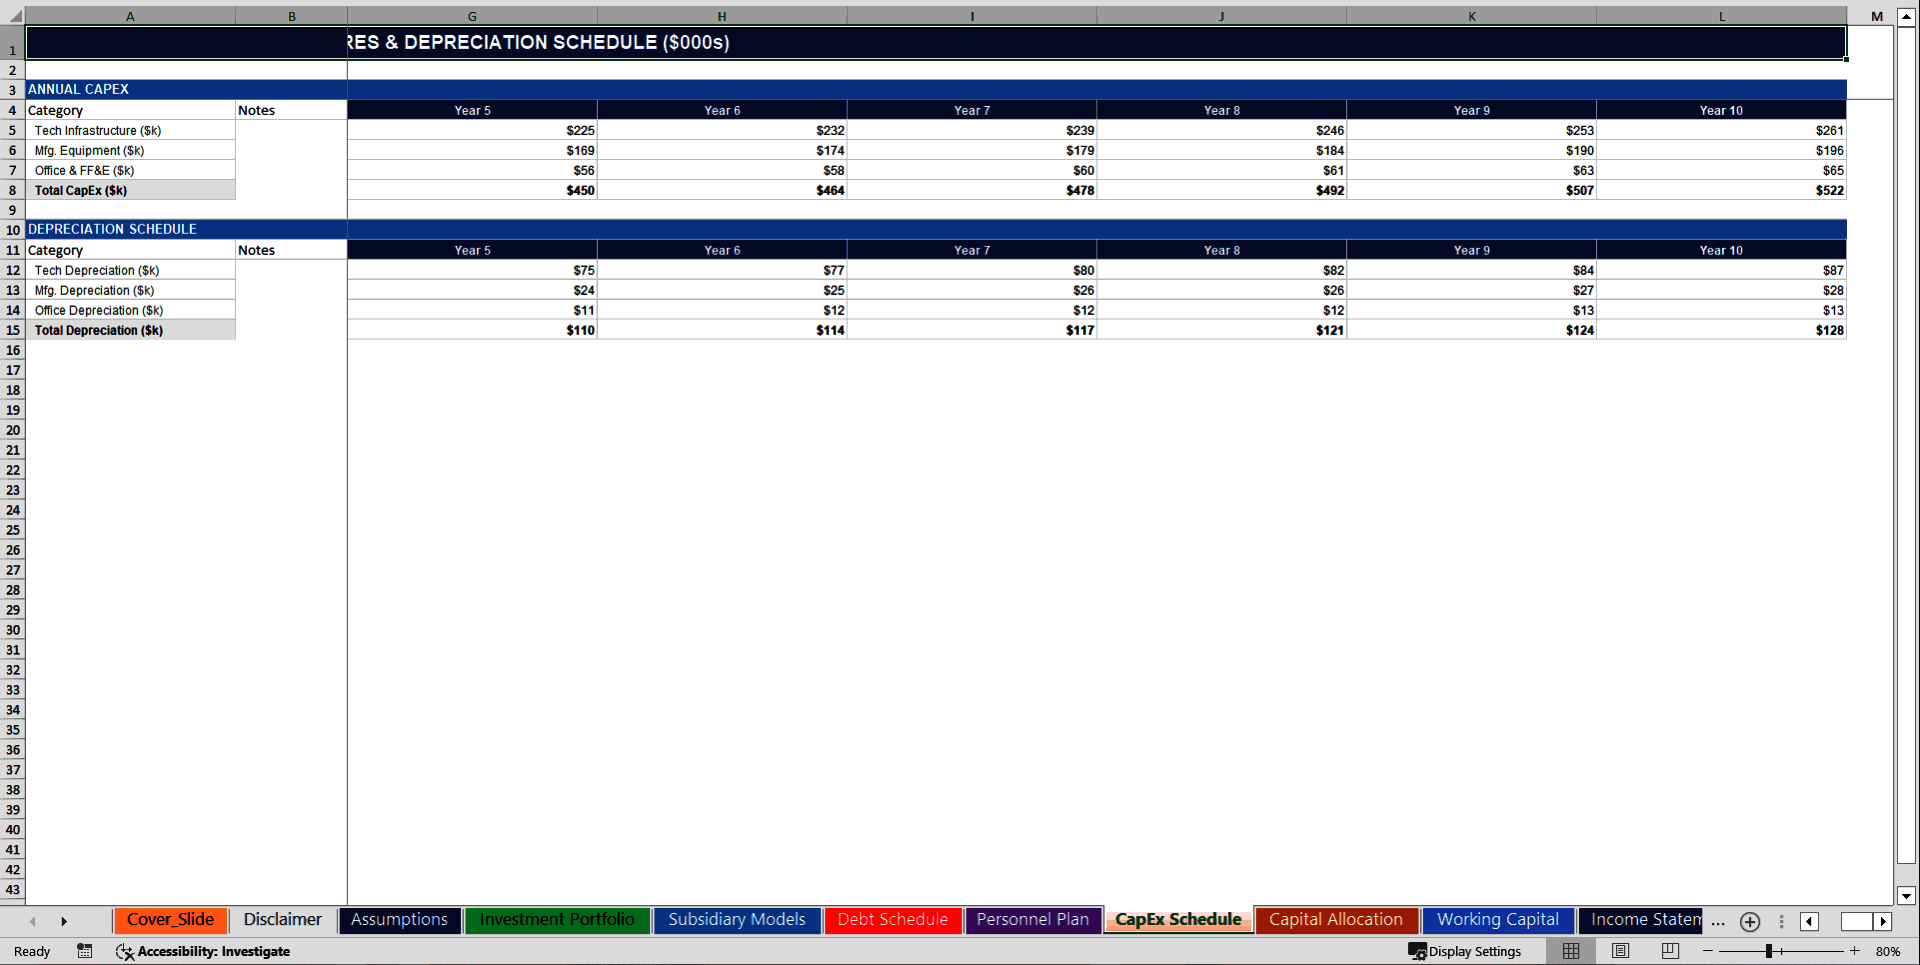
• 🏗️ 3-Category CapEx & Depreciation Schedule – Tech Infrastructure / Manufacturing Equipment / Office & FF&E – annual CapEx scaling with inflation / straight-line depreciation by asset class / useful life assumptions configurable per category / accumulated depreciation and Net PP&E tracked for every year
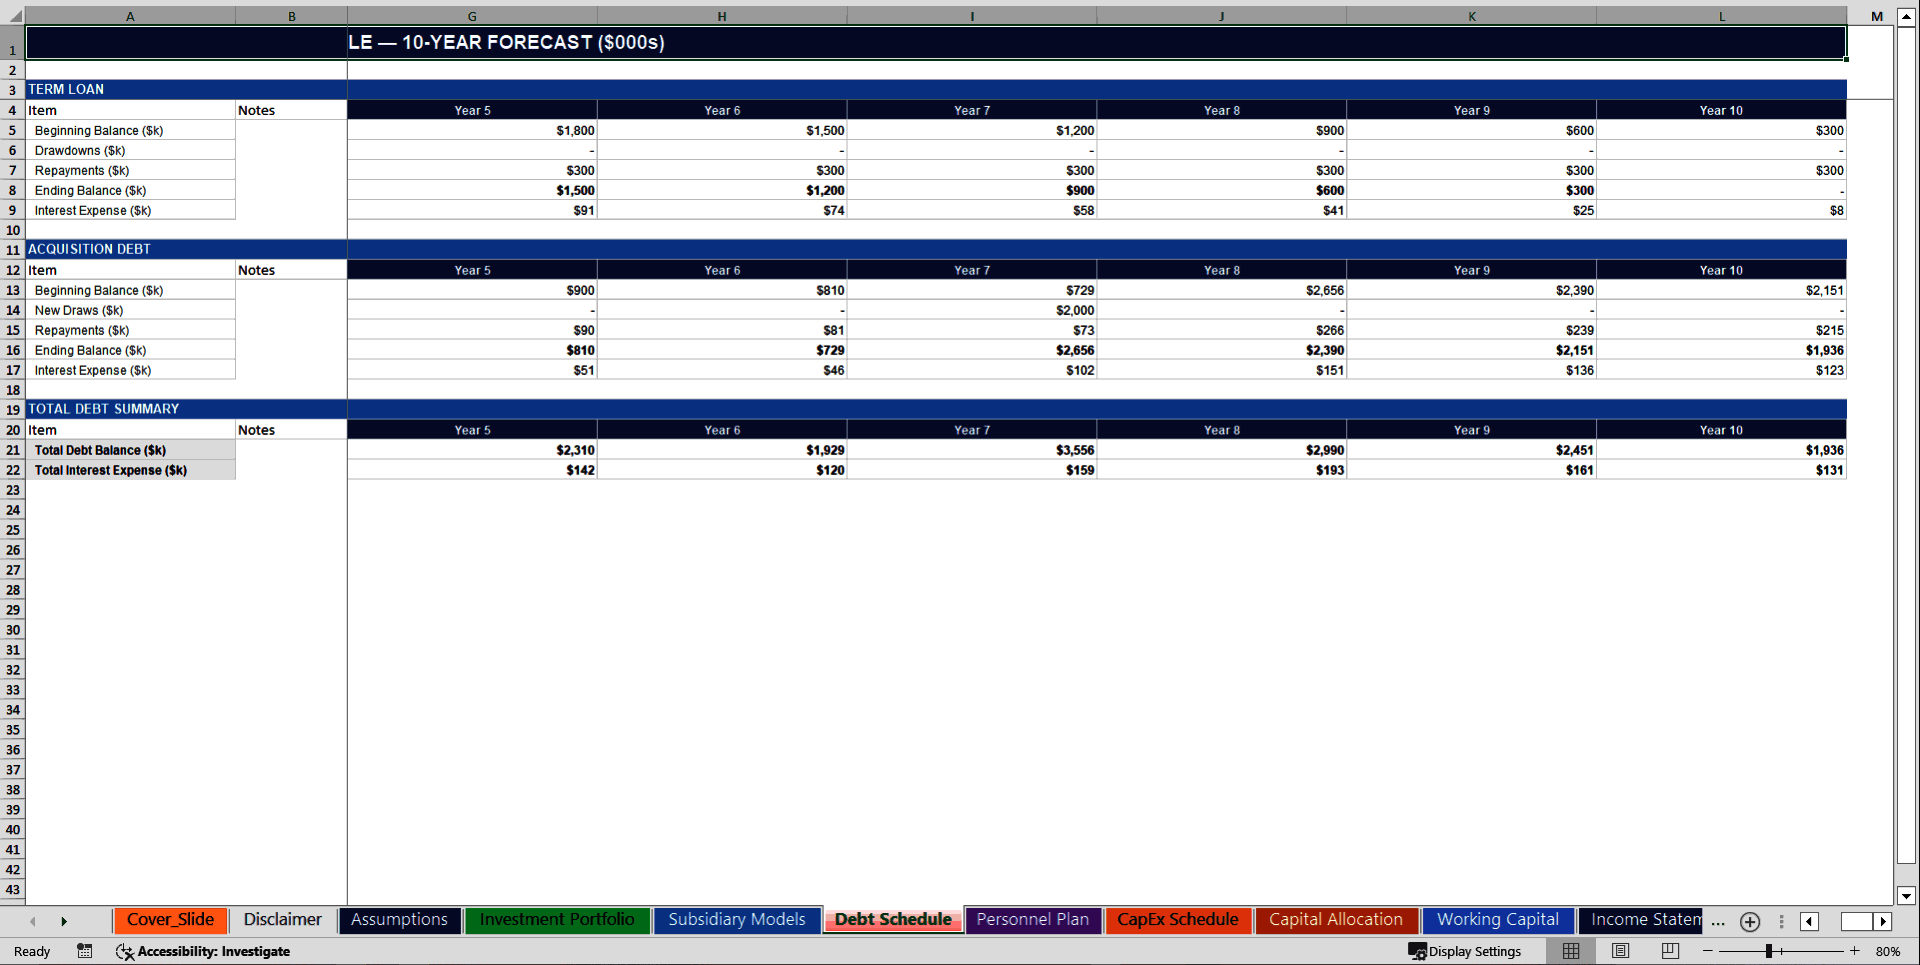
• 🔄 Full Debt Financing Schedule – Term Loan with beginning balance / drawdowns / repayments / ending balance / interest expense / Acquisition Debt with Year 3 and Year 7 draw mechanics / blended total debt balance / total interest expense consolidated and flowing directly into the Income Statement / debt covenants and coverage ratios available in Sensitivity Analysis
• 🎯 2-Target Acquisition Model – Acquisition A closing in Year 3 / Acquisition B closing in Year 7 – each with configurable purchase price / revenue multiple / EBITDA multiple / cash-debt-equity financing mix / goodwill creation on the Balance Sheet / intangible amortization on the Income Statement / acquisition debt draw reflected in the Debt Schedule / acquisition cash outflow in the Cash Flow Statement
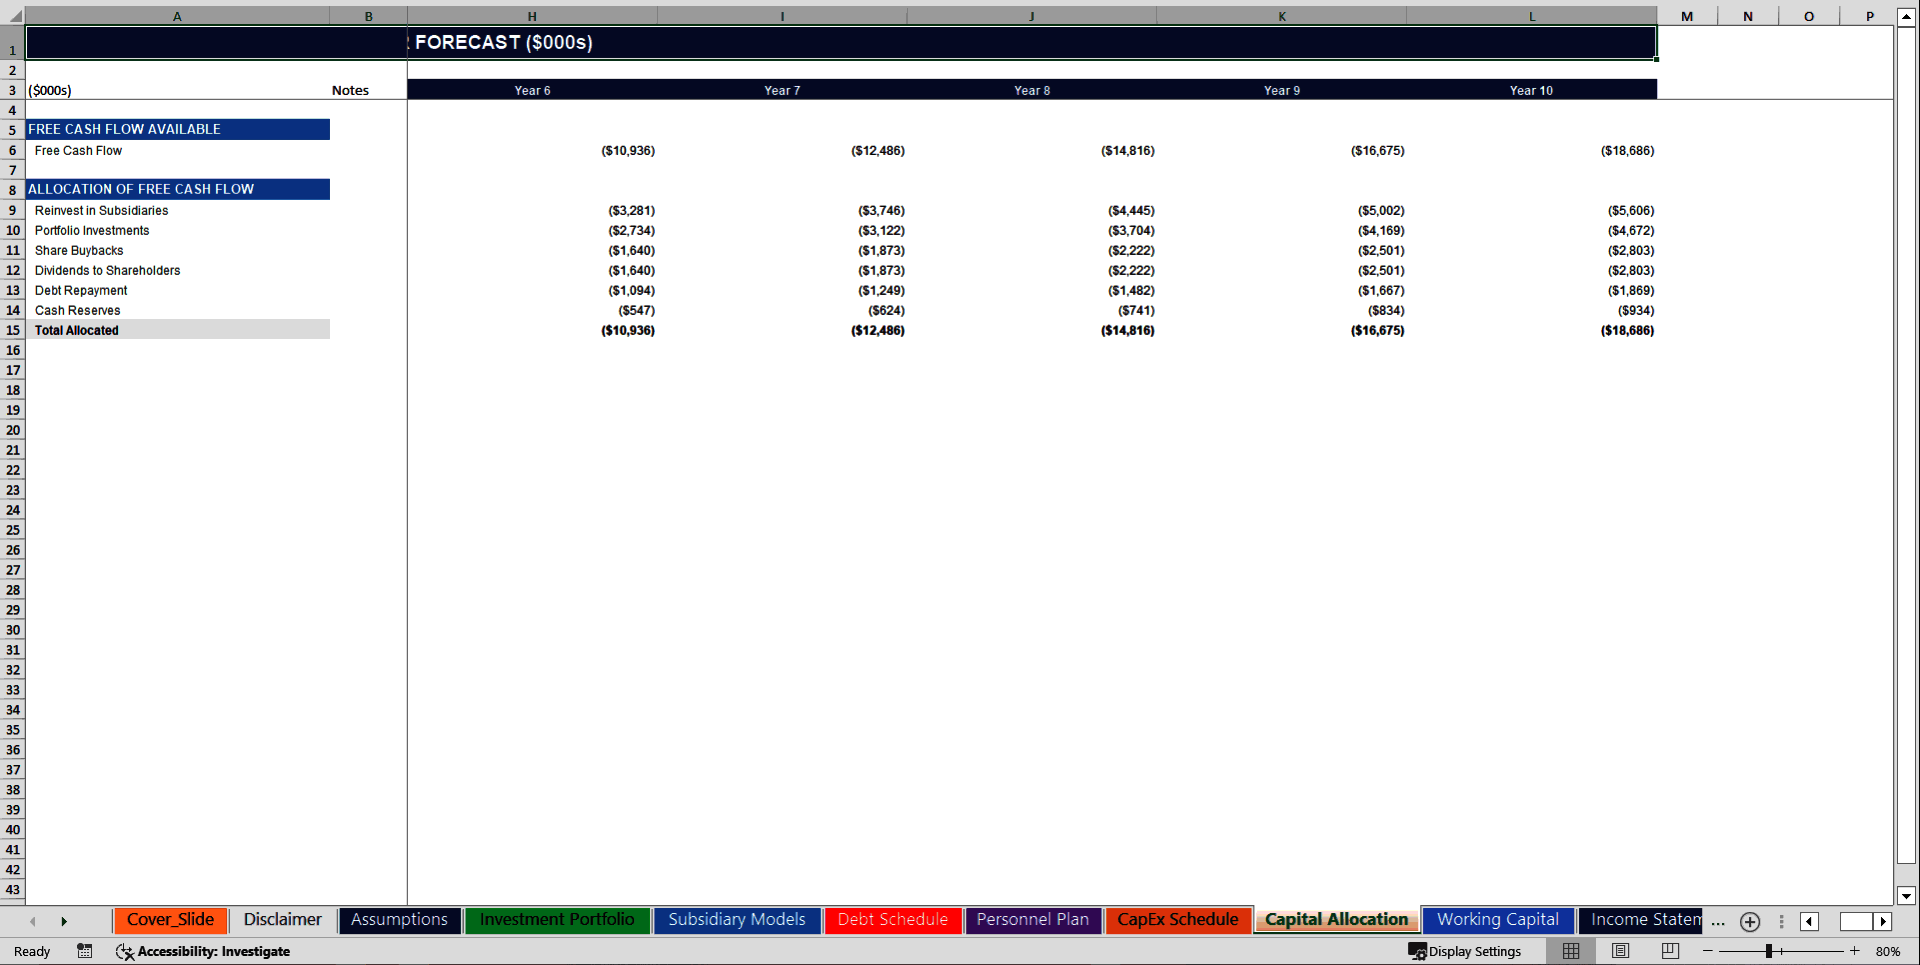
• 📐 6-Use Capital Allocation Framework – Reinvest in Subsidiaries / Portfolio Investments / Share Buybacks / Dividends to Shareholders / Debt Repayment / Cash Reserves – each as a configurable percentage of Free Cash Flow / total allocation reconciled automatically / capital deployment visible across all 10 years
• 🔍 3-Table Sensitivity & Scenario Analysis – Year 5 Net Income across a Revenue Growth vs. EBITDA Margin matrix / Interest Coverage Ratio across a Debt Level vs. Interest Rate matrix / Conservative vs. Base vs. Aggressive scenario comparison on 6 key Year 10 metrics – 50+ instant scenario data points / color-coded for at-a-glance risk management
📤 Outputs
• 📈 10-Year 3-Statement Financial Model – Fully integrated Income Statement / Balance Sheet / Cash Flow Statement / cross-linked and auto-balancing across all 10 years / 1,789 live formulas / zero errors / Balance Sheet auto-confirmed via built-in balance check formula on every column
• 🏢 Consolidated Subsidiary Revenue Roll-Up – Annual revenue projections for all 5 operating subsidiaries / COGS by subsidiary / Gross Profit and Gross Margin by subsidiary / subsidiary-level detail feeding directly into the consolidated Income Statement / no manual aggregation / no broken links
• 💼 Investment Portfolio Value & Income Schedule – Annual portfolio value by asset class compounding from initial investment through Year 10 / total portfolio value trajectory / dividend and income yield by asset class / total investment income consolidated into revenue / the exact portfolio reporting structure institutional LPs and family office principals require
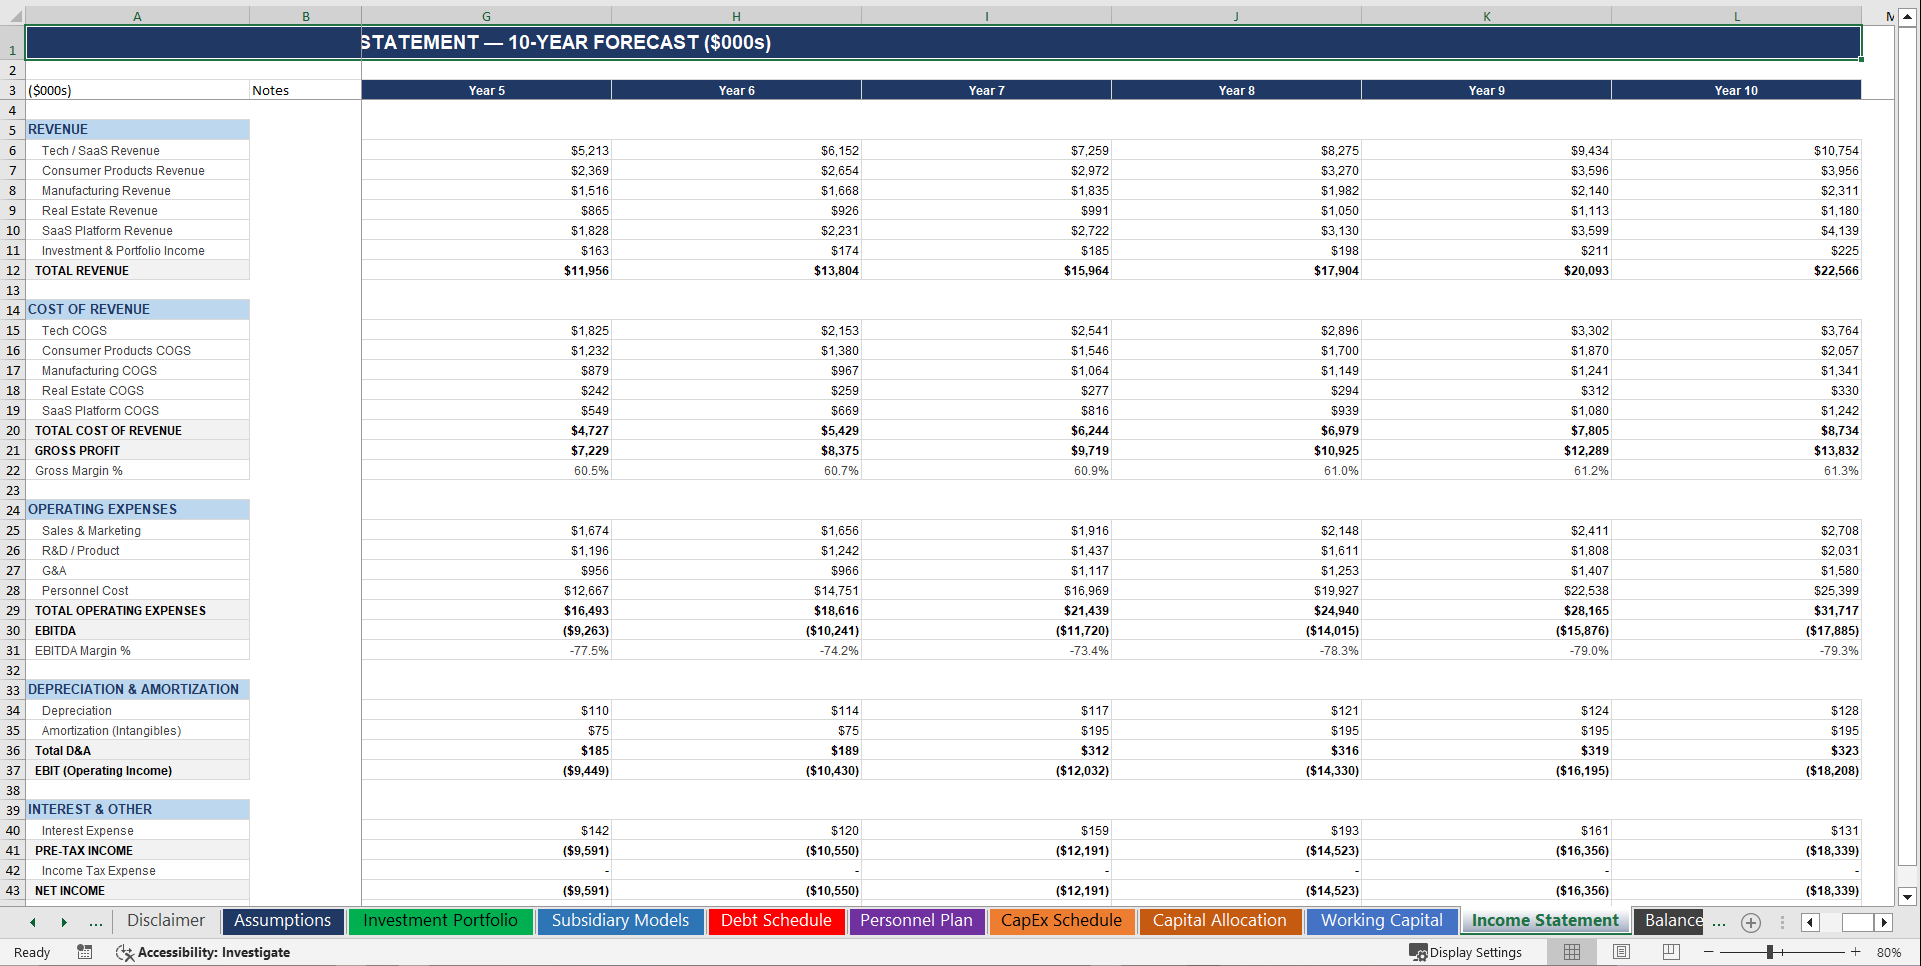
• 📊 Full Income Statement – Total Revenue → Cost of Revenue → Gross Profit → Operating Expenses → EBITDA → D&A → EBIT → Interest Expense → Pre-Tax Income → Tax Provision → Net Income / Gross Margin % / EBITDA Margin % / Net Margin % printed for every year / margins expanding from ~13% EBITDA in Year 1 to ~25% by Year 10
• 🏛️ Auto-Balancing Balance Sheet – Cash linked from Cash Flow Statement / Accounts Receivable / Inventory / Prepaid Expenses / PP&E Net / Goodwill from acquisitions / Investment Portfolio / Accounts Payable / Accrued Expenses / Deferred Revenue / Short-Term Debt / Long-Term Debt / Paid-in Capital / Retained Earnings / Treasury Stock – Assets = Liabilities + Equity confirmed with a live balance check on every forecast year
• 🔄 Indirect-Method Cash Flow Statement – Net Income → D&A add-back → Working Capital changes → CapEx outflows → Acquisition outflows → Portfolio investment outflows → Debt issuance and repayment → Dividends paid → Share buybacks → Beginning and Ending Cash / Free Cash Flow summary with Operating Cash Flow less CapEx calculated separately for every year
• 💰 Free Cash Flow & Capital Allocation Schedule – FCF calculated year by year / allocated across 6 uses as configurable percentages / Reinvestment / Portfolio growth / Buybacks / Dividends / Debt repayment / Reserves – the exact capital deployment transparency that institutional LPs, family office boards, and acquisition committees demand
• 🔁 Debt Amortization & Coverage Schedule – Term Loan beginning balance / repayments / ending balance / interest expense / Acquisition Debt draw mechanics in Years 3 and 7 / total blended debt balance declining over time / total interest expense consolidated / Debt/EBITDA ratio available in Sensitivity Analysis across multiple stress scenarios
• 💼 10-Year Personnel Cost Schedule – Headcount by role interpolated from Year 1 through Year 10 milestones / total FTE count by year / total compensation cost by role / salary × benefits × annual raise compounding / full personnel cost flowing into the Income Statement / headcount growth visualized in the Executive Dashboard
• 📊 Executive Dashboard – 8 KPI tiles covering Total Revenue / EBITDA / Net Income / Portfolio Value / EBITDA Margin / Net Margin / Debt-to-EBITDA / Total Headcount – plus 6 fully working dynamic charts: Revenue & EBITDA Bar Chart / Net Income Trend Line / Portfolio Value Growth Line / Debt Balance Decline Bar / Subsidiary Revenue Mix Pie / Headcount Growth Bar – all auto-updating from live formula data
🏆 Why This Model Wins the Room
✅ Investor and board-ready – structured to answer the exact questions family office LPs, private equity deal teams, acquisition committees, and lenders ask on day one / What is stabilized EBITDA at the holdco level? / What is the blended portfolio return? / When does consolidated Free Cash Flow turn self-funding? / What is the Debt/EBITDA covenant headroom? / every answer pre-built / every formula auditable
✅ Multi-entity holding company realistic – built around how diversified holding companies actually generate and deploy capital / subsidiaries ramping gradually from realistic Year 1 bases / investment portfolio compounding with asset-class-specific return and yield assumptions / acquisitions modeled with goodwill, amortization, and financing mix / personnel scaling gradually across milestone years / no hypergrowth fantasy assumptions / no generic template recycled into a holdco format
✅ Color-coded for institutional clarity – blue inputs / black formulas / green cross-sheet links / yellow flagged assumptions / industry-standard financial modeling color conventions throughout / any LP, deal team member, lender, or acquirer can open this file and immediately navigate the logic with zero orientation time
✅ Fully unlocked and locale-safe – no protected sheets / no black-box formulas / no hidden logic / no date cells that break on German or regional PC settings / all numbers formatted with locale-independent numeric formats / every assumption visible / every formula auditable / present it to any institutional investor, strategic acquirer, or lender with complete confidence
📋 Model Structure – 13 Sheets
• Assumptions – every input centralized / global settings / subsidiary revenue assumptions / OpEx ratios / personnel plan inputs / debt and financing assumptions / investment portfolio assumptions / capital allocation percentages / CapEx assumptions / acquisition parameters – all blue-coded / all formula-driven / nothing hardcoded outside this tab
• Executive Dashboard – 8 KPI tiles + 6 dynamic working charts / Revenue & EBITDA / Net Income trend / Portfolio value growth / Debt balance decline / Subsidiary revenue mix pie / Headcount growth / everything a board or LP needs at a glance
• Income Statement – Revenue → Gross Profit → EBITDA → EBIT → Net Income / 5 subsidiary revenue lines + investment income / full OpEx detail / D&A / interest / taxes / margin percentages for every year
• Balance Sheet – current and non-current assets / current and non-current liabilities / equity / auto-balance confirmation formula / Cash linked directly from the Cash Flow Statement / Goodwill from acquisition model / Investment Portfolio linked from Portfolio sheet
• Cash Flow Statement – indirect method / Operating / Investing / Financing sections / acquisition outflows / portfolio investment flows / FCF summary / Beginning and Ending Cash fully linked to the Balance Sheet
• Subsidiary Models – 5 operating subsidiaries modeled independently / revenue by growth assumption / COGS by ratio / Gross Profit and Gross Margin by subsidiary / all rolling up into the consolidated Income Statement
• Investment Portfolio – 6 asset classes / annual value compounding / dividend and income yield / total portfolio value / total investment income – linked directly into the Income Statement
• Personnel Plan – 7 roles / Year 1 through Year 10 headcount interpolated across milestones / salary × benefits × raise compounding / total FTE and total personnel cost linked into the Income Statement
• Debt Schedule – Term Loan amortization / Acquisition Debt draw and repayment mechanics / total blended debt balance / total interest expense consolidated – linked into the Income Statement and Balance Sheet
• CapEx Schedule – 3 asset categories / annual CapEx scaling with inflation / straight-line depreciation / accumulated depreciation / Net PP&E – linked into the Income Statement and Balance Sheet
• Working Capital – AR / Inventory / Prepaid / AP / Accrued Liabilities / Deferred Revenue / Net Working Capital / DSO / DIO / DPO efficiency metrics – NWC changes linked into the Cash Flow Statement
• Capital Allocation – Free Cash Flow sourced from Cash Flow Statement / allocated across 6 uses as configurable percentages / full 10-year deployment schedule
• Sensitivity Analysis – Year 5 Net Income matrix across Revenue Growth × EBITDA Margin / Interest Coverage matrix across Debt Level × Interest Rate / Conservative vs. Base vs. Aggressive scenario summary on 6 Year 10 metrics
*"Most holding company operators know their portfolio inside out. The principals who close LP commitments, structure winning acquisitions, and build enduring multi-entity businesses also know their consolidated numbers inside out. This model is how you close that gap – in an afternoon, not a quarter."*
Key Words:
Strategy & Transformation, Growth Strategy, Strategic Planning, Strategy Frameworks, Innovation Management, Pricing Strategy, Core Competencies, Strategy Development, Business Transformation, Marketing Plan Development, Product Strategy, Breakout Strategy, Competitive Advantage, Mission, Vision, Values, Strategy Deployment & Execution, Innovation, Vision Statement, Core Competencies Analysis, Corporate Strategy, Product Launch Strategy, BMI, Blue Ocean Strategy, Breakthrough Strategy, Business Model Innovation, Business Strategy Example, Corporate Transformation, Critical Success Factors, Customer Segmentation, Customer Value Proposition, Distinctive Capabilities, Enterprise Performance Management, KPI, Key Performance Indicators, Market Analysis, Market Entry Example, Market Entry Plan, Market Intelligence, Market Research, Market Segmentation, Market Sizing, Marketing, Michael Porter's Value Chain, Organizational Transformation, Performance Management, Performance Measurement, Platform Strategy, Product Go-to-Market Strategy, Reorganization, Restructuring, SWOT, SWOT Analysis, Service 4.0, Service Strategy, Service Transformation, Strategic Analysis, Strategic Plan Example, Strategy Deployment, Strategy Execution, Strategy Frameworks Compilation, Strategy Methodologies, Strategy Report Example, Value Chain, Value Chain Analysis, Value Innovation, Value Proposition, Vision Statement, Corporate Strategy, Business Development, Business plan pdf, business plan, PDF, Business Plan DOC, Business Plan Template, PPT, Market strategy playbook, strategic market planning, competitive analysis tools, market segmentation frameworks, growth strategy templates, product positioning strategy, market execution toolkit, strategic alignment playbook, KPI and OKR frameworks, business growth strategy guide, cross-functional strategy templates, market risk management, market strategy PowerPoint doc, guide, ebook, e-book ,McKinsey Change Playbook, Organizational change management toolkit, Change management frameworks 2025, Influence model for change, Change leadership strategies, Behavioral change in organizations, Change management PowerPoint templates, Transformational leadership in change, supply chain KPIs, supply chain KPI toolkit, supply chain PowerPoint template, logistics KPIs, procurement KPIs, inventory management KPIs, supply chain performance metrics, manufacturing KPIs, supply chain dashboard, supply chain strategy KPIs, reverse logistics KPIs, sustainability KPIs in supply chain, financial supply chain KPIs, warehouse KPIs, digital supply chain KPIs, 1200 KPIs, supply chain scorecard, KPI examples, supply chain templates, Corporate Finance SOPs, Finance SOP Excel Template, CFO Toolkit, Finance Department Procedures, Financial Planning SOPs, Treasury SOPs, Accounts Payable SOPs, Accounts Receivable SOPs, General Ledger SOPs, Accounting Policies Template, Internal Controls SOPs, Finance Process Standardization, Finance Operating Procedures, Finance Department Excel Template, FP&A Process Documentation, Corporate Finance Template, Finance SOP Toolkit, CFO Process Templates, Accounting SOP Package, Tax Compliance SOPs, Financial Risk Management Procedures.
NOTE: Our digital products are sold on an "as is" basis, making returns and refunds unavailable post-download. Please preview and inquire before purchasing. Please contact us before purchasing if you have any questions! This policy aligns with the standard Flevy Terms of Usage.
Got a question about the product? Email us at support@flevy.com or ask the author directly by using the "Ask the Author a Question" form. If you cannot view the preview above this document description, go here to view the large preview instead.
Source: Best Practices in Integrated Financial Model Excel: Holding Company 10-Year 3 Statement Financial Model Excel (XLSX) Spreadsheet, SB Consulting
ABOUT THE AUTHOR
SB Consulting is dedicated to empowering businesses to communicate their ideas with impact. This consulting firm specializes in teaching organizations how to create effective corporate and management presentations. With training from top-tier global consulting firms, including McKinsey, BCG, and Porsche Consulting, extensive expertise in presentation design and ... [read more]
Ask the Author a Question
You must be logged in to contact the author.
