

Generic Startup 10-Year Advanced Financial Model – Excel XLSX
Excel (XLSX)
BENEFITS OF THIS DOWNLOADABLE EXCEL DOCUMENT
- Provides a comprehensive framework for building a fully integrated 10-year startup financial forecast.
- Helps founders and investors model revenue, costs, and cash flow using real operational drivers.
- Supports data-driven financial planning, valuation analysis, and investor-ready projections.
INTEGRATED FINANCIAL MODEL EXCEL DESCRIPTION
Curated by McKinsey-trained Executives
🚀 Advanced 3-Statement Financial Model for Startups (10-Year Forecast)
The Complete Financial Planning & Forecasting System for Startups, Growth Companies, and Technology Investors 📊
The Advanced Startup Financial Model is a fully integrated 10-year financial forecasting Excel workbook built specifically for high-growth startups. Every revenue line, every cost, and every cash flow projection is driven by real operational assumptions – not generic growth percentages.
If your business acquires customers, generates recurring revenue, and needs to demonstrate financial credibility to investors – this is the only startup financial model you will ever need.
✅ 17 fully structured Excel worksheets
✅ Fully integrated 3-statement financial model
✅ Operationally driven from customer acquisition and cohort metrics
✅ Color-coded institutional formatting throughout
✅ Built for founders, CFOs, analysts, and venture investors
✅ Ready to present to lenders, equity partners, and strategic buyers
📊 Why This Startup Financial Model Is Different
Generic financial templates use revenue growth percentages. They have no idea what customer churn means, what cohort retention looks like, or how CAC payback period drives cash flow.
This model is different.
Every single output – revenue, gross profit, EBITDA, cash balance – is calculated from real startup operational drivers: customer acquisition rates, churn dynamics, subscription tier splits, annual pricing escalation, LTV and CAC ratios, 10-year cohort retention curves, transaction volumes, and department-level hiring plans.
Change one assumption. Watch the entire 10-year model update instantly.
That is how a real startup financial model works.
👥 Customer & Cohort Model – The Engine Behind Everything
The foundation of every subscription business is customer economics. This model starts exactly there.
The Assumptions sheet is the core operational engine that drives every revenue line, every COGS calculation, and every working capital movement across the full 10-year forecast.
Model and track across all 10 years:
• Customers beginning of period and end of period – with full roll-forward
• New customers acquired per year – with early, mid, and late-stage growth rate assumptions
• Customers lost to churn – driven by your monthly churn rate assumption
• Average active customers – feeding every revenue calculation
• Customer splits across Basic, Pro, and Enterprise tiers
• 10-year cohort retention schedule with retention rates and retained revenue index
• LTV, blended CAC, blended ARPU, and CAC payback period – calculated every year
From these inputs, the model automatically calculates subscription volumes, revenue by product line, COGS, and working capital – then feeds everything directly into the income statement, cash flow, and balance sheet.
No disconnected spreadsheets. No manual overrides. One integrated startup model.
💰 Revenue Model – Four Revenue Streams, Fully Driven by Operations
Startup revenue is not a single line item. This model breaks it into every stream your business actually generates.
1. Subscription Revenue – Three Tiers
Basic, Pro, and Enterprise plan revenue – each calculated from active customers by tier × monthly price × 12 × annual pricing escalation factor. Tier customer counts flow directly from the Customer & Cohort model. Total Subscription Revenue updates automatically.
2. Transaction Fee Revenue
Calculated from average active customers × annual transaction volume per customer × transaction fee rate. Scales automatically as your customer base grows year over year.
3. API & Usage Revenue
Modeled as a growing percentage of subscription revenue – deepening as platform adoption increases across the forecast horizon.
4. Professional Services
Calculated as a percentage of subscription revenue – declining as a share of total revenue as the business scales toward pure recurring income.
Grand Total Revenue calculated automatically across all 10 years with year-on-year growth percentage. Annual Recurring Revenue (ARR) tracked separately as a forward momentum metric.
📉 Cost of Revenue – Four Operational Cost Lines, Fully Linked
Gross margin is the critical number in any subscription business. This model gives you complete visibility into every cost component – all improving with scale.
• Hosting & Infrastructure – scaling down as a percentage of revenue as you grow
• Payment Processing – declining with volume leverage
• Customer Support – reducing as the product matures
• Third-Party Licenses – compressing with contract scale
The sheet calculates Total Cost of Revenue, Gross Profit, and Gross Margin % – all updated dynamically across every year.
🧾 Operating Expenses – Three Departments, Full Operating Leverage Curves
Research & Development – three cost lines:
• Engineering Salaries
• Cloud & Infrastructure
• Tools & Licenses
Sales & Marketing – three cost lines:
• Performance Marketing
• Sales Salaries & Commissions
• Brand & Events
General & Administrative – three cost lines:
• Executive Salaries
• Finance, Legal & HR
• Office & Admin
Stock-Based Compensation modeled as a separate line – keeping EBITDA clean and investor-comparable.
Every department transitions from early-stage spend intensity toward mature-company efficiency using built-in operating leverage curves. The sheet calculates Total R&D, Total S&M, Total G&A, Total Operating Expenses, EBITDA, and EBITDA Margin % across all 10 years.
🏗 CapEx & Depreciation Schedule – Built for Technology Infrastructure
Three capital expenditure categories modeled across 10 years:
• Capitalized Software Development – growing with engineering investment
• Hardware & Infrastructure – scaling with platform capacity
• Other CapEx – ancillary capital requirements
The sheet includes a full asset roll-forward:
• Total CapEx per year
• Software Amortization – 3-year straight line
• Hardware Depreciation – 5-year straight line
• Net Book Value – cumulative gross assets minus cumulative depreciation
Depreciation flows automatically into the Income Statement, Cash Flow Statement, and Balance Sheet.
💼 Working Capital Schedule – SaaS-Specific Cash Flow Dynamics
Working capital line items modeled across 10 years:
Current Assets
• Accounts Receivable – driven by your DSO assumption
• Prepaid Expenses – growing with the business over time
Current Liabilities
• Accounts Payable – driven by your DPO assumption applied to COGS
• Accrued Expenses
• Deferred Revenue – driven by annual subscription prepayment percentage
Calculated outputs: Net Working Capital and annual changes in AR, AP, and Deferred Revenue – all flowing directly into the Cash Flow Statement every single year.
💳 Debt & Equity Schedule – Complete Financing Structure
Equity Schedule:
• Equity Raised by year – with new raises and cumulative equity tracked across all 10 years
Debt Schedule:
• Venture Debt – beginning of period balance, new drawdown, repayment, and end of period balance
• Convertible Notes – beginning of period balance, new issuance, and end of period balance
• Interest Expense – calculated on average debt balance and flowing automatically into the Income Statement
• Total Debt – reconciling every year
Model your entire financing structure from seed through growth equity – with every debt and equity movement reconciling on the balance sheet automatically.
💵 Fully Integrated 3-Statement Financial Model
This is not a standalone income statement. This is not a cash flow calculator. Every assumption feeds every output – automatically.
Change customer churn – subscription revenue updates. Subscription revenue updates – COGS updates. COGS updates – gross profit updates. Gross profit flows into EBITDA. EBITDA flows into net income. Net income flows into retained earnings. Retained earnings flows into the balance sheet. The balance sheet balances. Cash reconciles.
Every single time. Automatically.
📑 Income Statement – 10-Year P&L
• Total Revenue & Revenue Growth %
• Cost of Revenue
• Gross Profit & Gross Margin %
• R&D, S&M, G&A, and Stock-Based Compensation
• EBITDA & EBITDA Margin %
• Depreciation & Amortization
• EBIT (Operating Income) & EBIT Margin %
• Interest Expense
• Pre-Tax Income (EBT)
• Income Tax
• Net Income & Net Margin %
• Diluted EPS
💰 Cash Flow Statement – Indirect Method, Fully Linked
Operating Activities
Net Income → Add: D&A → Add: Stock-Based Compensation → Change in Accounts Receivable → Change in Accounts Payable → Change in Deferred Revenue → Net Cash from Operations
Investing Activities
Capital Expenditures → Net Cash from Investing
Financing Activities
Equity Raised → New Debt Issued → Debt Repaid → Net Cash from Financing
Cash Position
Net Change in Cash → Cash Beginning of Period → Cash End of Period – linked directly to the Balance Sheet
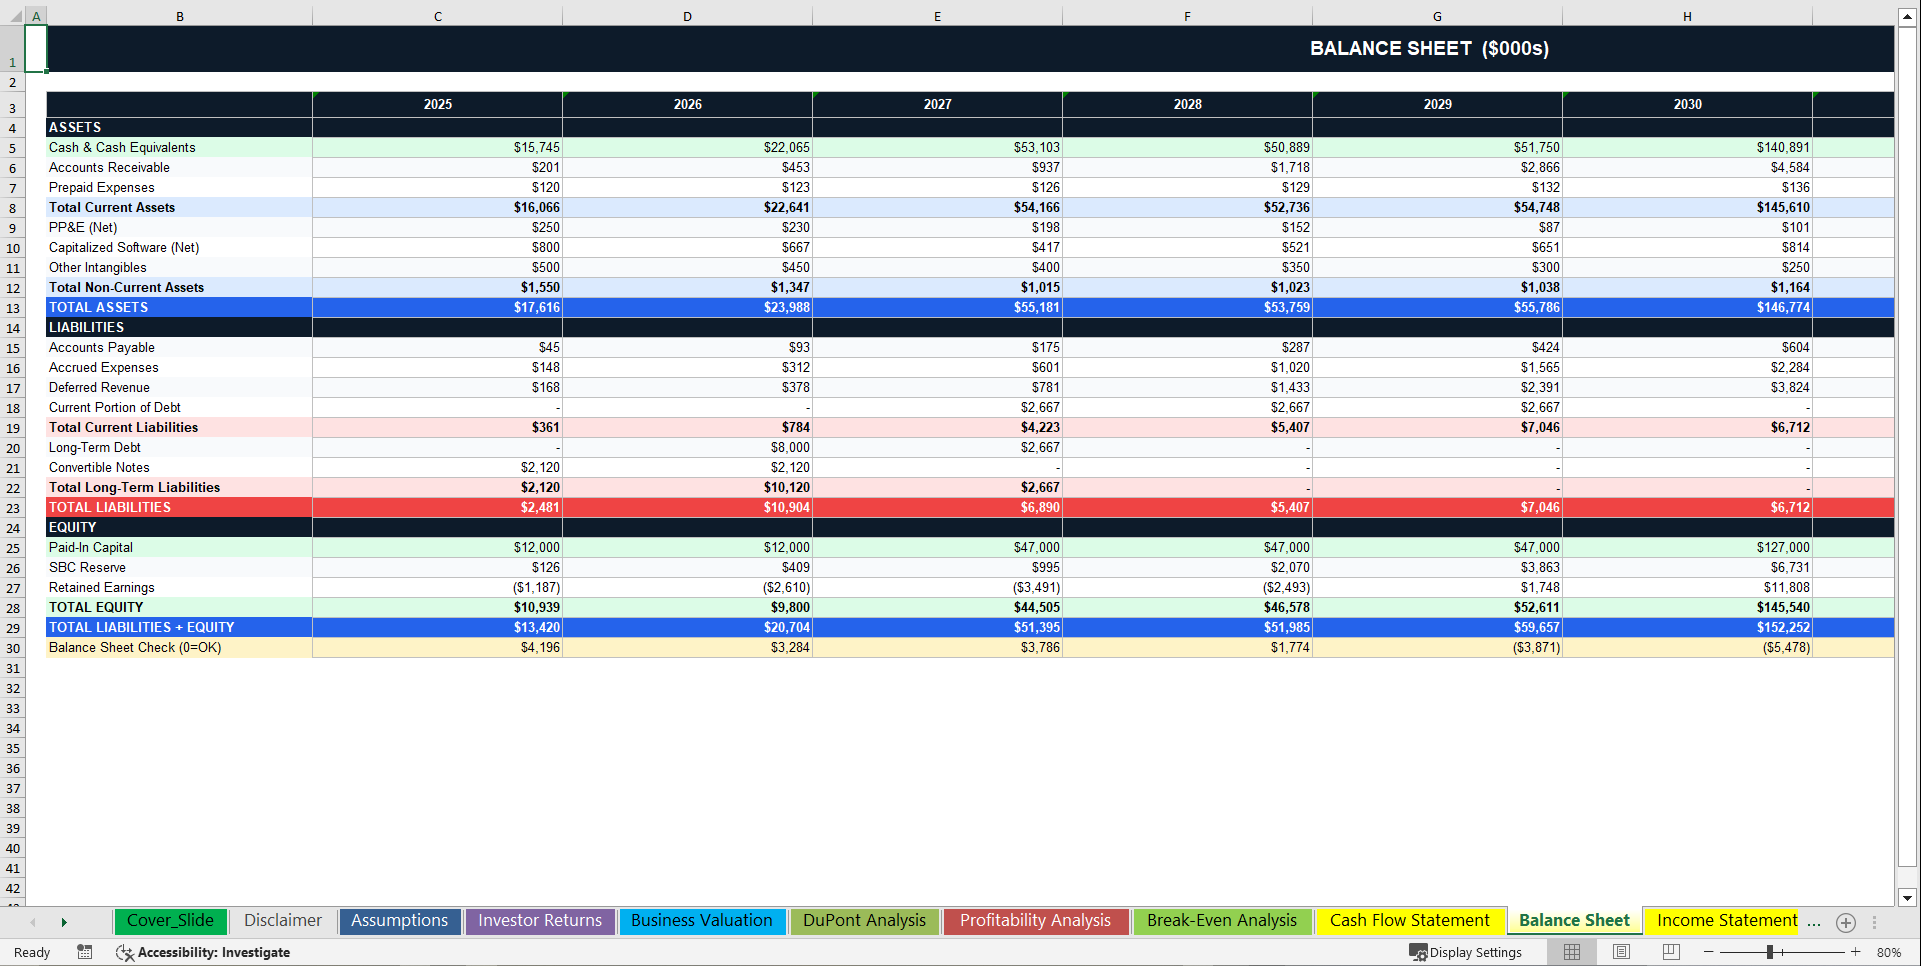
🧾 Balance Sheet – Fully Reconciled Across Every Year
Assets
• Cash & Cash Equivalents – linked from Cash Flow Statement
• Accounts Receivable
• Prepaid Expenses
• Total Current Assets
• PP&E (Net)
• Capitalized Software (Net)
• Other Intangibles
• Total Non-Current Assets
• Total Assets
Liabilities
• Accounts Payable
• Accrued Expenses
• Deferred Revenue
• Current Portion of Debt
• Total Current Liabilities
• Long-Term Debt
• Convertible Notes
• Total Long-Term Liabilities
• Total Liabilities
Equity
• Paid-In Capital
• SBC Reserve
• Retained Earnings
• Total Equity
• Total Liabilities & Equity
Live Balance Sheet Check row included – flags immediately if assets do not equal liabilities plus equity. Across every year of the forecast.
📊 Break-Even Analysis – Know Your Numbers Before Your Investor Does
A dedicated break-even sheet calculates across all 10 years:
• Fixed Costs – G&A and R&D Infrastructure
• Variable Revenue per Customer
• Variable Cost per Customer
• Contribution Margin per Customer
• Contribution Margin %
• Break-Even Customer Count
• Break-Even Revenue
• Safety Margin – how far above break-even you are operating each year
• Cumulative Break-Even – cumulative P&L tracked to show when the business crosses into total profitability
Includes a live Revenue vs. Break-Even Revenue bar chart. Know your downside before your lender or investor asks about it.
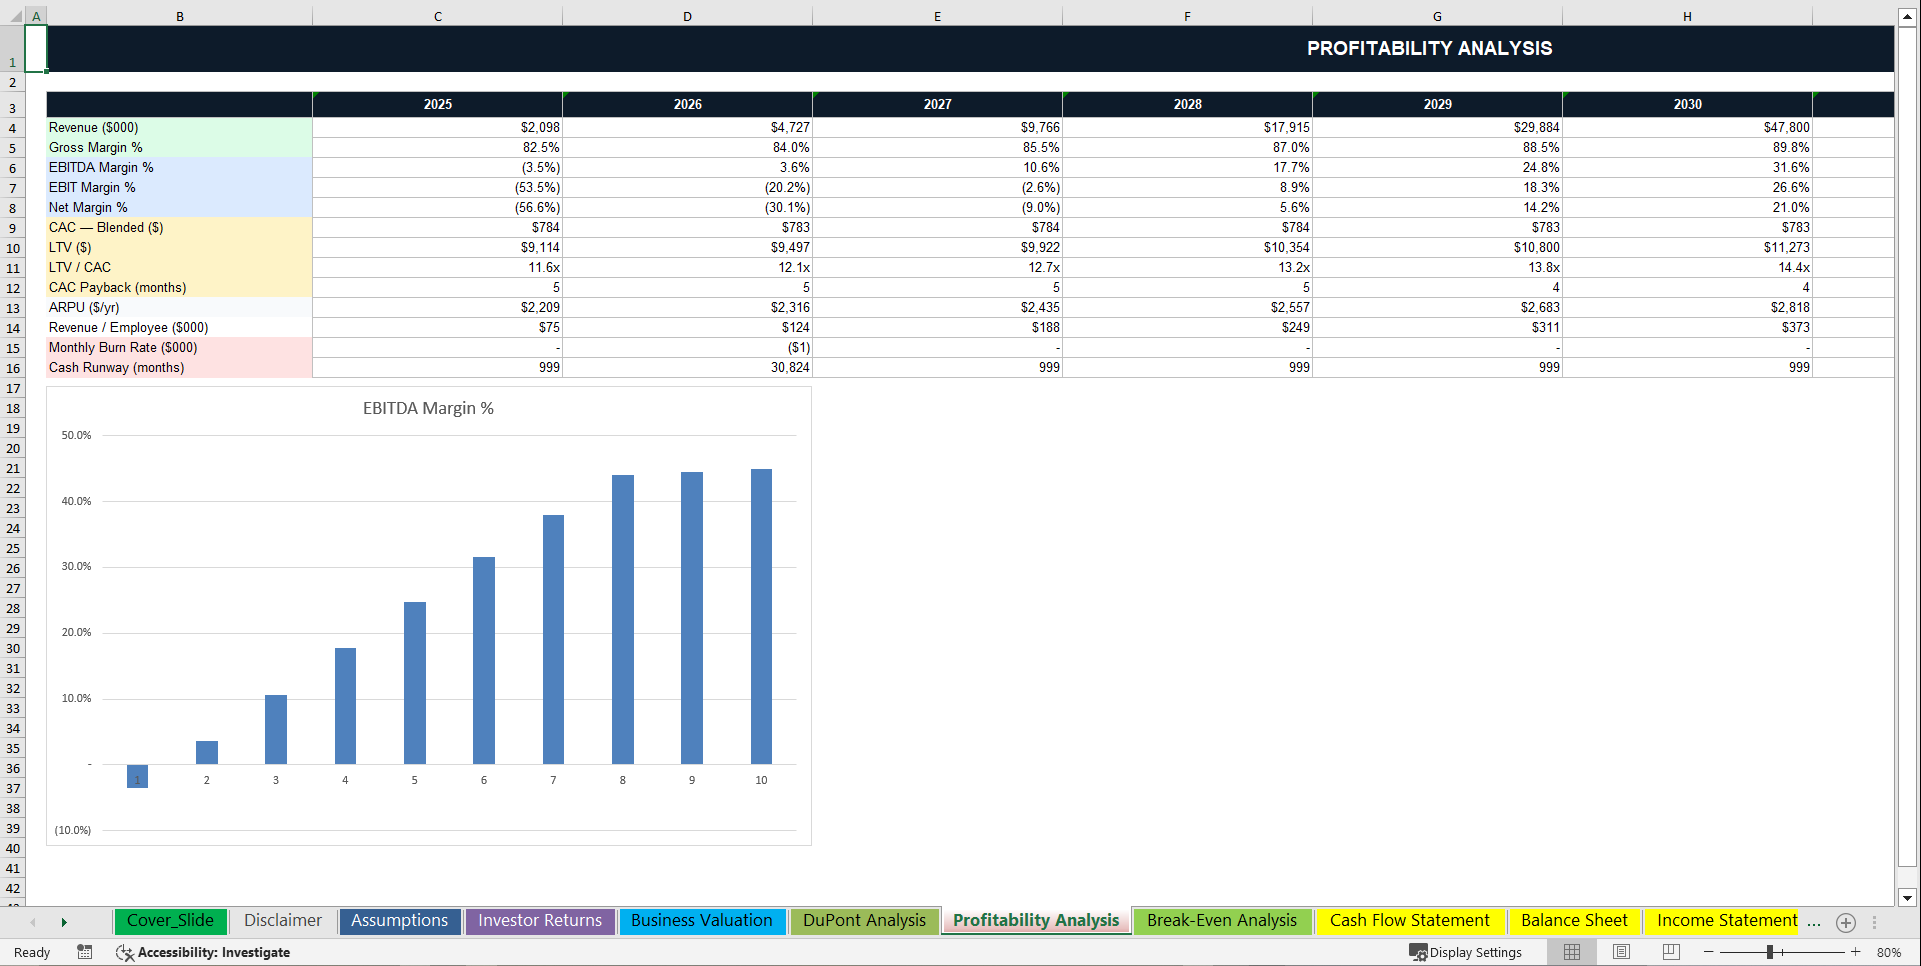
📈 Profitability Analysis – Full Unit Economics, Every Year
A dedicated profitability sheet tracks every metric that venture investors actually care about:
• Revenue
• Gross Margin %
• EBITDA Margin %
• EBIT Margin %
• Net Margin %
• CAC – Blended
• LTV
• LTV / CAC Ratio
• CAC Payback in Months
• ARPU – Annual Revenue per User
• Revenue per Employee
• Monthly Burn Rate
• Cash Runway in Months
Includes a live Margin Trends line chart across all 10 years.
🔬 DuPont Analysis – ROE Decomposed for Institutional Investors
A dedicated DuPont sheet breaks Return on Equity into its three components across all 10 years:
• Net Profit Margin
• Asset Turnover – Revenue divided by Total Assets
• Financial Leverage – Total Assets divided by Total Equity
• ROE – the fully decomposed product
• Return on Assets
• NOPAT – Net Operating Profit After Tax
• Invested Capital
• ROIC – Return on Invested Capital
💼 Business Valuation – Three Methods, One Sheet
1. Discounted Cash Flow (DCF)
Free cash flow for all 10 years individually discounted at your WACC. Terminal value calculated using the Gordon Growth Model. Outputs: Sum of PV of FCFs, Terminal Value, Enterprise Value, Equity Value after net debt, and Equity Value per Share.
2. Comparable Company Multiples
Year 10 LTM Revenue, EBITDA, and Net Income benchmarked against market multiples. EV/Revenue, EV/EBITDA, and P/E – each producing an independent enterprise value or equity value.
3. Venture Capital Method
Exit revenue multiplied by your exit multiple assumption. Total equity invested compared to exit proceeds. Outputs: Implied MOIC and Implied IRR.
🎯 Investor Returns & Cap Table – Model the Full Equity Journey
A dedicated investor returns sheet models the complete capitalization table:
• Seed, Series A, Series B, and Series C – each with investment amount, pre-money valuation, post-money valuation, ownership percentage, cumulative diluted ownership, MOIC, and IRR
• Four exit scenarios – Bear Case at 5x Revenue, Base Case at 8x, Bull Case at 12x, and Upside at 15x – each showing Exit Enterprise Value, Series A MOIC, and Series A IRR
Know exactly what every investor makes at every exit outcome before you walk into the room.
📈 Executive Dashboard – Investor-Ready in One Sheet
Year 10 headline KPIs pulled live from the model:
• Total Revenue
• EBITDA
• Net Income
• EBITDA Margin %
• Cash Balance
• Total Customers
• Gross Margin %
5 fully working dynamic charts – all linked live to the model:
1. Revenue & EBITDA – 10-year clustered column chart
2. Customer Growth – 10-year line chart with markers
3. Margin Trends – Gross Margin % and EBITDA Margin % dual-line chart
4. Cash Balance – 10-year column chart showing runway and accumulation
5. Net Income & Gross Profit – dual-line chart showing the profitability inflection
All charts update automatically when any assumption changes.
⚙️ Clean, Professional Assumption Structure – Everything in One Place
All model inputs centralized in the Assumptions sheet, organized into eleven clearly labeled sections:
1. General Settings – forecast start year, currency, units, company name
2. Customer Metrics – starting customers, new customer growth rates by stage, churn rate, tier splits
3. Pricing – Basic, Pro, and Enterprise monthly prices, annual price escalation, transaction fee rate and volume
4. Unit Economics – CAC by tier, LTV/CAC target, payback period target
5. Cost of Revenue Drivers – hosting, payment processing, support, and license percentages with annual efficiency improvement
6. Operating Expenses – R&D, S&M, and G&A percentage curves with mature-stage targets, SBC rate
7. Headcount & Personnel – average salary, annual raise rate, benefits and payroll tax multiplier, headcount and growth rate
8. CapEx & Depreciation – software CapEx base and growth rate, hardware CapEx base, asset useful lives
9. Working Capital – DSO, DPO, deferred revenue percentage, prepaid expenses
10. Financing – equity round sizes, venture debt terms, convertible note terms, interest rates
11. Valuation & Returns – WACC, terminal growth rate, exit multiples, exit year, tax rate
One change. Entire model updates.
🎯 Who This Financial Model Is Built For
✔ SaaS founders and startup CEOs building investor-ready financial projections
✔ CFOs and finance leads at Series A through Series C companies
✔ Venture capital analysts modeling portfolio company economics
✔ Private equity and growth equity investors evaluating software and platform businesses
✔ Investment bankers and M&A advisors preparing financial analysis for transactions
✔ Startup accelerators and incubators supporting portfolio company financial planning
✔ Lenders and venture debt providers assessing startup loan serviceability
✔ Strategic acquirers evaluating software company targets
✔ Business school students and analysts learning institutional-grade financial modeling
If your business acquires customers, generates recurring revenue, and needs to demonstrate financial credibility to the people writing the checks – this model was built for you.
The Complete Startup Financial Forecasting System
This model connects:
👥 Customer acquisition – cohort growth, churn, and tier dynamics
💰 Subscription revenue – Basic, Pro, and Enterprise tier economics
⚡ Transaction and usage revenue – volume-driven income streams
🔧 Cost of revenue – four operationally driven COGS lines with scale efficiency
👨💻 Operating expenses – R&D, S&M, and G&A with operating leverage curves
🏗 Capital expenditure and depreciation schedules
💼 Working capital and cash conversion dynamics
💳 Debt and equity financing structures
…into a single integrated 10-year financial forecasting system that updates automatically when any assumption changes.
Everything flows into:
📊 Clear, institutional-grade financial projections
📈 Operational KPIs and subscription business performance metrics
💰 Fully integrated Income Statement, Cash Flow Statement, and Balance Sheet
✅ 17 fully structured worksheets – nothing generic, everything startup-specific
✅ Operationally driven from real customer and cohort metrics – not growth rate assumptions
✅ Break-even, profitability, DuPont analysis, and three-method business valuation included
✅ Executive dashboard with live KPIs and 5 dynamic charts ready to share
✅ Fully linked 3-statement model – income statement, cash flow, and balance sheet
✅ Balance check built in – reconciles assets to liabilities and equity every year
✅ Institutional-grade color coding and formatting throughout
This is the startup financial model serious founders and investors actually use.
Key Words:
Strategy & Transformation, Growth Strategy, Strategic Planning, Strategy Frameworks, Innovation Management, Pricing Strategy, Core Competencies, Strategy Development, Business Transformation, Marketing Plan Development, Product Strategy, Breakout Strategy, Competitive Advantage, Mission, Vision, Values, Strategy Deployment & Execution, Innovation, Vision Statement, Core Competencies Analysis, Corporate Strategy, Product Launch Strategy, BMI, Blue Ocean Strategy, Breakthrough Strategy, Business Model Innovation, Business Strategy Example, Corporate Transformation, Critical Success Factors, Customer Segmentation, Customer Value Proposition, Distinctive Capabilities, Enterprise Performance Management, KPI, Key Performance Indicators, Market Analysis, Market Entry Example, Market Entry Plan, Market Intelligence, Market Research, Market Segmentation, Market Sizing, Marketing, Michael Porter's Value Chain, Organizational Transformation, Performance Management, Performance Measurement, Platform Strategy, Product Go-to-Market Strategy, Reorganization, Restructuring, SWOT, SWOT Analysis, Service 4.0, Service Strategy, Service Transformation, Strategic Analysis, Strategic Plan Example, Strategy Deployment, Strategy Execution, Strategy Frameworks Compilation, Strategy Methodologies, Strategy Report Example, Value Chain, Value Chain Analysis, Value Innovation, Value Proposition, Vision Statement, Corporate Strategy, Business Development, Business plan pdf, business plan, PDF, Business Plan DOC, Business Plan Template, PPT, Market strategy playbook, strategic market planning, competitive analysis tools, market segmentation frameworks, growth strategy templates, product positioning strategy, market execution toolkit, strategic alignment playbook, KPI and OKR frameworks, business growth strategy guide, cross-functional strategy templates, market risk management, market strategy PowerPoint doc, guide, ebook, e-book ,McKinsey Change Playbook, Organizational change management toolkit, Change management frameworks 2025, Influence model for change, Change leadership strategies, Behavioral change in organizations, Change management PowerPoint templates, Transformational leadership in change, supply chain KPIs, supply chain KPI toolkit, supply chain PowerPoint template, logistics KPIs, procurement KPIs, inventory management KPIs, supply chain performance metrics, manufacturing KPIs, supply chain dashboard, supply chain strategy KPIs, reverse logistics KPIs, sustainability KPIs in supply chain, financial supply chain KPIs, warehouse KPIs, digital supply chain KPIs, 1200 KPIs, supply chain scorecard, KPI examples, supply chain templates, Corporate Finance SOPs, Finance SOP Excel Template, CFO Toolkit, Finance Department Procedures, Financial Planning SOPs, Treasury SOPs, Accounts Payable SOPs, Accounts Receivable SOPs, General Ledger SOPs, Accounting Policies Template, Internal Controls SOPs, Finance Process Standardization, Finance Operating Procedures, Finance Department Excel Template, FP&A Process Documentation, Corporate Finance Template, Finance SOP Toolkit, CFO Process Templates, Accounting SOP Package, Tax Compliance SOPs, Financial Risk Management Procedures.
NOTE: Our digital products are sold on an "as is" basis, making returns and refunds unavailable post-download. Please preview and inquire before purchasing. Please contact us before purchasing if you have any questions! This policy aligns with the standard Flevy Terms of Usage.
Got a question about the product? Email us at support@flevy.com or ask the author directly by using the "Ask the Author a Question" form. If you cannot view the preview above this document description, go here to view the large preview instead.
Source: Best Practices in Integrated Financial Model Excel: Generic Startup 10-Year Advanced Financial Model Excel (XLSX) Spreadsheet, SB Consulting
ABOUT THE AUTHOR
SB Consulting is dedicated to empowering businesses to communicate their ideas with impact. This consulting firm specializes in teaching organizations how to create effective corporate and management presentations. With training from top-tier global consulting firms, including McKinsey, BCG, and Porsche Consulting, extensive expertise in presentation design and ... [read more]
Ask the Author a Question
You must be logged in to contact the author.
