
Football Stadium Development & Operations Financial Model – Excel XLSX
Excel (XLSX)
BENEFITS OF THIS DOWNLOADABLE EXCEL DOCUMENT
- Provides a complete framework for developing, financing, and operating an institutional-grade football stadium -- from groundbreaking to 10-year exit.
- Models every revenue stream, construction cost, and debt obligation a stadium investor, developer, or operator needs to make confident capital allocation decisions.
- Delivers a fully integrated 3-statement financial model built around how major sports venues actually generate revenue, service debt, and return capital to investors.
SPORT MANAGEMENT EXCEL DESCRIPTION
Curated by McKinsey-trained Executives
⚽ Football Stadium Development & Operations Model | 10-Year Institutional Financial Forecast
Turn your stadium vision into a fundable, bankable, investor-ready business – modeled with the precision of a top-tier infrastructure fund.
Whether you're a sports franchise owner acquiring naming rights to your first venue, a private equity investor evaluating a stadium concession or hospitality deal, a municipal authority financing a new civic sports complex, a real estate developer unlocking mixed-use potential around a major venue, or an infrastructure fund building a world-class sports asset portfolio – this fully integrated 3-Statement Financial Model gives you the analytical firepower to plan, pitch, fund, and profit at institutional scale.
💡 What's Inside
This model covers every financial dimension of developing and operating a major football stadium – from groundbreaking to 10-year exit valuation. Built on Wall Street Financial Modeling Best Practices, it's dynamic, fully linked, and ready to customize for your specific venue size, revenue mix, and capital structure.
📥 Inputs
• 🏟️ Stadium & Development Assumptions – Seating capacity, VIP suite count, parking spaces, construction cost base, 36-month build duration, useful life schedule, and opening year configuration
• 💰 11-Stream Revenue Assumptions – Ticket sales (with attendance rate and price growth), VIP & hospitality suites, naming rights, sponsorships, broadcasting fees, concessions (F&B), merchandise, stadium tours, parking, concerts & events, and advertising panels – every revenue driver modeled individually
• 🎟️ Attendance Model – Year-by-year attendance rate inputs (stadium ramp-up from Year 1 through Year 10), home matches per season, non-match events, total annual attendee projections, and per-event revenue benchmarks
• 🏗️ Development Budget – 15-line itemized construction budget (land, design, steel, roof, seating, pitch, technology, security, parking, fit-out, PM), plus contingency, financing fees, and interest during construction – all linked to the Sources & Uses statement
• 📐 36-Month Construction S-Curve – Monthly CapEx drawdown modeled on a realistic S-curve distribution, with debt drawdown, equity contributions, and interest during construction tracked month-by-month
• 🏦 Capital Structure & Financing – Senior debt (60% LTV), equity (40%), annuity repayment schedule, grace period modeling, financing fees, and a full 20-year debt amortization schedule linked to all three financial statements
• 👥 Operating Cost Structure – Stadium staff, security, maintenance, utilities, insurance, marketing, administration, pitch maintenance, event operations, and technology – all inflation-adjusted and operationally driven
• 📊 Scenario Flexibility – Adjust any assumption (attendance, ticket price, construction cost, interest rate, revenue growth) to instantly stress-test your project economics
📤 Outputs
• 📈 10-Year 3-Statement Financial Model – Fully integrated Income Statement, Balance Sheet & Cash Flow Statement, linked and auto-balancing across all 10 operating years
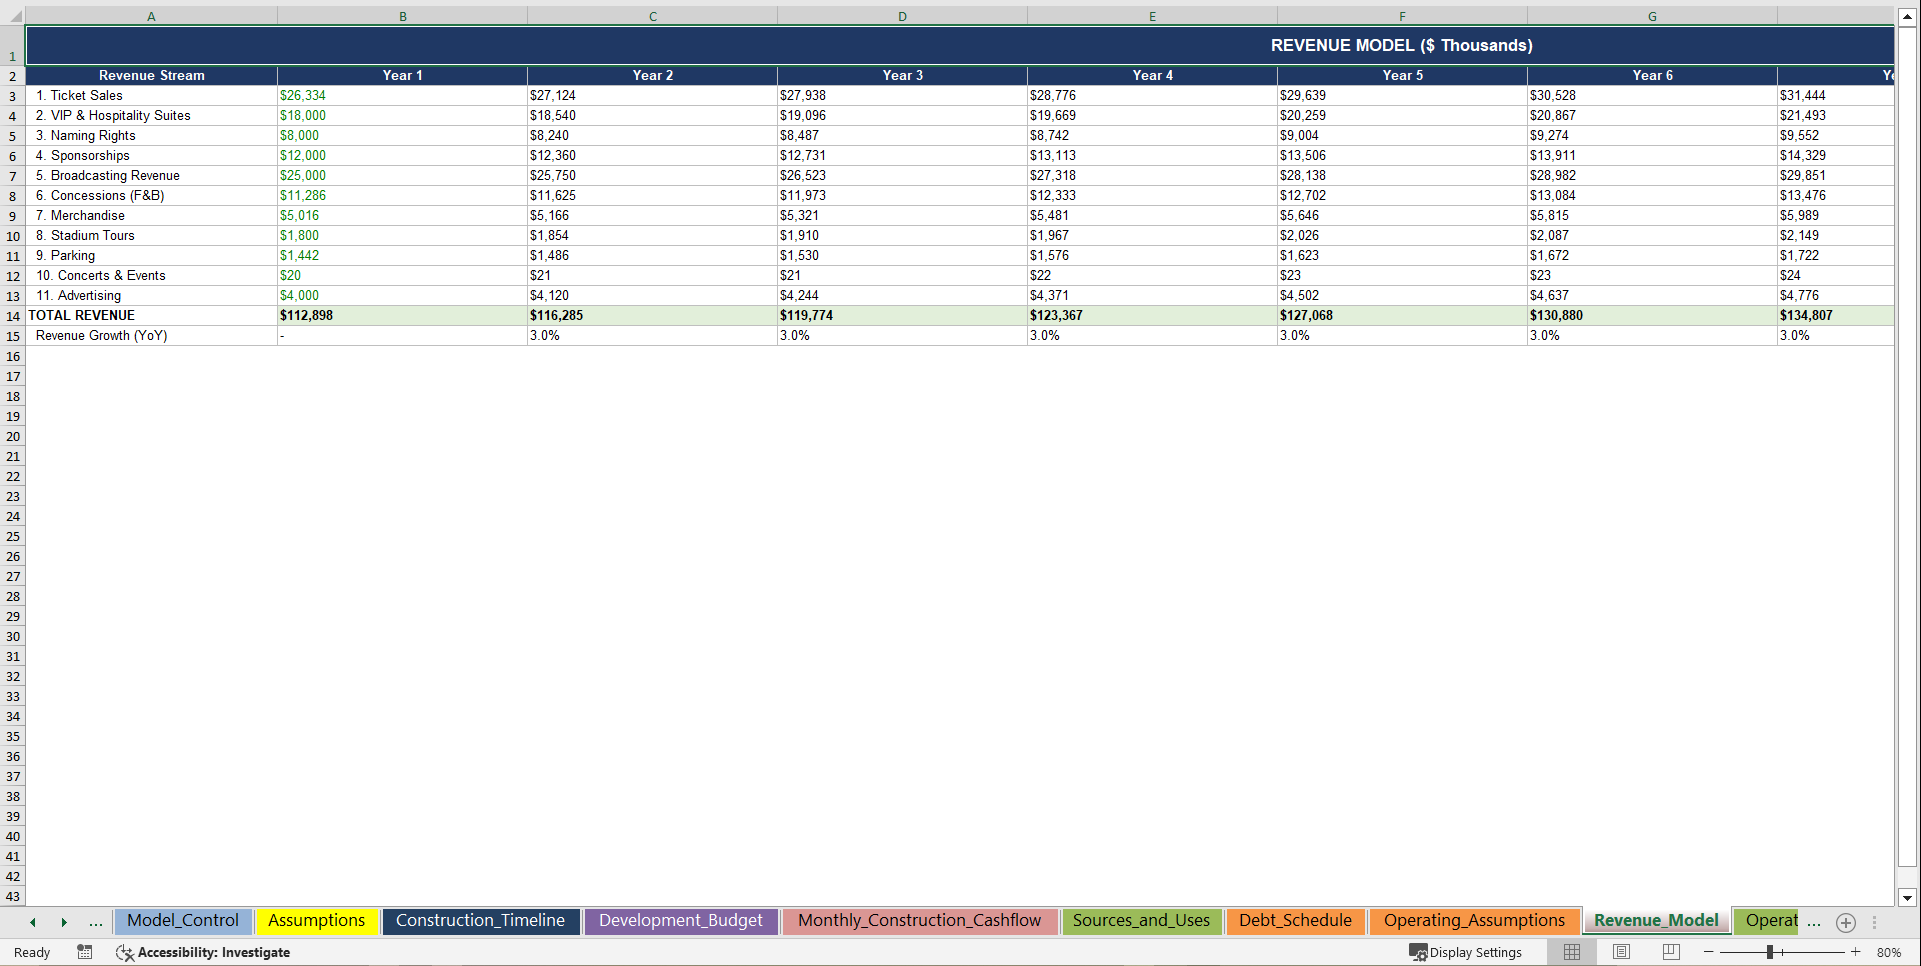
• 🏟️ 11-Stream Revenue Breakdown – Annual projections for every revenue line with growth rates, % mix analysis, and year-over-year growth tracking
• 🎟️ Attendance & Operations Model – Year-by-year load factor curves, total annual attendees, revenue per seat, revenue per event, and match-day vs. event-day split
• 🏗️ Development Budget & S-Curve – Full 15-category construction budget, contingency and IDC modeling, and a 36-month monthly cash flow with debt/equity drawdown tracking
• 🔁 Debt Schedule – Opening balance, drawdown, grace period, annuity principal repayment, interest expense, closing balance, DSCR, and LLCR – all linked into the financials
• 🏛️ CapEx & Depreciation Schedule – Initial construction asset, annual maintenance CapEx, straight-line depreciation over 30 years, accumulated depreciation, and net PP&E tracking
• 💼 Working Capital Model – Receivables, inventory, payables, and year-on-year working capital movements fully integrated into the cash flow statement
• 📊 Project & Investor Returns – Project IRR, Project NPV, Equity IRR, Equity MOIC, average dividend yield, and total distributions – everything an infrastructure fund or equity sponsor needs
• 🔍 KPI Dashboard – 15+ KPIs across Development (cost per seat, total dev cost), Operations (revenue per seat, EBITDA margin, attendance), and Finance (DSCR, Debt/EBITDA, interest coverage)
• 📐 Executive Dashboard – 5 dynamic charts (revenue by segment, revenue & EBITDA trend, EBITDA margin, debt balance, attendance curve) plus 8 live KPI tiles – all auto-updating when assumptions change
🏆 Why This Model Stands Out
✅ Fully integrated – every sheet talks to every other sheet. Change one assumption and everything updates instantly across all 20 tabs
✅ Investor-ready – structured for pitching to infrastructure funds, private equity, municipal bond issuers, naming rights sponsors, and strategic acquirers
✅ Operator-realistic – built around how football stadiums actually generate revenue, not recycled generic real estate or SaaS templates
✅ Construction-grade – 36-month S-curve drawdown, monthly IDC tracking, and a Sources & Uses that must balance before you model a single operating year
✅ Color-coded for clarity – blue inputs, black formulas, green cross-sheet links – industry-standard financial modeling conventions throughout
✅ Built-in Gantt chart – visual 36-month construction programme with phase-by-phase colour coding, quarter headers, and an active-phases-per-month tracker
✅ Fully unlocked – no protected sheets, no black-box logic. Own it, customize it, present it with confidence
📋 Model Structure (20 Sheets)
• 🎛️ Model_Control – Version control, currency settings, and a full sheet index before you touch a single input
• 📌 Assumptions – All 40+ blue-font driver cells (capacity, financing, ticket pricing, revenue growth, cost inflation, CapEx rates, dividend policy) – the single source of truth that flows into every downstream calculation
• 📅 Construction_Timeline – Visual 36-month Gantt chart with colour-coded phase bars, quarter headers, and a live active-phases-per-month intensity tracker
• 🏗️ Development_Budget – All 15 construction cost categories from land acquisition through project management, with auto-calculated contingency and interest during construction
• 📆 Monthly_Construction_Cashflow – Realistic S-curve spreading your total development cost across 36 months, with parallel debt drawdown and equity contribution tracking
• ⚖️ Sources_and_Uses – Clean, balanced funding statement confirming your senior debt and equity together equal your total development cost to the dollar
• 🏦 Debt_Schedule – Full 20-year amortization with grace period, annuity repayment, interest expense, DSCR, and LLCR – all wired into the income statement and cash flow
• 🏟️ Operating_Assumptions – Annual capacity, attendance rates, match counts, event counts, and ticket price growth modeled year by year
• 💰 Revenue_Model – All 11 revenue streams projected independently (tickets, VIP suites, naming rights, sponsorships, broadcasting, concessions, merchandise, tours, parking, events, advertising) – each with its own growth logic
• 💸 Operating_Costs – All 12 expense lines from staff wages to pitch maintenance, with COGS items tied directly to revenue and fixed costs compounding at your chosen inflation rate
• 🔄 Working_Capital – Receivables, inventory, and payables calculated from your operating model, with the annual delta fed directly into the cash flow statement
• 🔧 Capex – Initial construction asset separated from annual maintenance CapEx, both feeding into the depreciation schedule
• 📉 Depreciation – Straight-line over 30 years, tracking gross PP&E, accumulated depreciation, and net book value for the balance sheet
• 📊 Income_Statement – Revenue through gross profit, EBITDA, EBIT, interest, tax, and net income – fully linked, zero hardcoding
• 💵 Cash_Flow_Statement – Net income through operating, investing, and financing activities to a closing cash balance that feeds directly into the balance sheet
• 🧾 Balance_Sheet – Auto-balances every year with a built-in check formula – assets must equal liabilities plus equity, no exceptions
• 📐 Project_Returns – Project IRR, Project NPV, and payback period calculated from your free cash flow stream
• 👤 Investor_Returns – Equity IRR, MOIC, average annual dividend yield, and total distributions across the 10-year hold
• 📋 KPIs – 15+ performance indicators across development, operations, and finance aggregated into a single reference sheet
• 🖥️ Dashboard – 5 dynamic charts and 8 live KPI tiles that refresh the moment you change any assumption
*"Stop guessing at naming rights valuations, suite pricing, and event revenue. Start modeling. Know exactly when your stadium breaks even, what a new sponsorship deal is worth to your IRR, what your debt service coverage looks like in a low-attendance year – and what your stadium is worth to an acquirer at Year 10."*
Key Words:
Strategy & Transformation, Growth Strategy, Strategic Planning, Strategy Frameworks, Innovation Management, Pricing Strategy, Core Competencies, Strategy Development, Business Transformation, Marketing Plan Development, Product Strategy, Breakout Strategy, Competitive Advantage, Mission, Vision, Values, Strategy Deployment & Execution, Innovation, Vision Statement, Core Competencies Analysis, Corporate Strategy, Product Launch Strategy, BMI, Blue Ocean Strategy, Breakthrough Strategy, Business Model Innovation, Business Strategy Example, Corporate Transformation, Critical Success Factors, Customer Segmentation, Customer Value Proposition, Distinctive Capabilities, Enterprise Performance Management, KPI, Key Performance Indicators, Market Analysis, Market Entry Example, Market Entry Plan, Market Intelligence, Market Research, Market Segmentation, Market Sizing, Marketing, Michael Porter's Value Chain, Organizational Transformation, Performance Management, Performance Measurement, Platform Strategy, Product Go-to-Market Strategy, Reorganization, Restructuring, SWOT, SWOT Analysis, Service 4.0, Service Strategy, Service Transformation, Strategic Analysis, Strategic Plan Example, Strategy Deployment, Strategy Execution, Strategy Frameworks Compilation, Strategy Methodologies, Strategy Report Example, Value Chain, Value Chain Analysis, Value Innovation, Value Proposition, Vision Statement, Corporate Strategy, Business Development, Business plan pdf, business plan, PDF, Business Plan DOC, Business Plan Template, PPT, Market strategy playbook, strategic market planning, competitive analysis tools, market segmentation frameworks, growth strategy templates, product positioning strategy, market execution toolkit, strategic alignment playbook, KPI and OKR frameworks, business growth strategy guide, cross-functional strategy templates, market risk management, market strategy PowerPoint doc, guide, ebook, e-book ,McKinsey Change Playbook, Organizational change management toolkit, Change management frameworks 2025, Influence model for change, Change leadership strategies, Behavioral change in organizations, Change management PowerPoint templates, Transformational leadership in change, supply chain KPIs, supply chain KPI toolkit, supply chain PowerPoint template, logistics KPIs, procurement KPIs, inventory management KPIs, supply chain performance metrics, manufacturing KPIs, supply chain dashboard, supply chain strategy KPIs, reverse logistics KPIs, sustainability KPIs in supply chain, financial supply chain KPIs, warehouse KPIs, digital supply chain KPIs, 1200 KPIs, supply chain scorecard, KPI examples, supply chain templates, Corporate Finance SOPs, Finance SOP Excel Template, CFO Toolkit, Finance Department Procedures, Financial Planning SOPs, Treasury SOPs, Accounts Payable SOPs, Accounts Receivable SOPs, General Ledger SOPs, Accounting Policies Template, Internal Controls SOPs, Finance Process Standardization, Finance Operating Procedures, Finance Department Excel Template, FP&A Process Documentation, Corporate Finance Template, Finance SOP Toolkit, CFO Process Templates, Accounting SOP Package, Tax Compliance SOPs, Financial Risk Management Procedures.
NOTE: Our digital products are sold on an "as is" basis, making returns and refunds unavailable post-download. Please preview and inquire before purchasing. Please contact us before purchasing if you have any questions! This policy aligns with the standard Flevy Terms of Usage.
Got a question about the product? Email us at support@flevy.com or ask the author directly by using the "Ask the Author a Question" form. If you cannot view the preview above this document description, go here to view the large preview instead.
Source: Best Practices in Sport Management, Integrated Financial Model Excel: Football Stadium Development & Operations Financial Model Excel (XLSX) Spreadsheet, SB Consulting
ABOUT THE AUTHOR
SB Consulting is dedicated to empowering businesses to communicate their ideas with impact. This consulting firm specializes in teaching organizations how to create effective corporate and management presentations. With training from top-tier global consulting firms, including McKinsey, BCG, and Porsche Consulting, extensive expertise in presentation design and ... [read more]
Ask the Author a Question
You must be logged in to contact the author.
