
 Click main image to view in full screen. Unlock all 20 preview images:
Food Truck Fleet Profitability & 5-Year Financial Model – Excel XLSX
Excel (XLSX) + supplemental PDF


BENEFITS OF THIS DOWNLOADABLE EXCEL DOCUMENT
- Connects truck allocation, location, event, menu and channel economics to a five-year three-statement forecast.
- Provides decision-ready scenario, sensitivity, break-even, capacity, expansion, debt and DSCR analysis in one editable workbook.
- Gives operators and advisers four specialist dashboards plus an executive dashboard for faster profitability and fleet decisions.
FINANCIAL MODELING EXCEL DESCRIPTION
Food Truck Fleet Profitability & 5-Year Financial Model
This Excel model is built for food truck founders, existing operators, multi-truck fleets, mobile catering businesses, consultants, lenders and investors who need more than a generic annual forecast. It connects the operating decisions that determine profitability – truck allocation, location selection, event acceptance, menu economics, service capacity, labor, delivery channels and fleet expansion – with a fully linked five-year financial model.
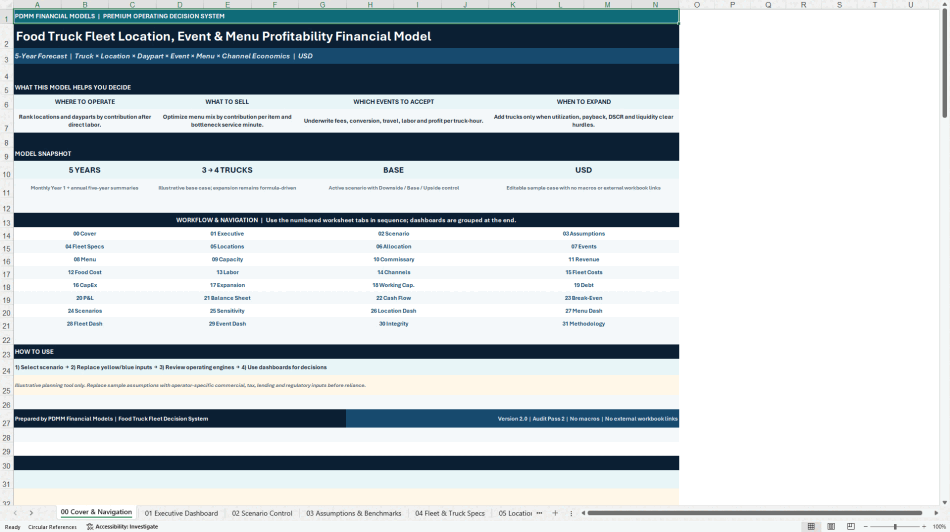
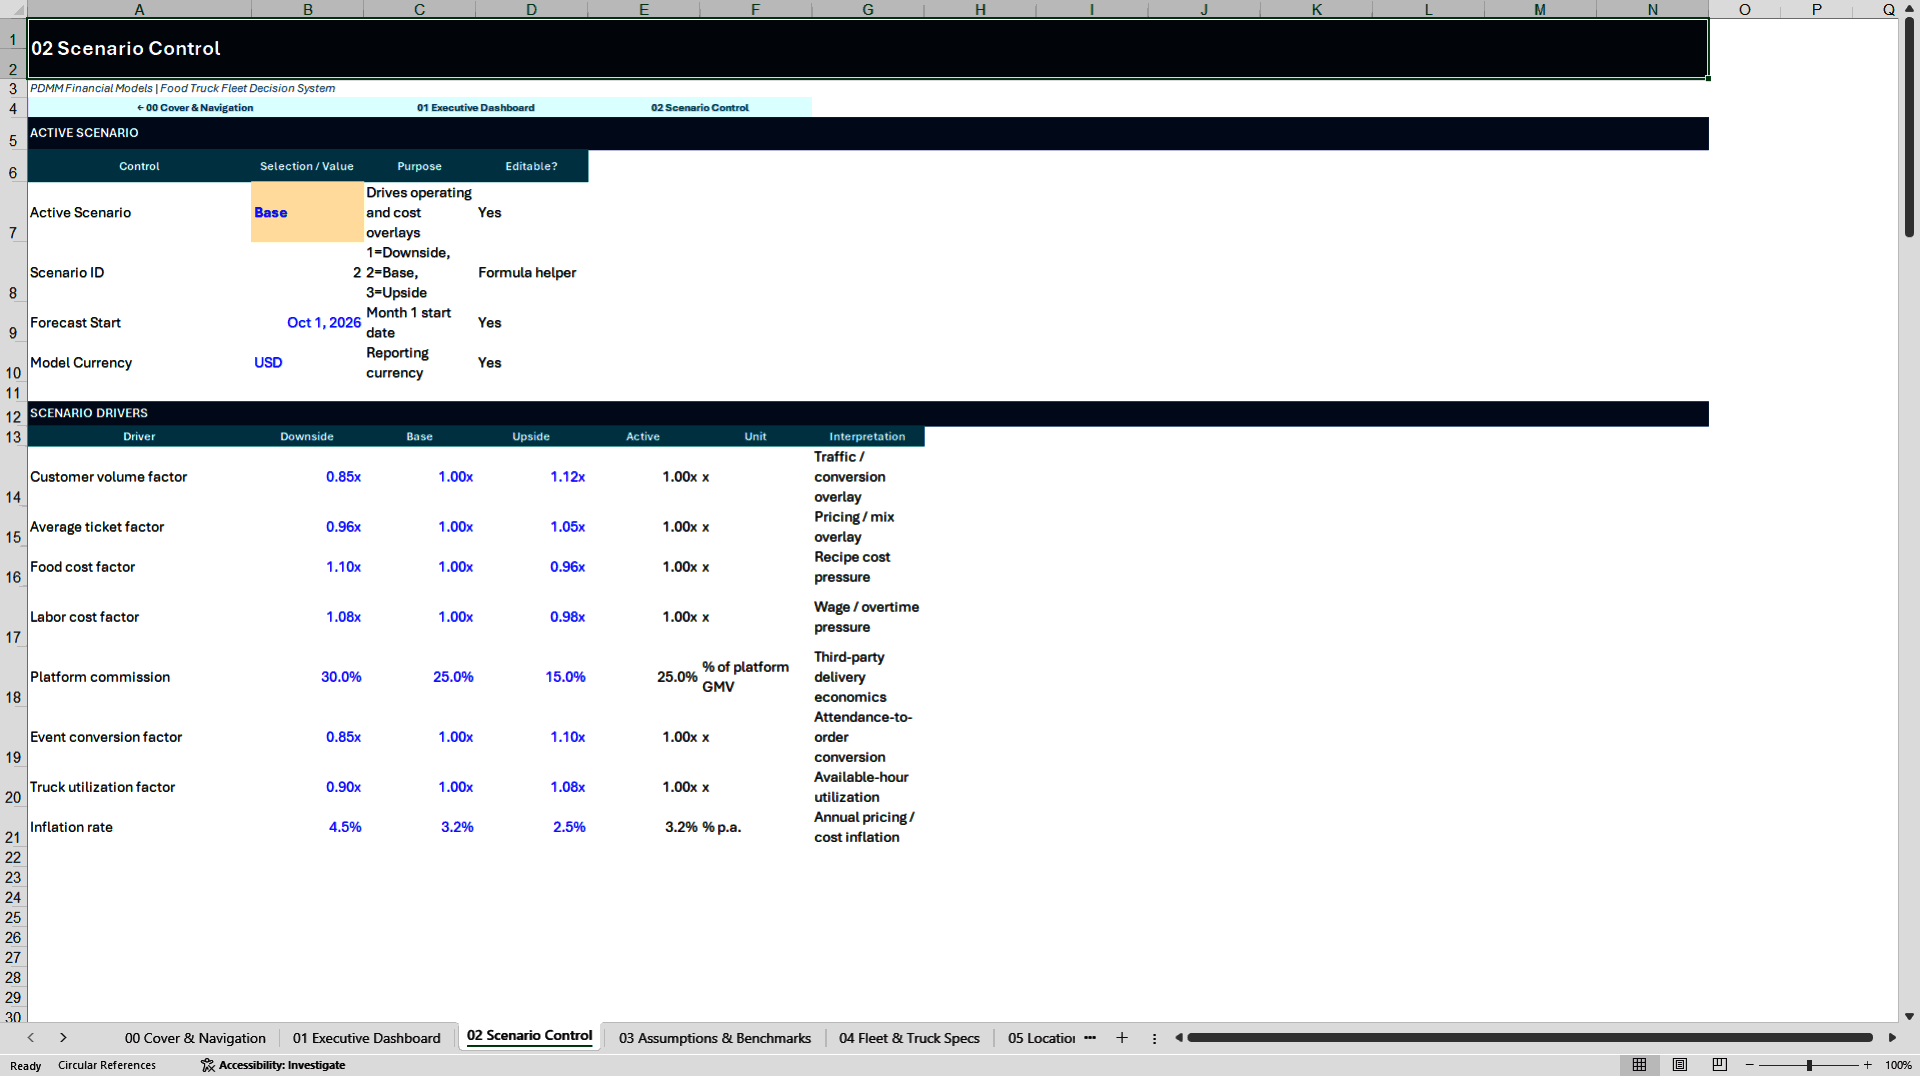
The workbook contains 32 worksheets and starts with a structured cover, navigation and scenario control. Centralized assumptions allow the user to replace the fictional sample data with operator-specific commercial and operating inputs. Inputs cover ticket levels, food and packaging costs, labor, truck costs, working capital, debt, cash guardrails, utilization and expansion hurdles, commissary capacity, overhead, delivery mix, event thresholds and opening financial balances.
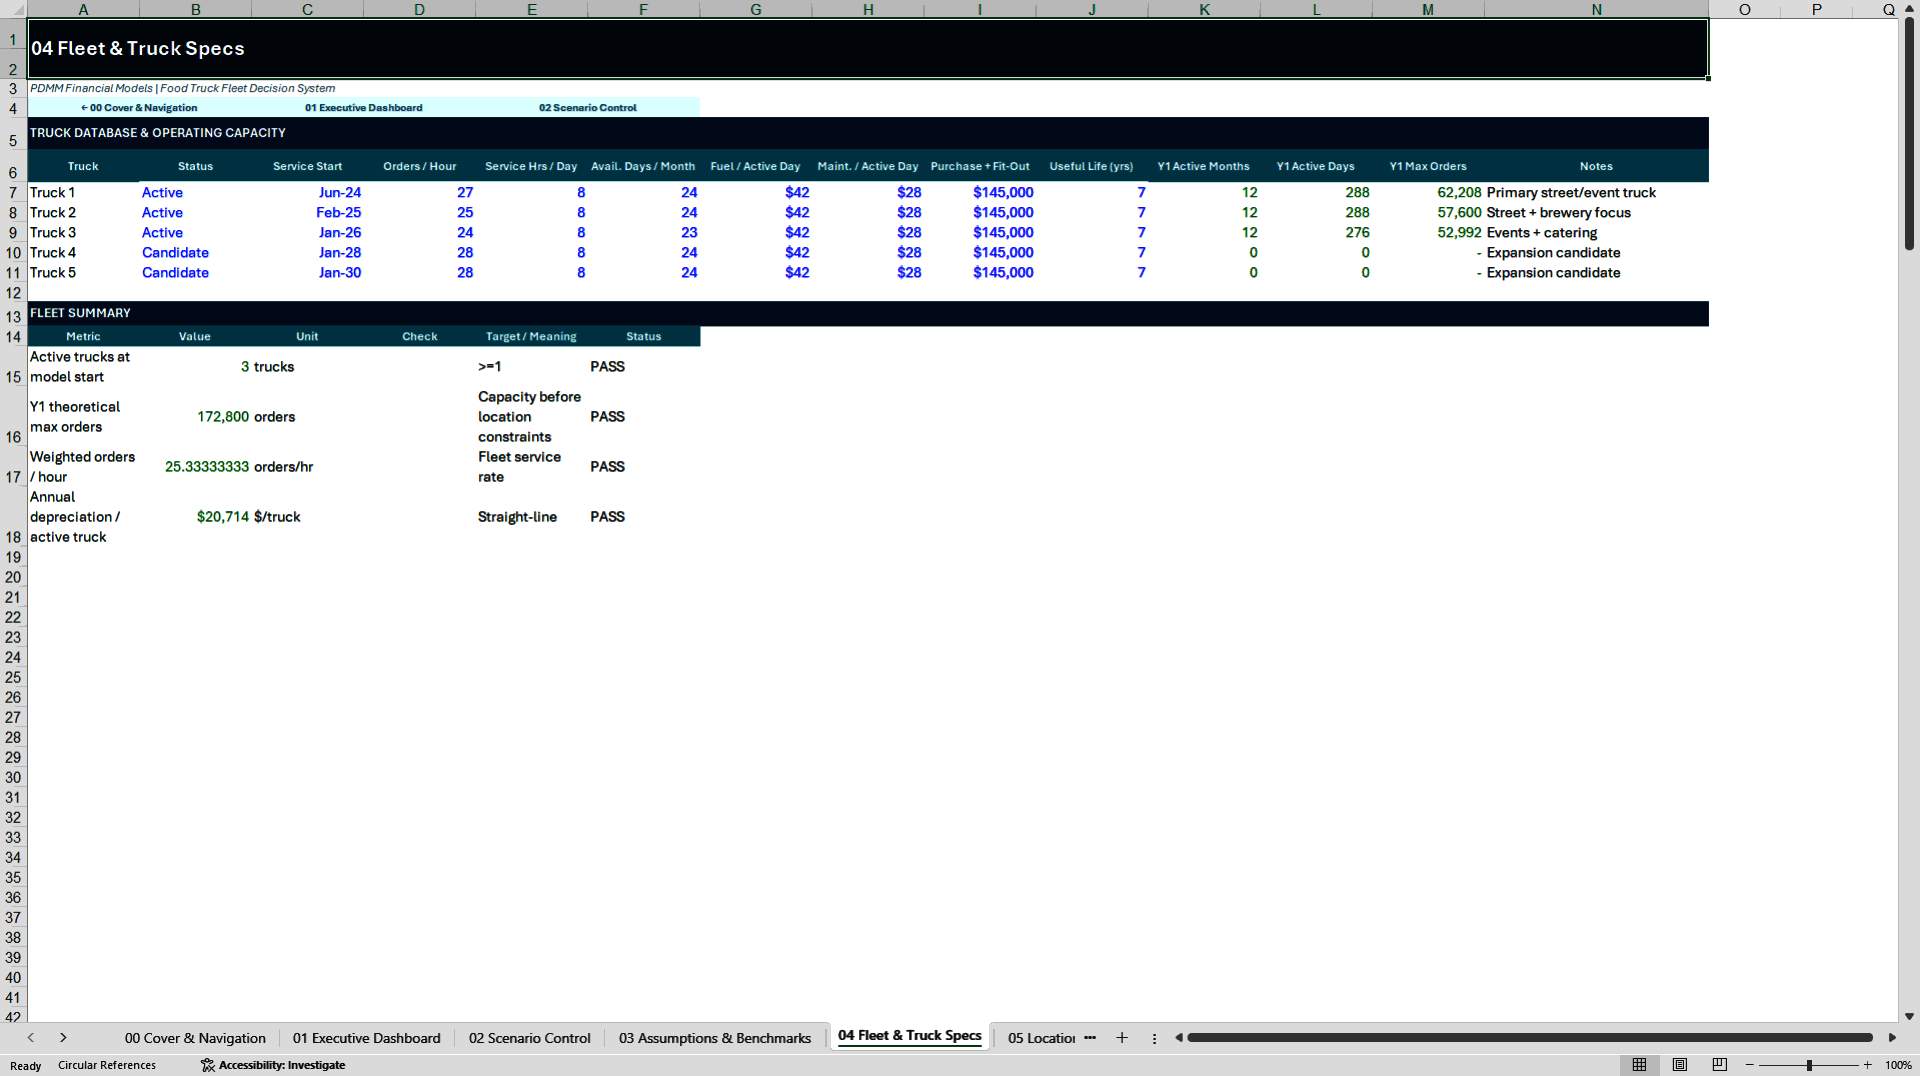
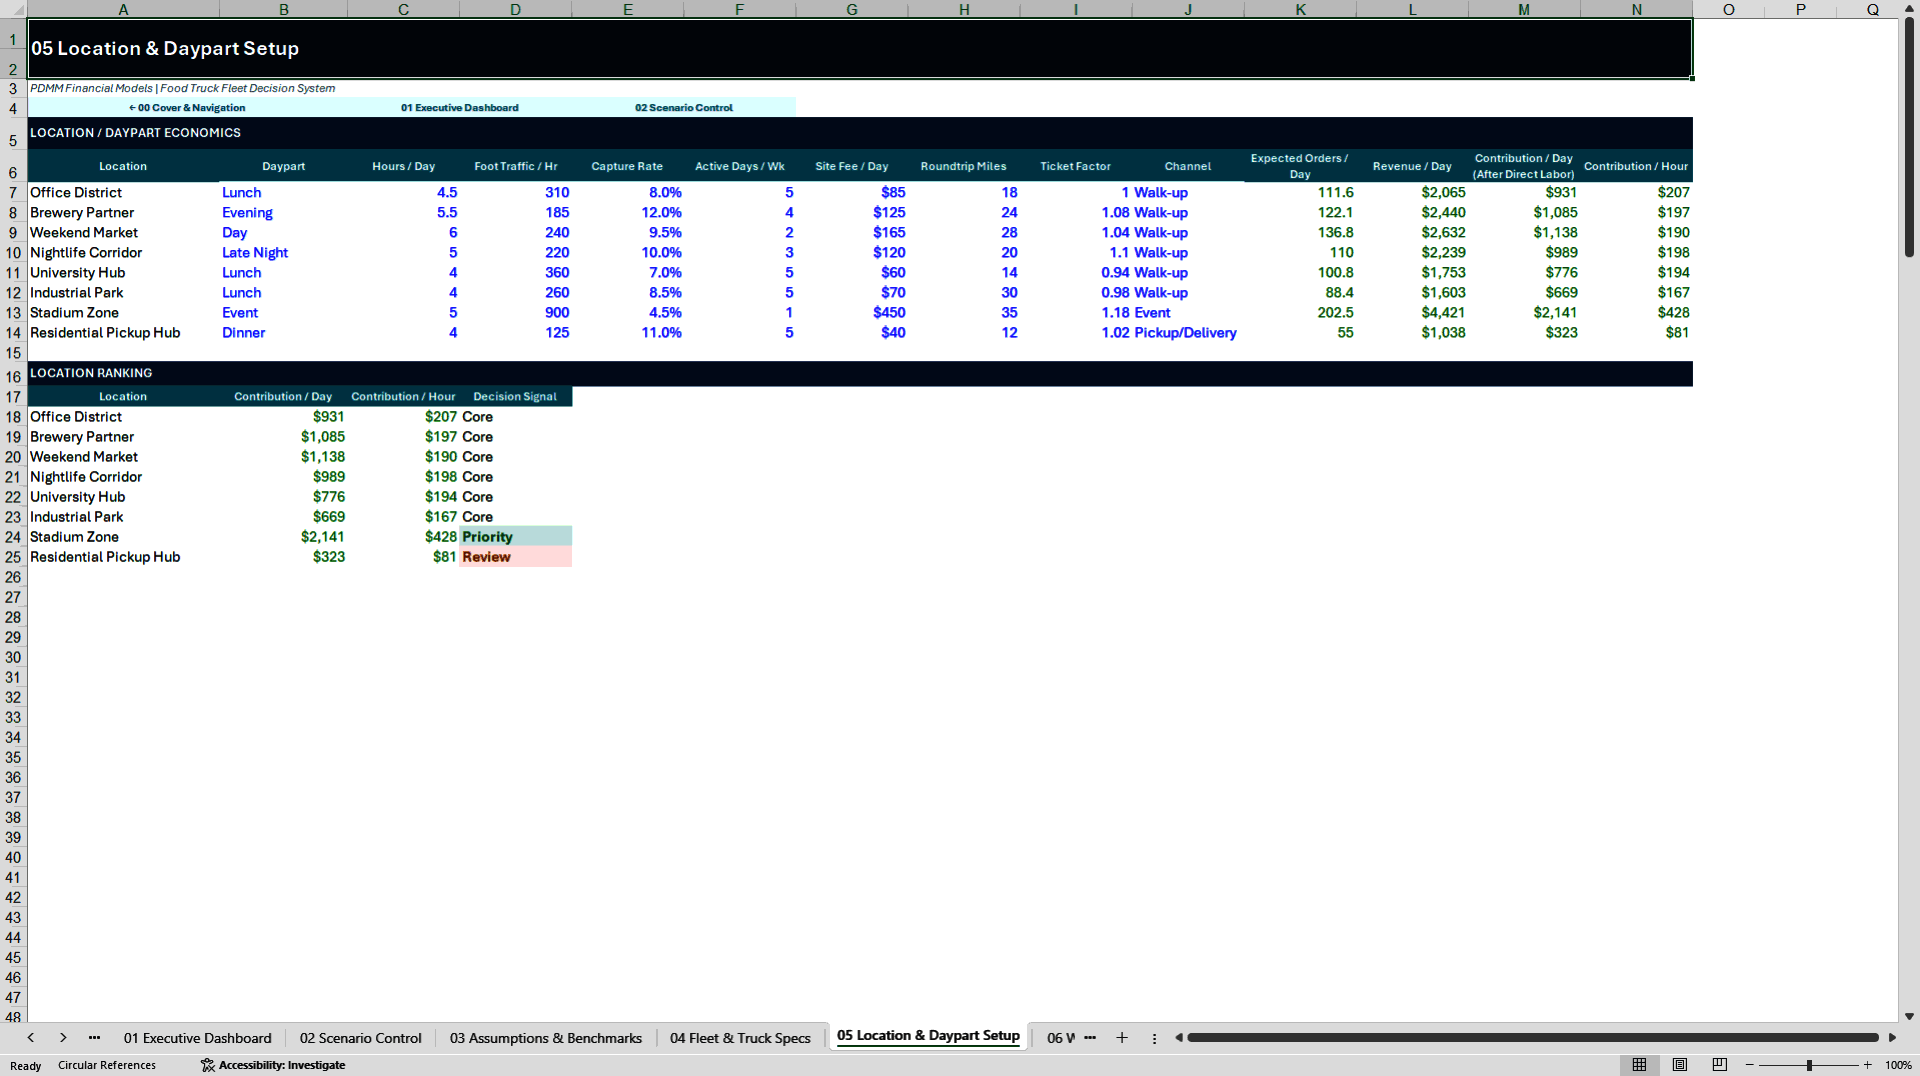
The fleet and truck schedule provides the operating base for the model. A location and daypart engine evaluates service windows using operating hours, foot traffic, capture rates, active days, site fees, mileage, ticket factors and channels. A weekly allocation schedule then converts those service choices into scheduled truck activity.
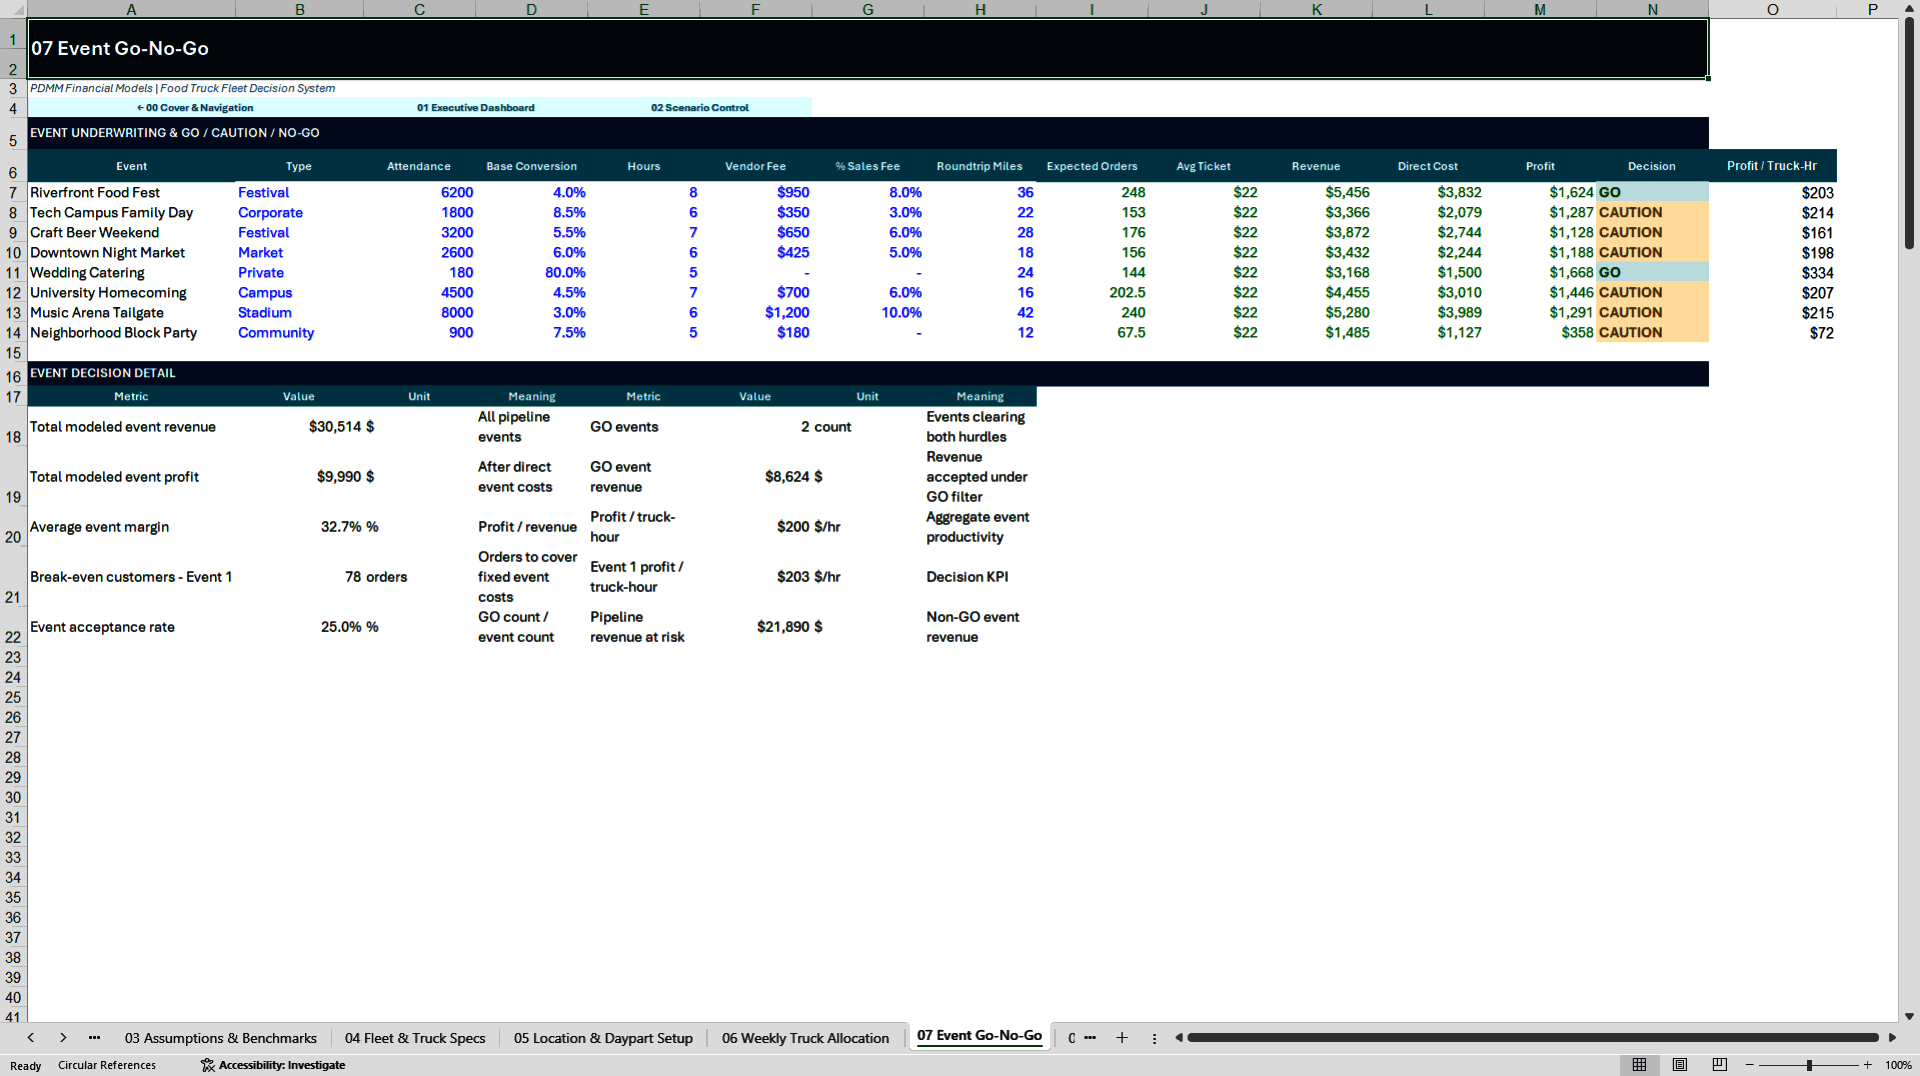
The event underwriting engine evaluates festivals, corporate events, markets, private catering, campus events and stadium opportunities. It calculates expected orders, revenue, vendor and sales fees, travel, direct labor, profit and profit per truck-hour. Each event receives a formula-driven GO, CAUTION or NO-GO signal based on the model's profit and truck-hour thresholds.
Menu engineering is modeled at SKU level. Ten fictional menu items demonstrate selling price, recipe cost, packaging, sales mix, preparation time, service time, contribution per item and contribution per service minute. The portfolio summary calculates weighted menu price, weighted recipe cost, weighted contribution and weighted service time, helping the user identify products that use limited service capacity effectively.
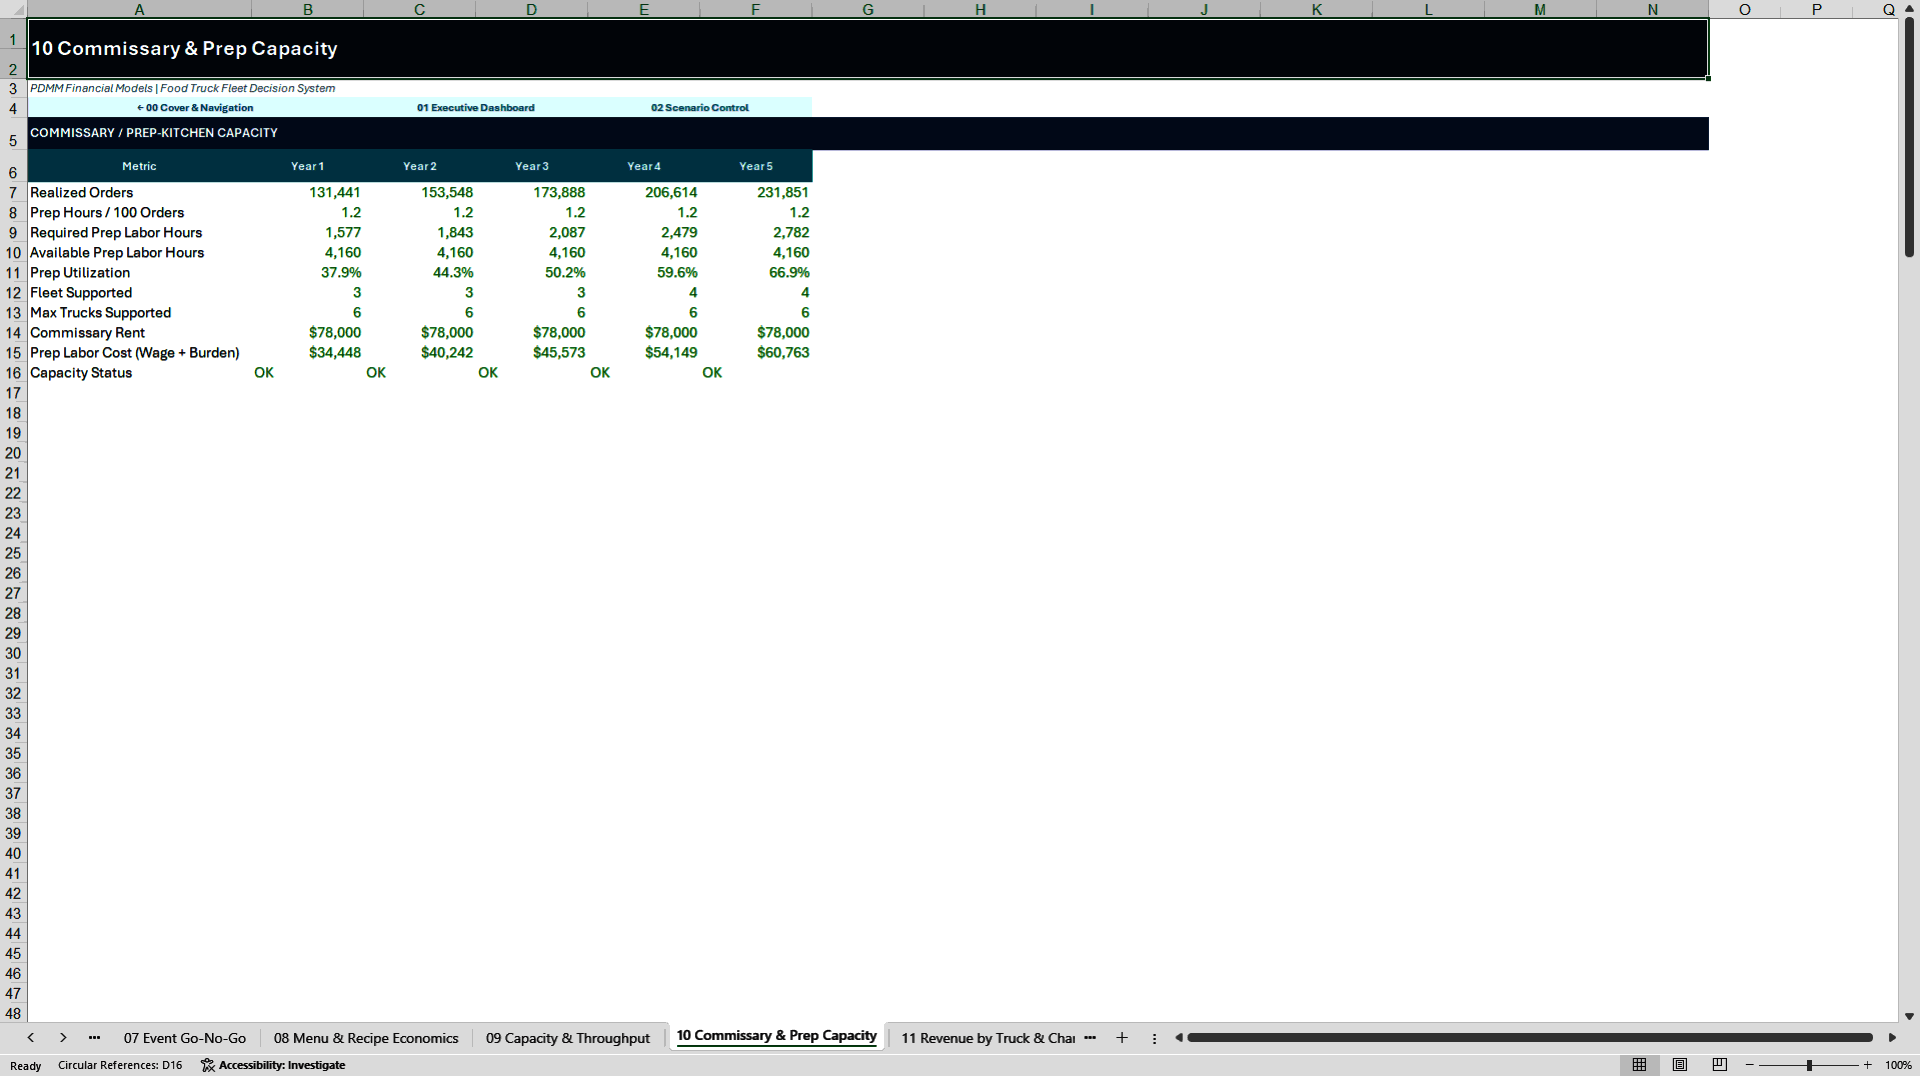
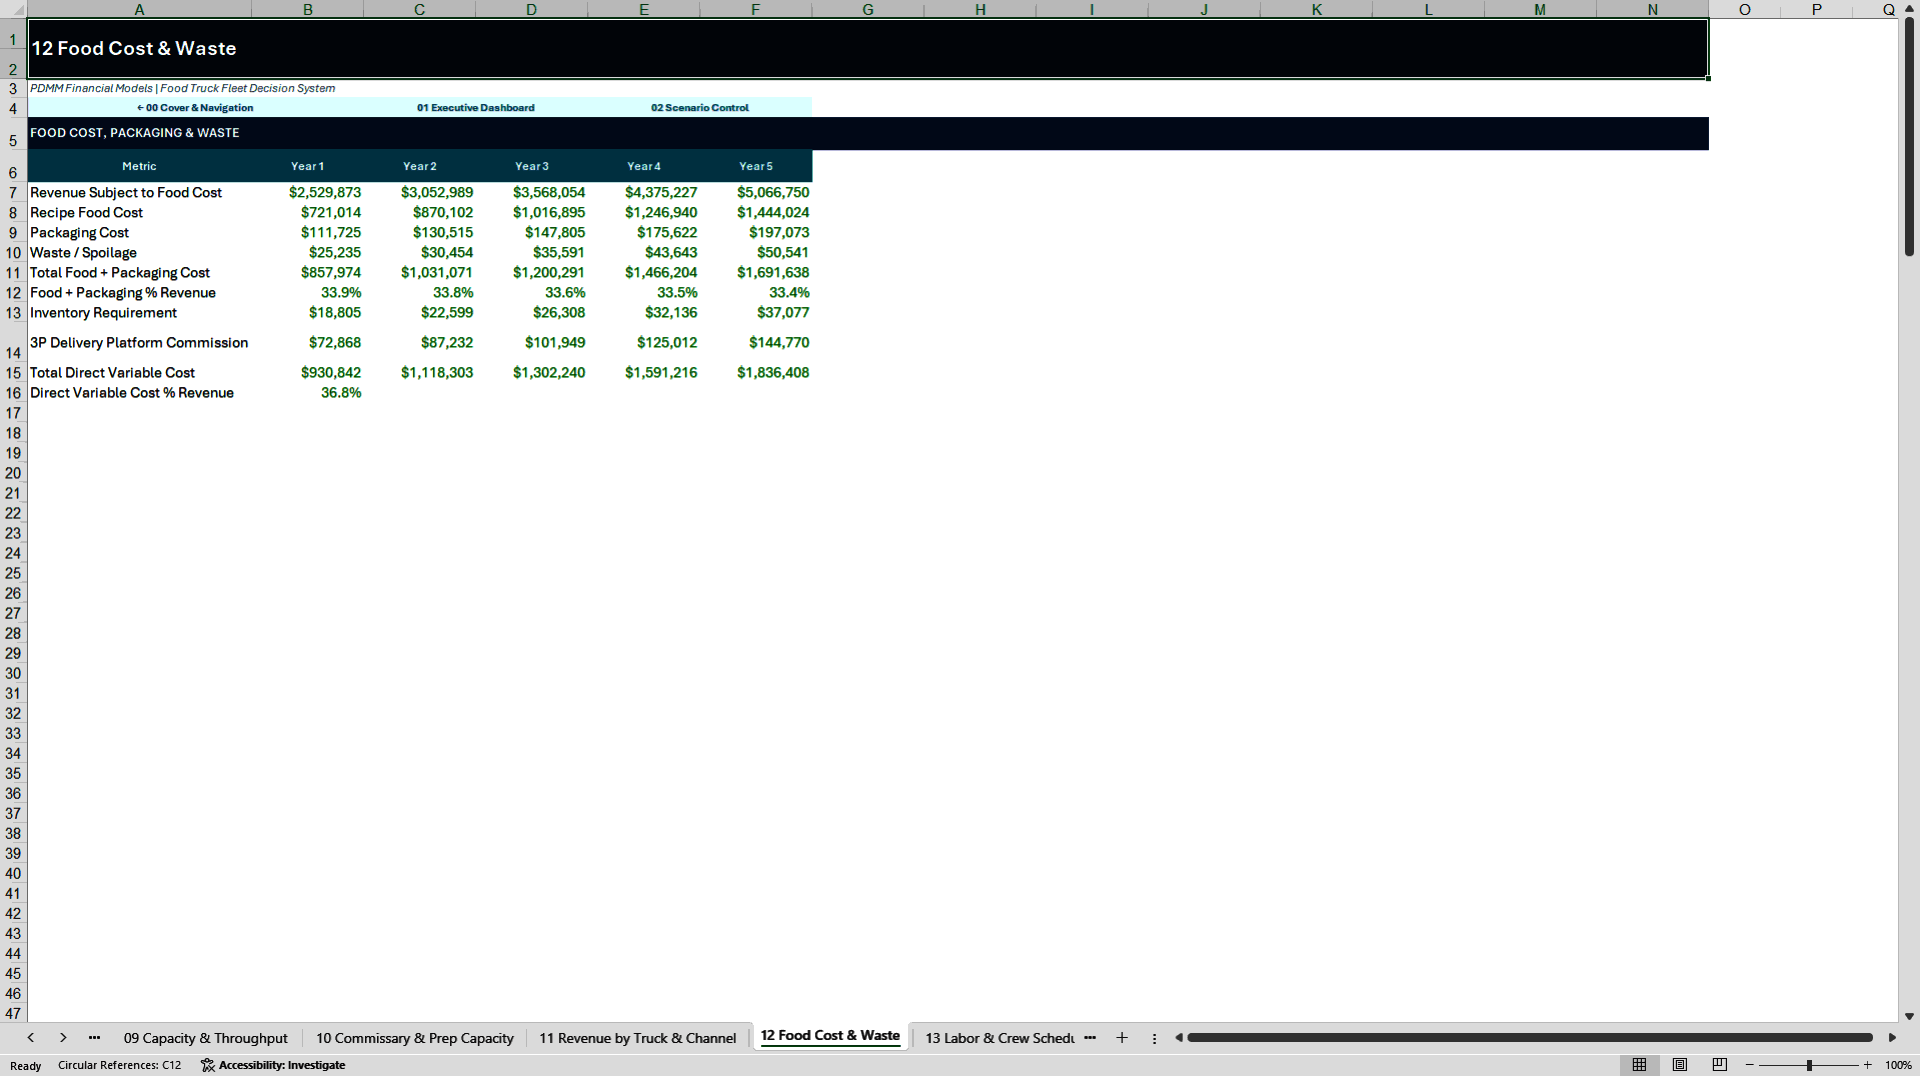
The model also includes truck throughput, realized orders, overflow demand, fleet utilization and commissary prep capacity. Revenue is modeled monthly in Year 1 across street/location sales, accepted events, catering and third-party delivery, followed by a five-year revenue summary. Separate schedules cover food, packaging, waste, delivery commissions, labor, fleet operating costs, CapEx, depreciation, working capital and debt financing.
Fleet expansion is treated as a decision rather than a fixed assumption. The model calculates demand without an added truck, overflow orders, incremental EBITDA, truck CapEx, candidate debt, debt service, incremental DSCR, payback and opening liquidity. The resulting ADD or HOLD decision is linked to defined utilization, return, liquidity and commissary-capacity hurdles.
The five-year Profit & Loss, Balance Sheet and Cash Flow statements are integrated with the operating schedules. The workbook also contains break-even analysis, Downside/Base/Upside scenario comparison and two-way Year 5 EBITDA sensitivity tables for customer volume versus average ticket and food-cost factor versus platform commission.
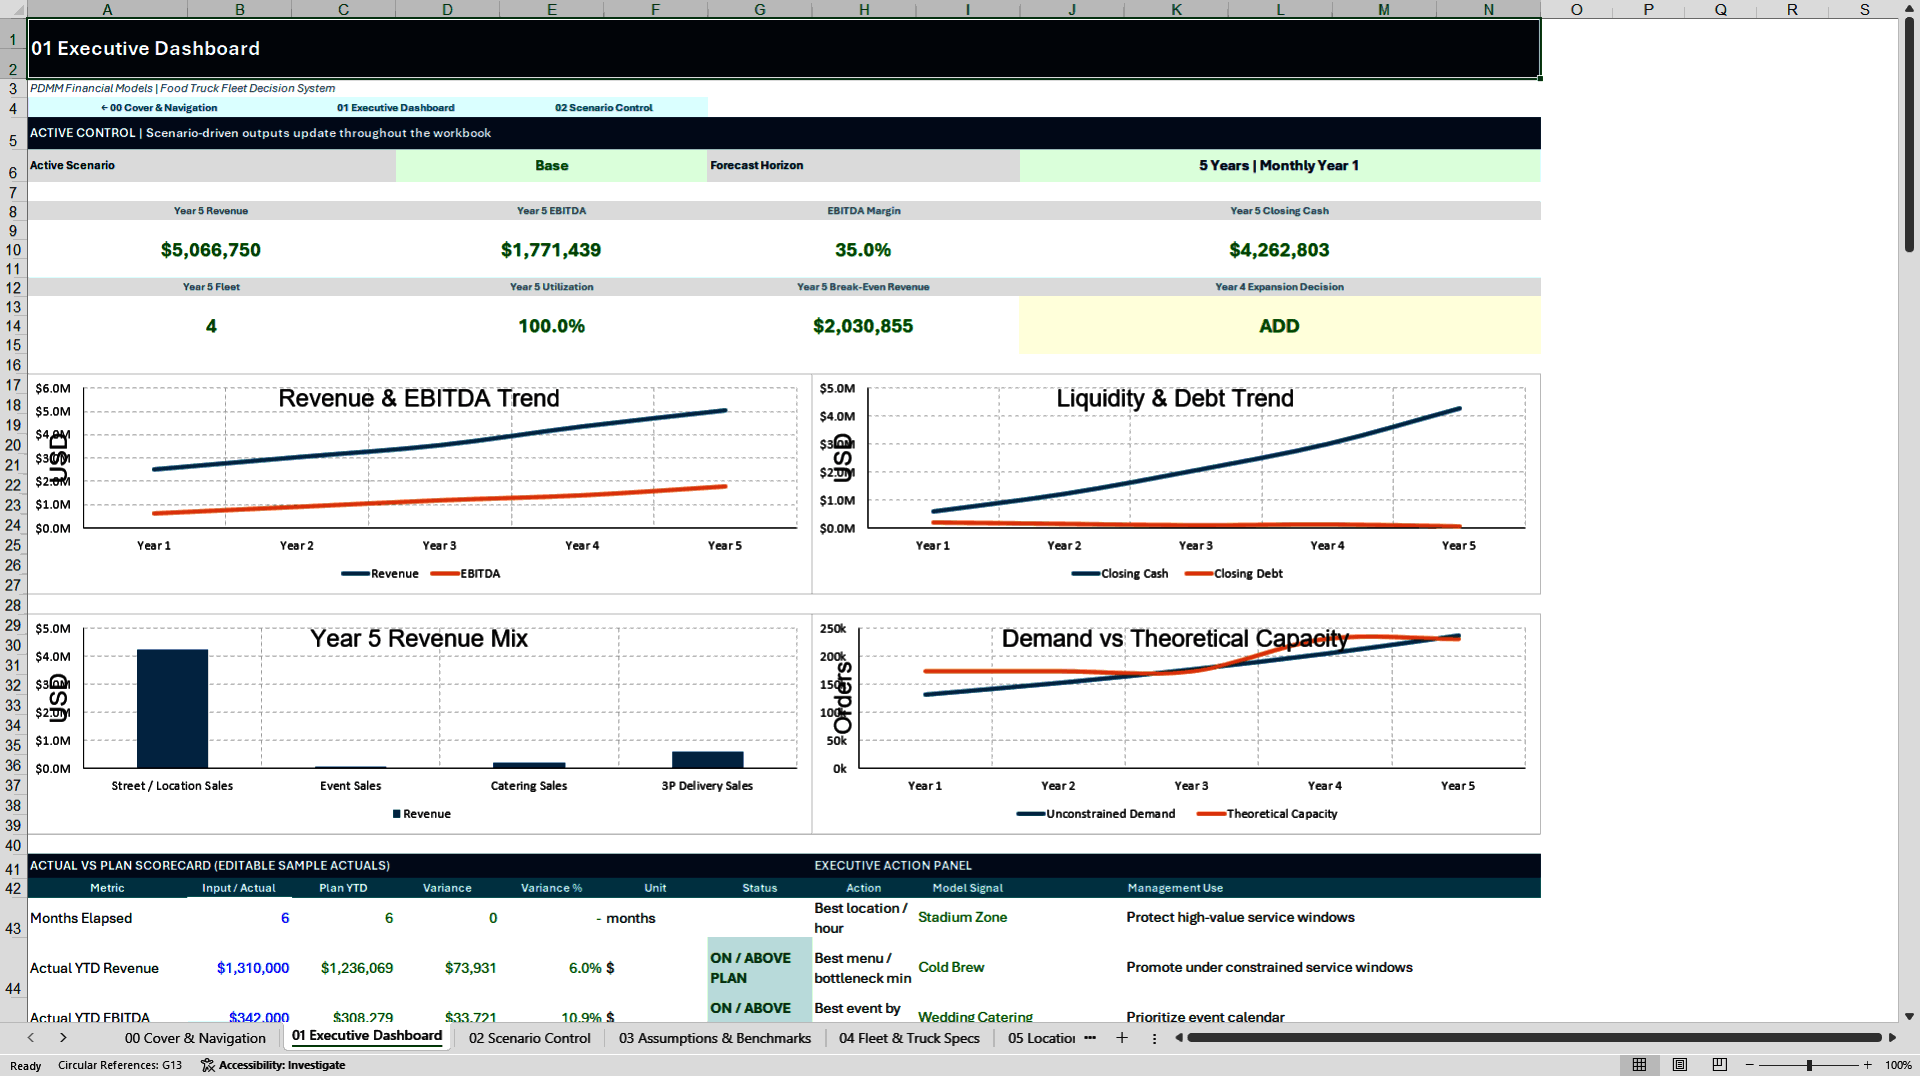
The Executive Dashboard presents Year 5 revenue, EBITDA, EBITDA margin, closing cash, fleet size, utilization, break-even revenue and expansion decision. It also includes revenue and EBITDA trends, liquidity and debt, revenue mix, demand versus theoretical capacity, an actual-versus-plan scorecard and an action panel. Additional dashboards focus on location profitability, menu profitability, fleet capacity and event profitability.
A 24-check integrity sheet tests statement balance, cash, debt and PP&E roll-forwards, revenue reconciliation, P&L links, cost and EBITDA recomputation, menu weighting, event decision logic, capacity, expansion financing, working capital, liquidity, debt bounds, scenario drivers and DSCR. The workbook is macro-free and uses editable sample data so the full decision workflow is visible immediately after opening.
Got a question about the product? Email us at support@flevy.com or ask the author directly by using the "Ask the Author a Question" form. If you cannot view the preview above this document description, go here to view the large preview instead.
Source: Best Practices in Financial Modeling, Restaurant Industry Excel: Food Truck Fleet Profitability & 5-Year Financial Model Excel (XLSX) Spreadsheet, PDMM Financial Models
ABOUT THE AUTHOR

PDMM Financial Models develops professional, decision-ready Excel models for business owners, entrepreneurs, investors, consultants, analysts, and finance teams. Our objective is to transform complex business assumptions into clear, structured analysis that supports better planning and investment decisions.
Our models cover business planning, forecasting, budgeting, feasibility analysis,
... [read more]
Ask the Author a Question
You must be logged in to contact the author.




























