
 Click main image to view in full screen. Unlock all 17 preview images:
Restaurant & Bar Financial Model – Excel XLSX
Excel (XLSX)


BENEFITS OF THIS DOWNLOADABLE EXCEL DOCUMENT
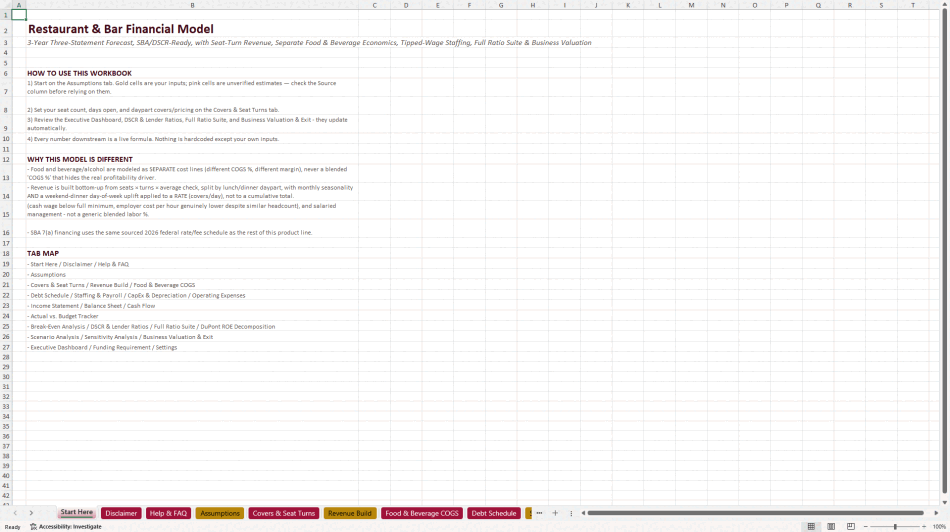
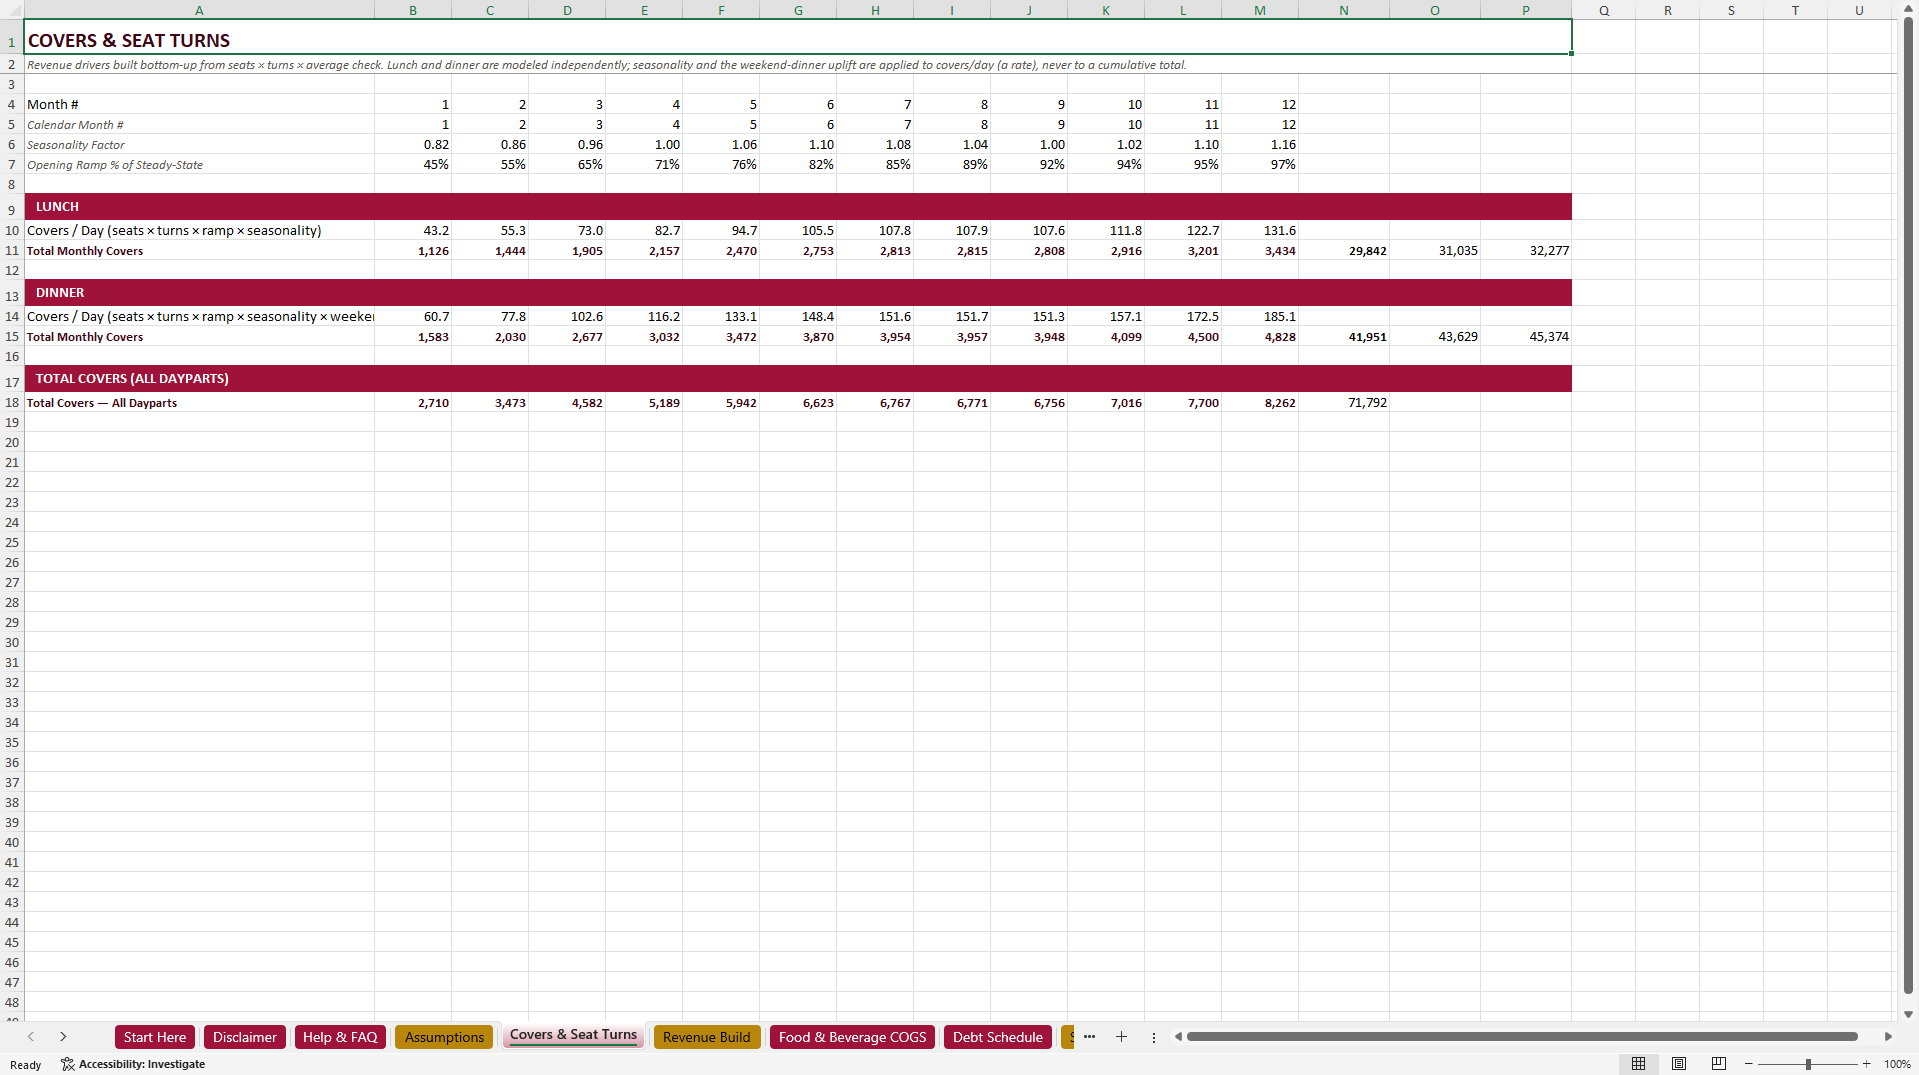
- Builds revenue bottom-up from seats x table turns x average check, split independently by lunch and dinner.
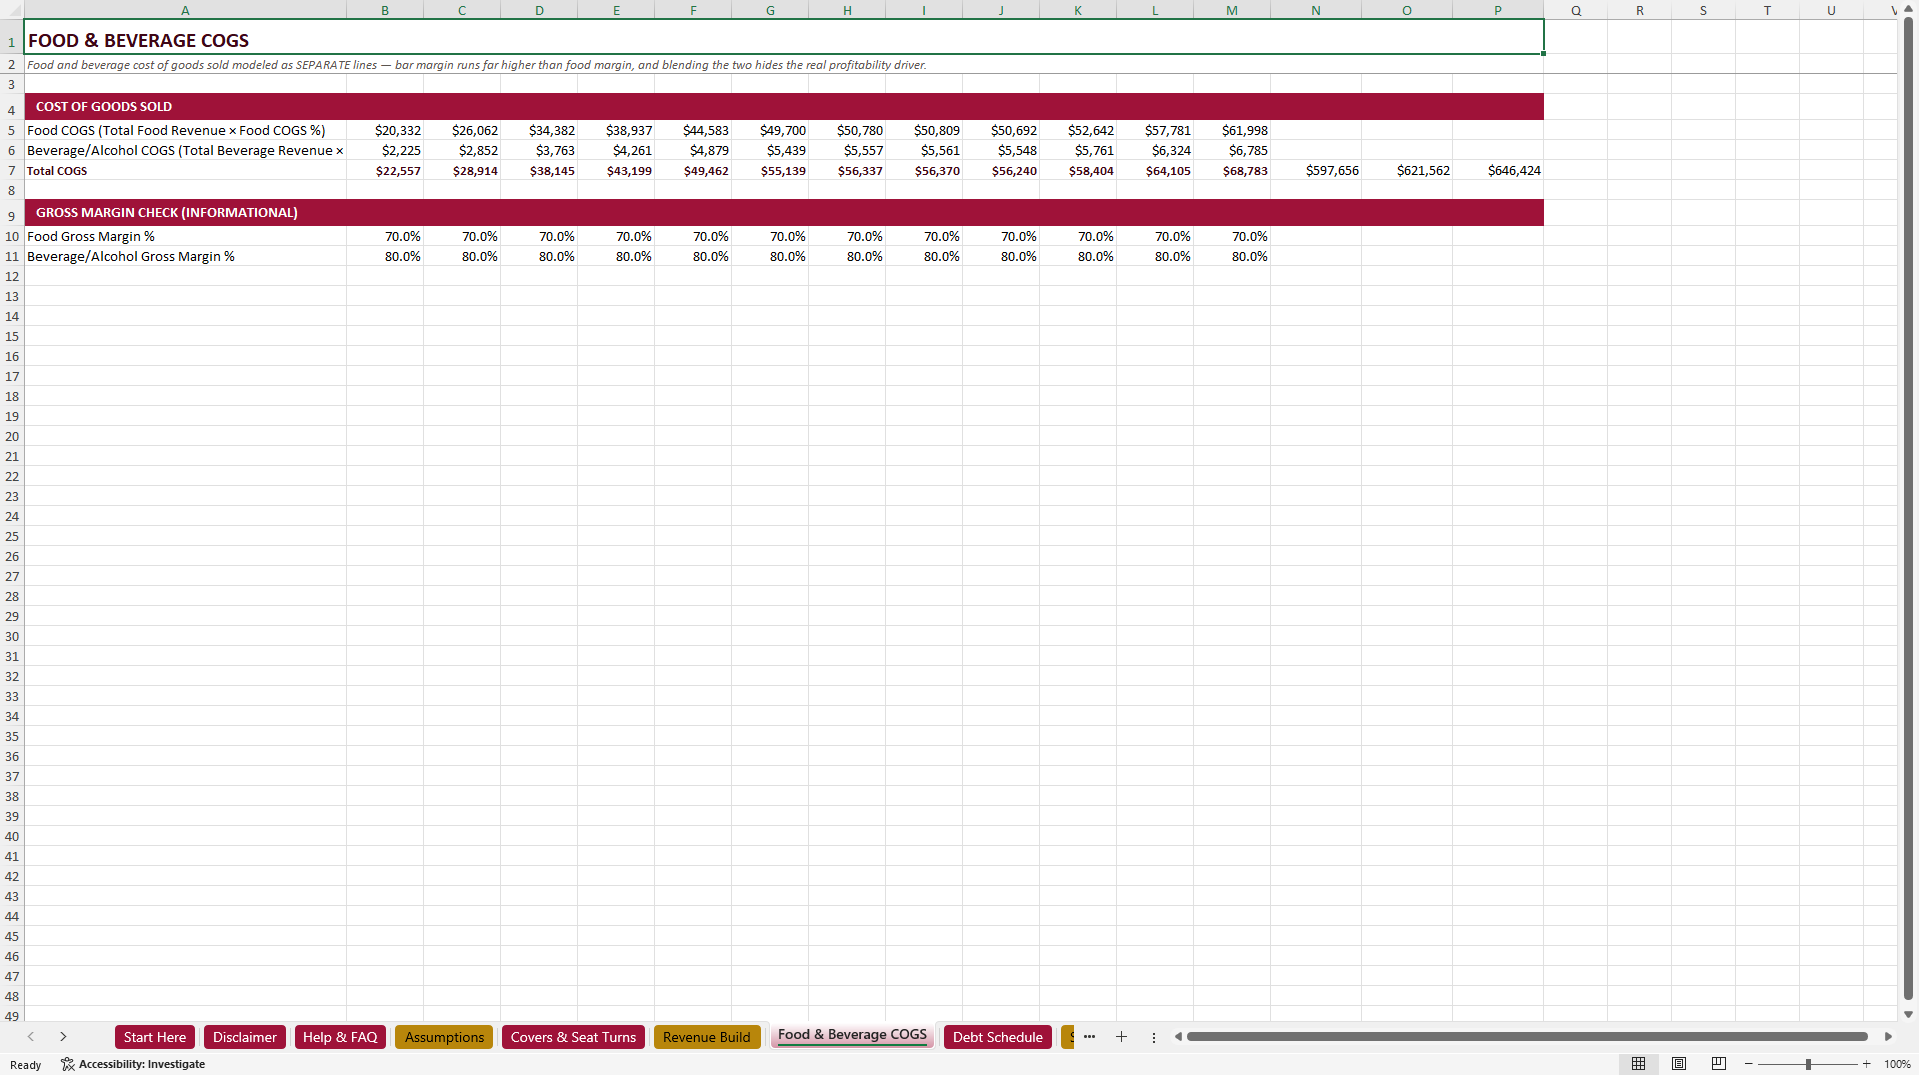
- Keeps food and beverage/alcohol cost of goods as two genuinely separate lines, not one blended COGS %.
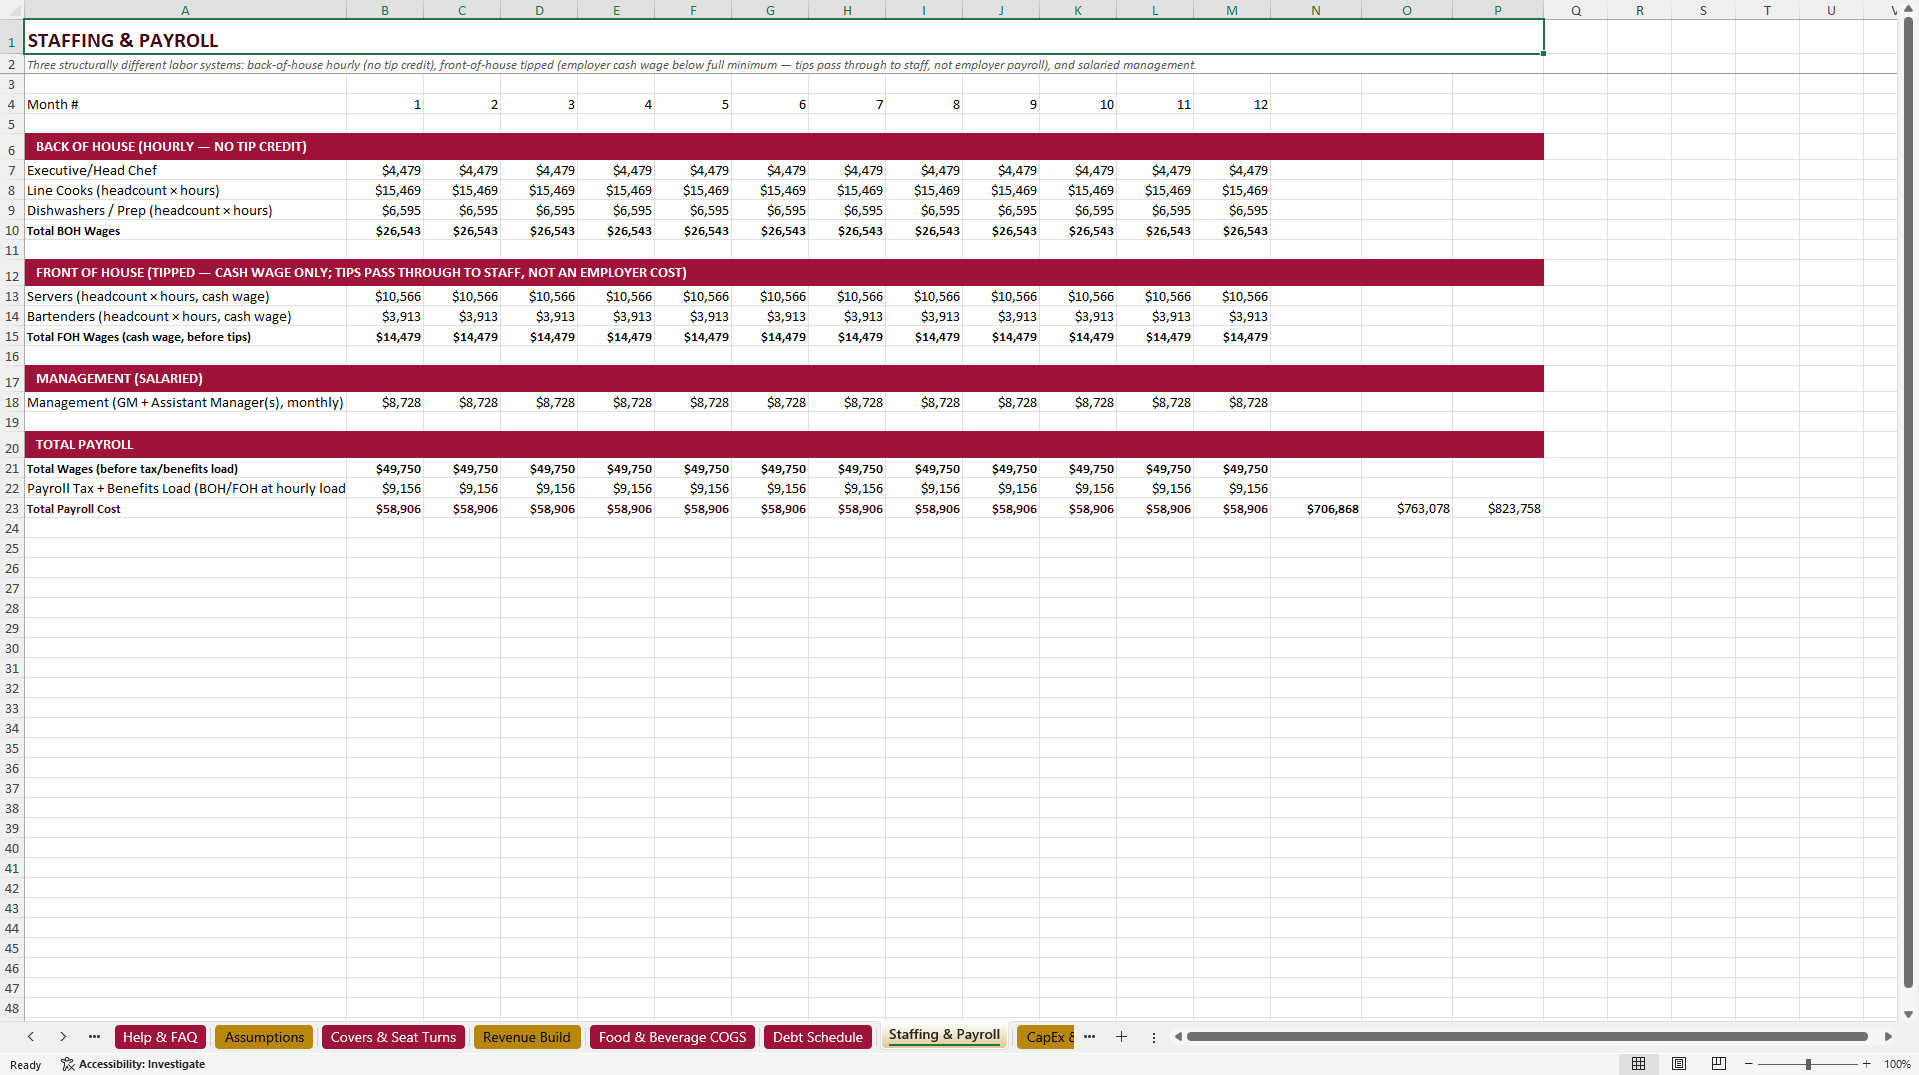
- Models labor as three real systems: hourly back-of-house, tipped front-of-house, and salaried management.
FINANCIAL MODELING EXCEL DESCRIPTION
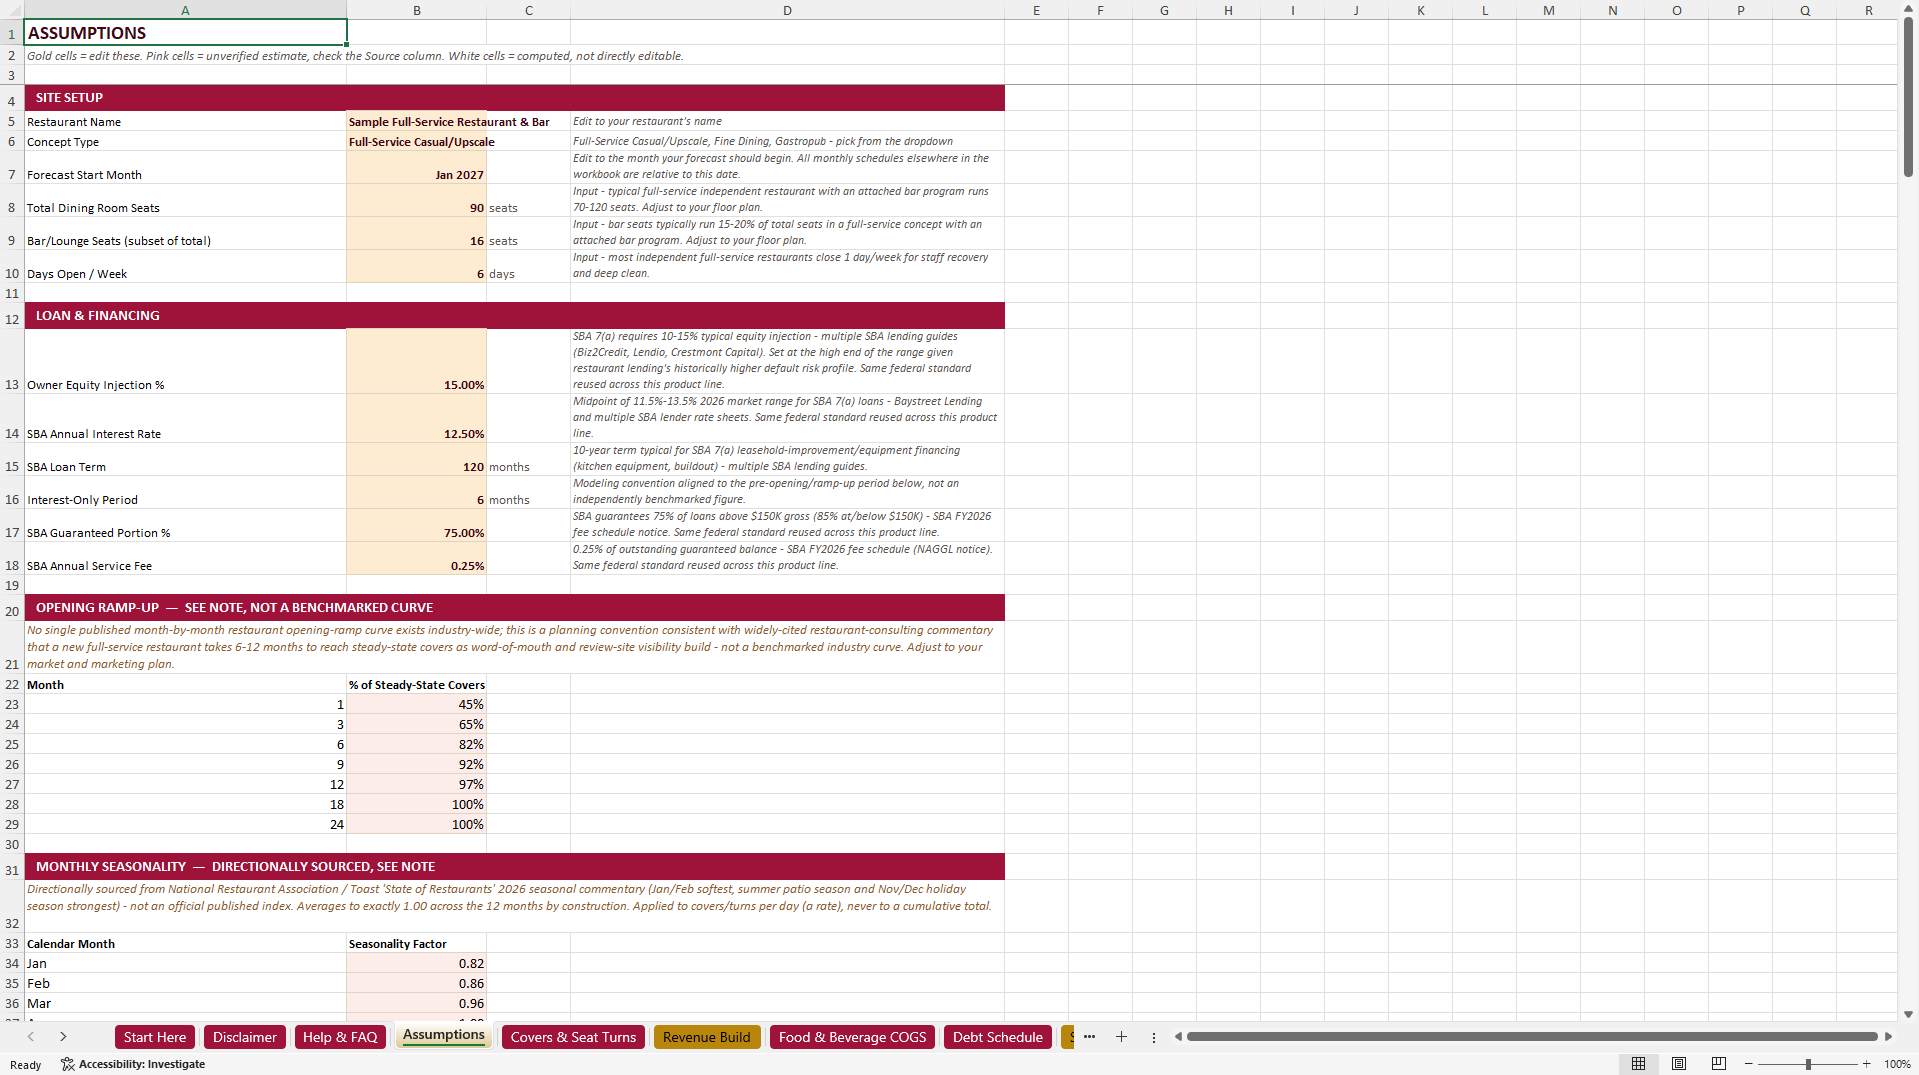
Most restaurant financial templates forecast revenue off one blended "average check" and model labor as a flat percentage of sales. This model builds revenue bottom-up instead: seats multiplied by table turns multiplied by average check, split independently by lunch and dinner daypart, with a monthly seasonality index and a separate weekend-dinner day-of-week uplift applied to covers per day, never to a cumulative total.
Food and beverage/alcohol are then kept as two genuinely different cost lines all the way through the model, because a bar program's margin runs nothing like the kitchen's – blending them into one "COGS %" is the single most common shortcut that hides how much a bar program actually lifts margin. A three-system Staffing & Payroll build separates back-of-house hourly staff (no tip credit), front-of-house tipped staff (a real cash-wage-below-minimum structure), and salaried management, so labor cost reflects how a restaurant is actually staffed.
Year 1 DSCR clears the 1.25x SBA 7(a) minimum at 3.95x, backed by a revenue-cushion stress test, current ratio, debt-to-equity, and interest coverage on the DSCR & Lender Ratios tab. Every wage and cost benchmark is sourced to 2026 data – BLS median wages for chefs, servers, and bartenders, the federal $2.13/hr tipped-minimum cash wage alongside the $7.25/hr full minimum, and the 28%-32% food-cost and 18%-22% beverage-cost industry benchmark ranges.
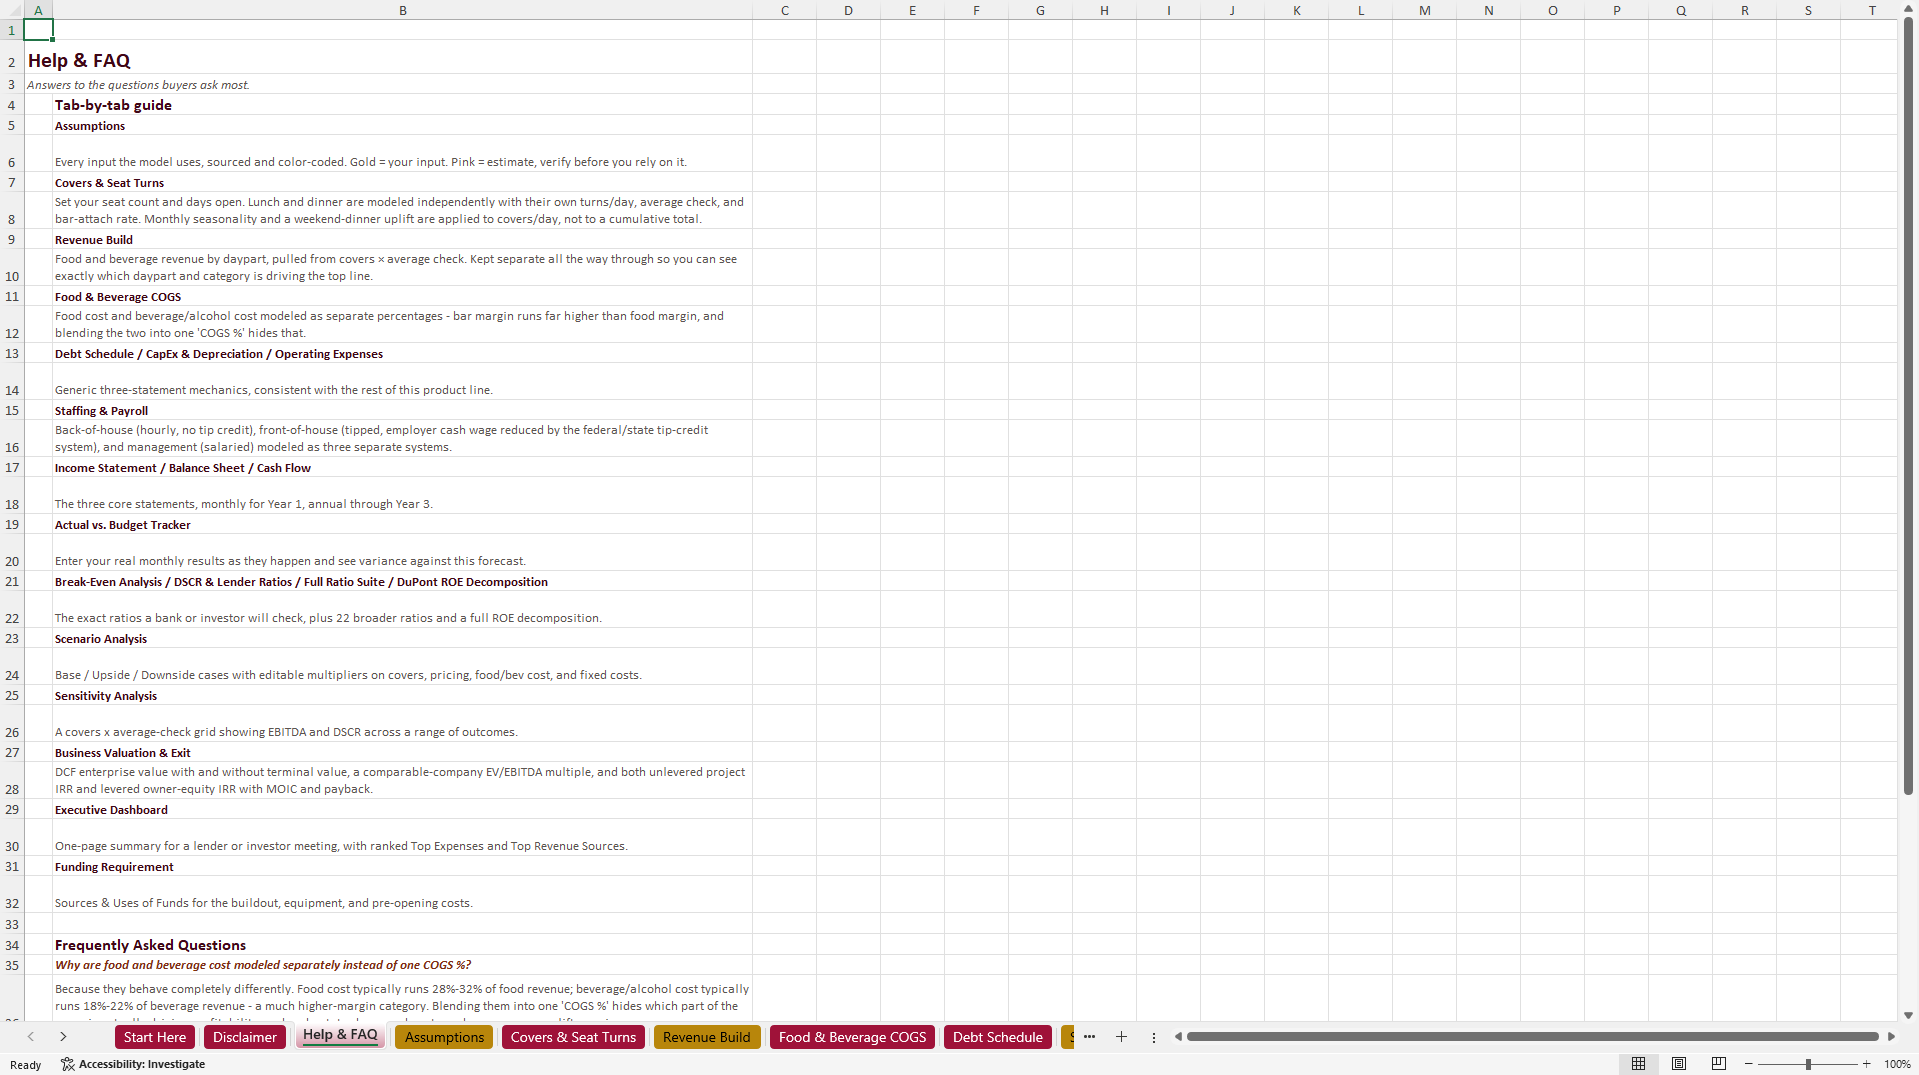
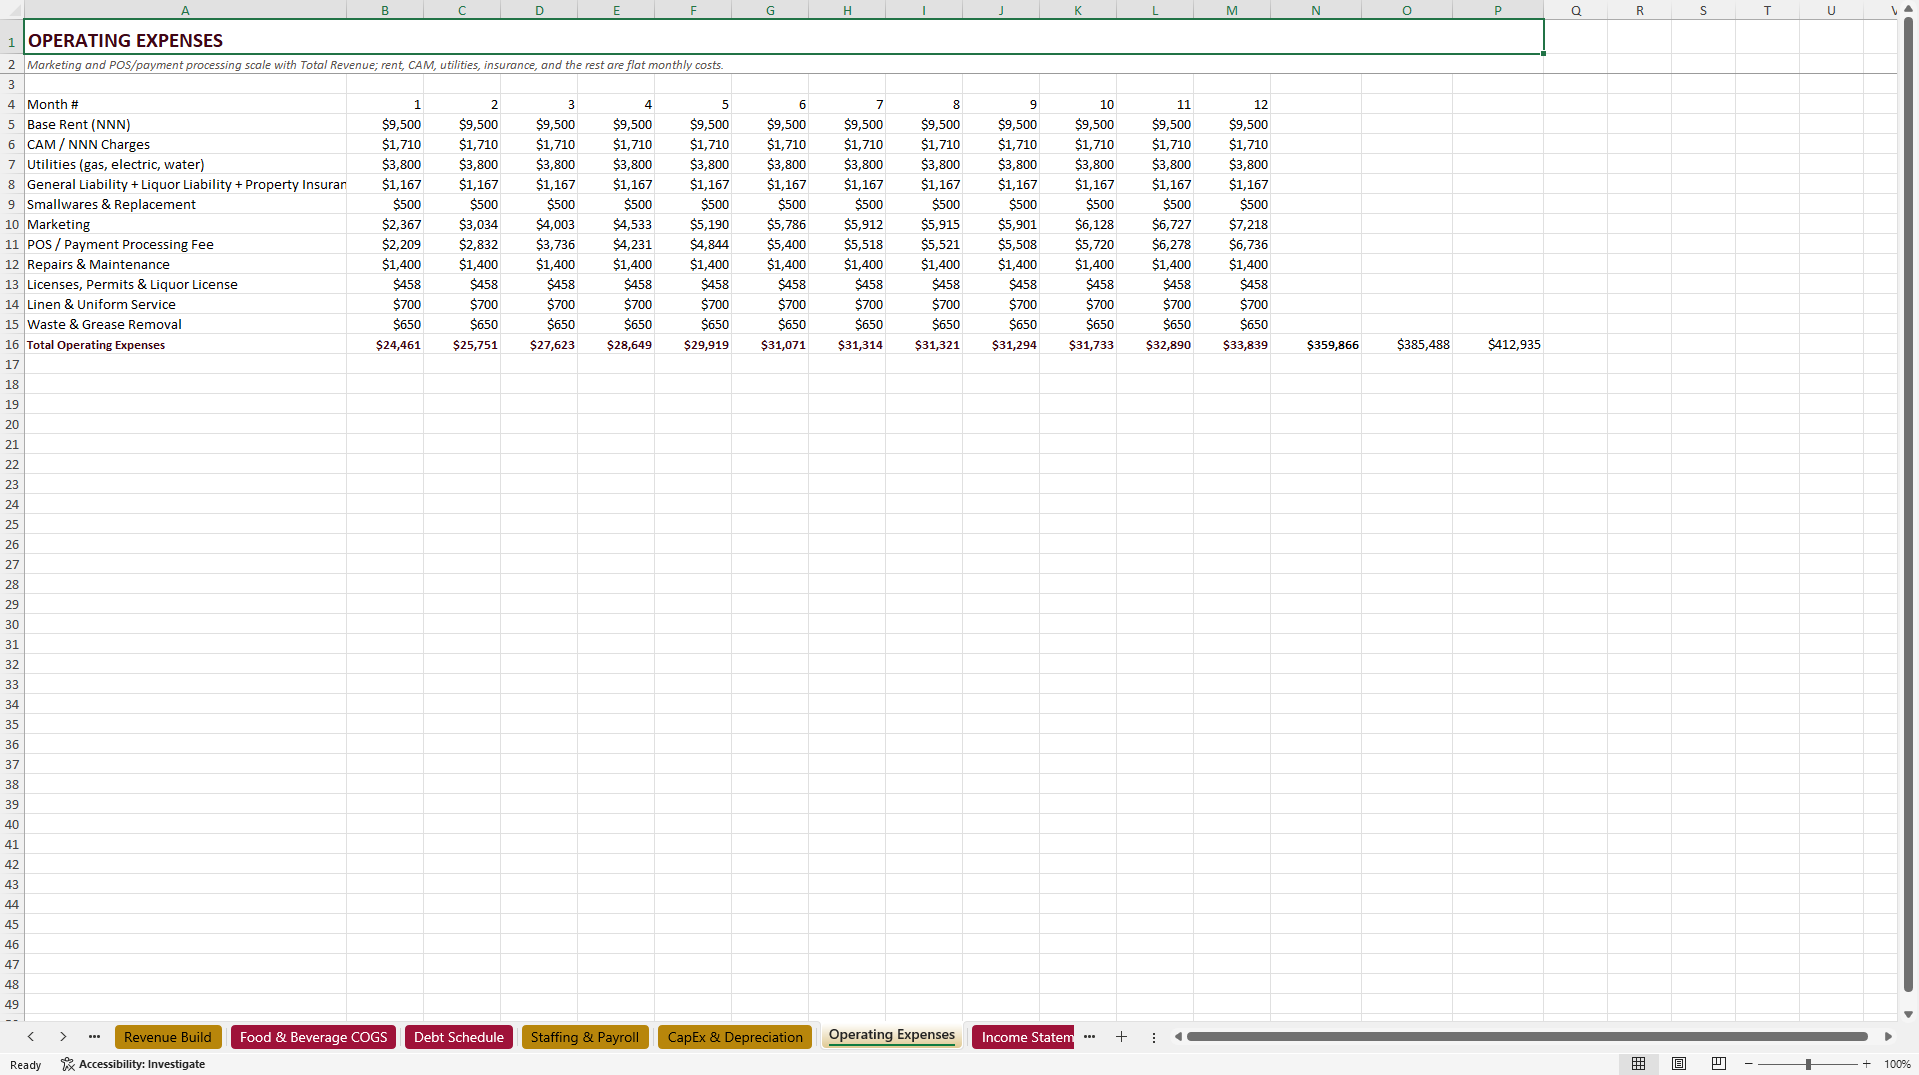
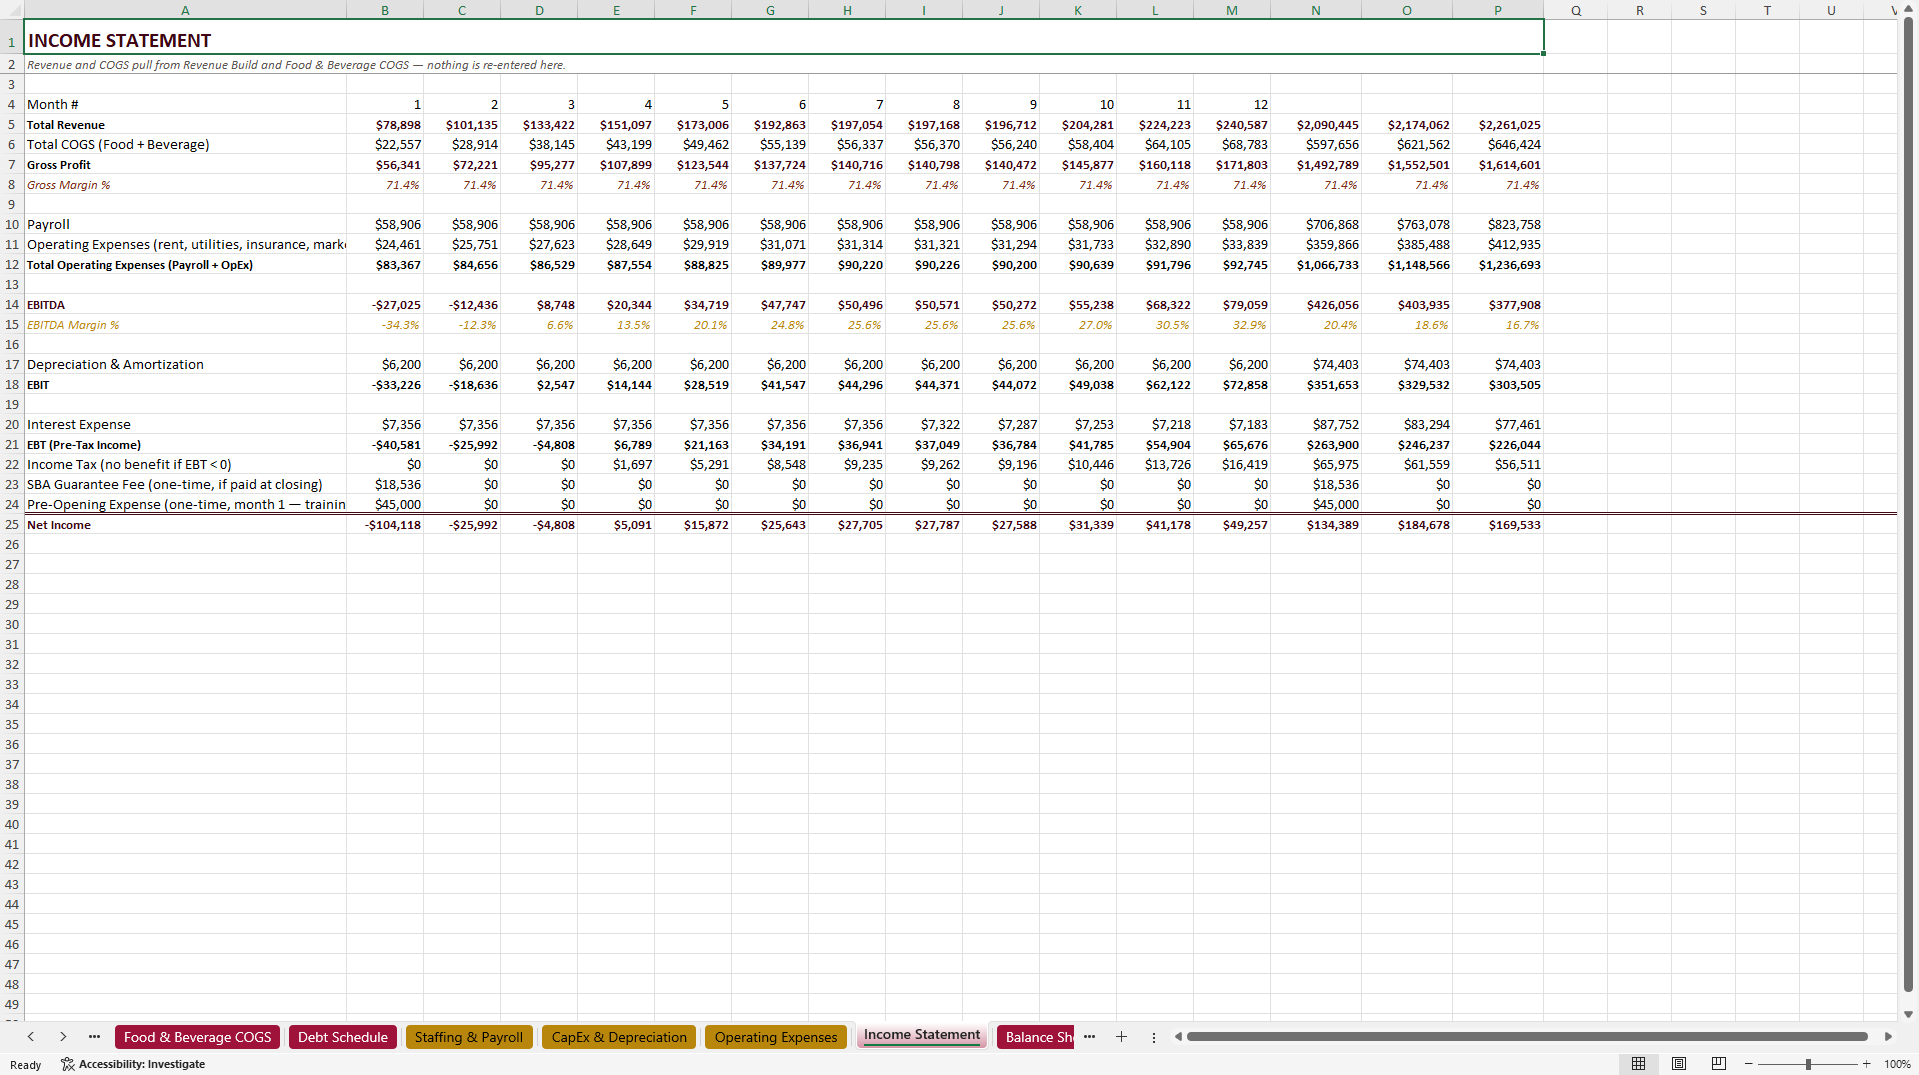
Twenty-five tabs: Start Here, Disclaimer, Help & FAQ, Assumptions, Covers & Seat Turns, Revenue Build, Food & Beverage COGS, Debt Schedule, Staffing & Payroll, CapEx & Depreciation, Operating Expenses, the three financial statements, an Actual vs. Budget Tracker, Break-Even Analysis, DSCR & Lender Ratios, a 22-ratio Full Ratio Suite, a DuPont ROE Decomposition, Scenario Analysis, Sensitivity Analysis (covers by average check, on both Net Income and DSCR), a Business Valuation & Exit tab with a DCF and unlevered/levered IRR, an Executive Dashboard, Funding Requirement, and Settings.
Built as a native .xlsx, verified across Excel, Google Sheets, LibreOffice, WPS, and ONLYOFFICE. A planning tool built from sourced 2026 data – confirm your own concept, market, and state's tipped-wage law before relying on it for a real loan application.
Got a question about the product? Email us at support@flevy.com or ask the author directly by using the "Ask the Author a Question" form. If you cannot view the preview above this document description, go here to view the large preview instead.
Source: Best Practices in Financial Modeling, Restaurant Industry Excel: Restaurant & Bar Financial Model Excel (XLSX) Spreadsheet, WebsiteGeek
ABOUT THE AUTHOR

WebsiteGeek offers free website tools, SEO suites, file converters, browser extensions, calculators, and image utilities built to supercharge your productivity.
We also builds practical digital tools and templates for small business owners -- real formulas and sourced data.
Ask the Author a Question
You must be logged in to contact the author.




























