
 Click main image to view in full screen. Unlock all 17 preview images:
Food & Coffee Truck Financial Model - 5-Year Forecast – Excel XLSX
Excel (XLSX) + supplemental PDF


BENEFITS OF THIS DOWNLOADABLE EXCEL DOCUMENT
- Build a linked five-year monthly operating and three-statement forecast for a phased food-truck and coffee-truck fleet.
- Evaluate break-even, unit economics, cash requirements, debt funding, scenarios and two-variable sensitivities in one workbook.
- Estimate enterprise and equity value through an unlevered DCF with terminal-growth and exit-multiple methods.
FINANCIAL MODELING EXCEL DESCRIPTION
Food & Coffee Truck Financial Model – 5-Year Forecast
This Excel model is built for operators, founders, advisors, lenders and finance teams planning a food-truck, coffee-truck or mixed mobile fleet. It links commercial operating assumptions to a 60-month forecast, annual summaries, three financial statements, break-even analysis, unit economics, scenario analysis, sensitivity testing, funding schedules and discounted cash flow valuation.
Seller-supplied and already tested; no Studio workbook audit was performed.
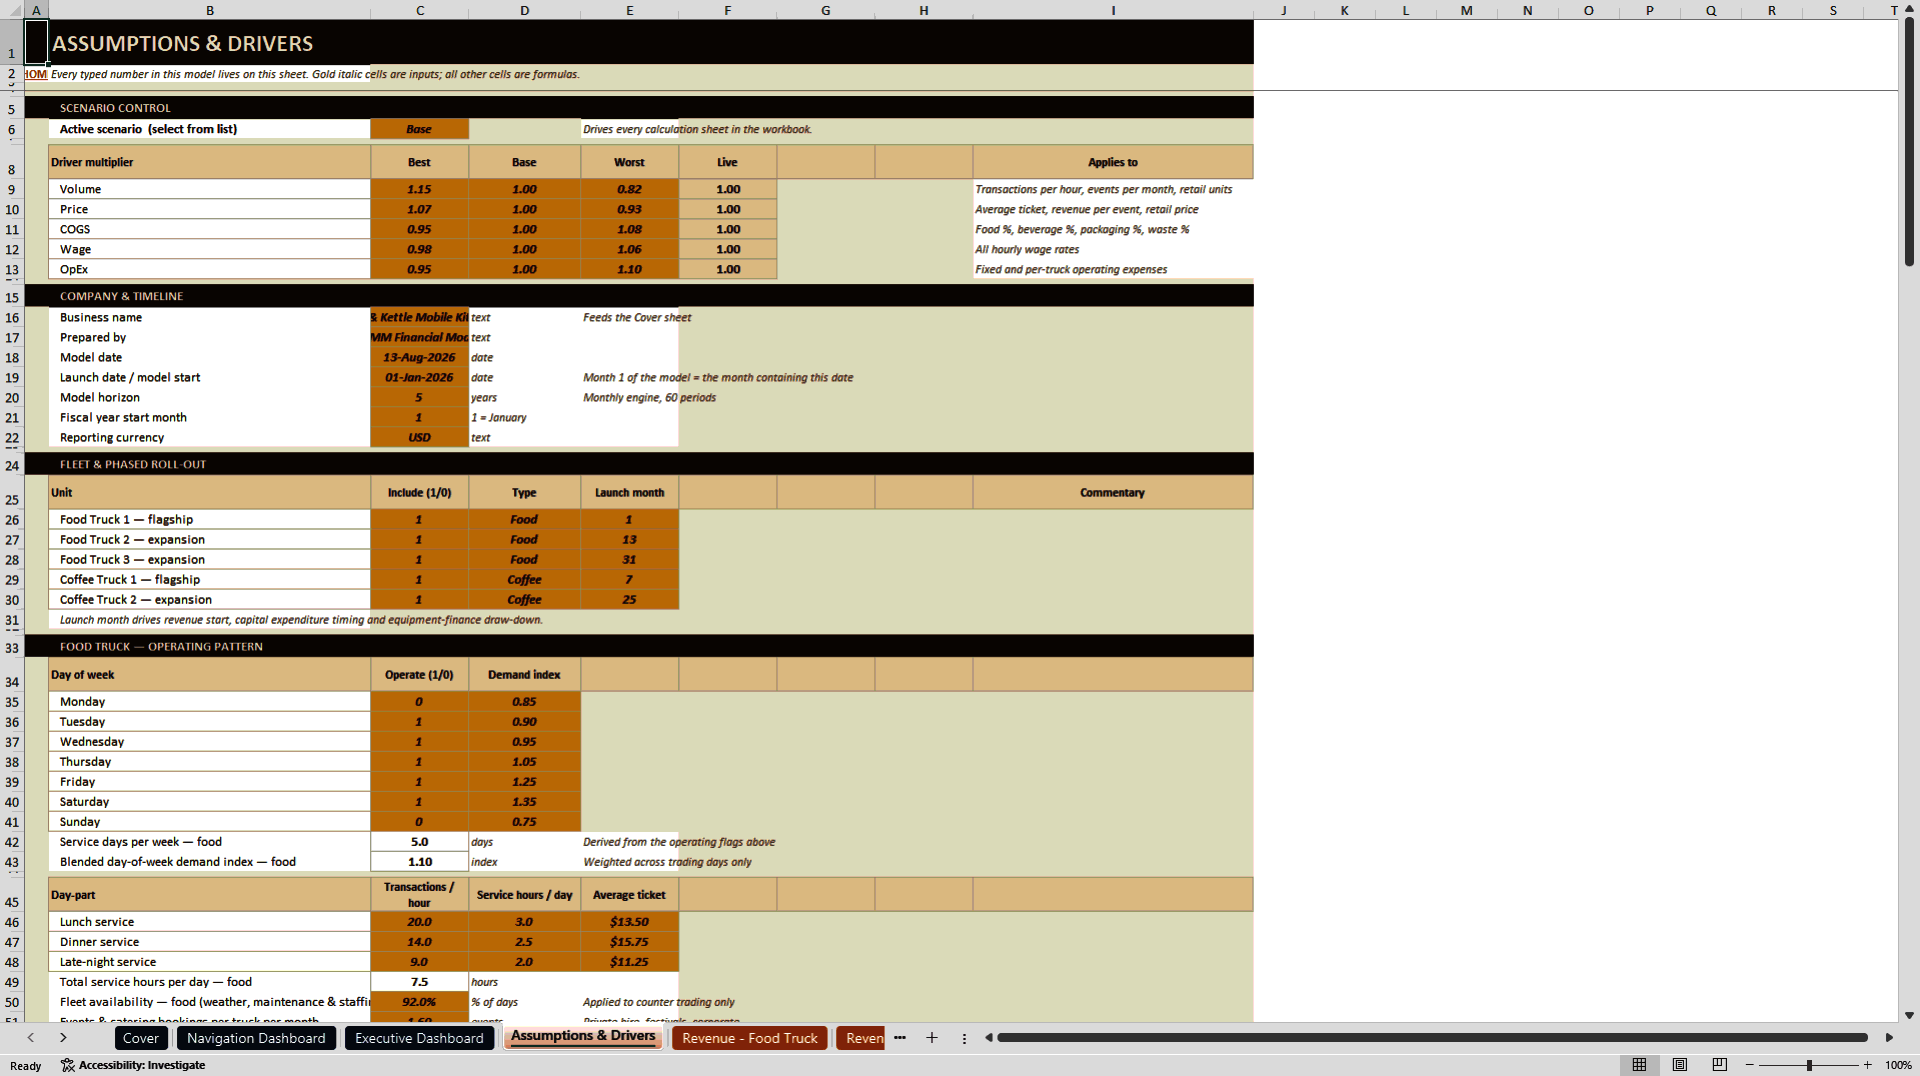
The workbook starts with a centralized Assumptions & Drivers sheet. Users can configure the active Best, Base or Worst scenario; choose which fleet units are included; select food or coffee truck type; set each unit's launch month; and change operating days, demand indices, day-part transaction volumes, service hours, average tickets, fleet availability, catering/events, retail coffee sales, seasonality, annual volume growth and price growth.
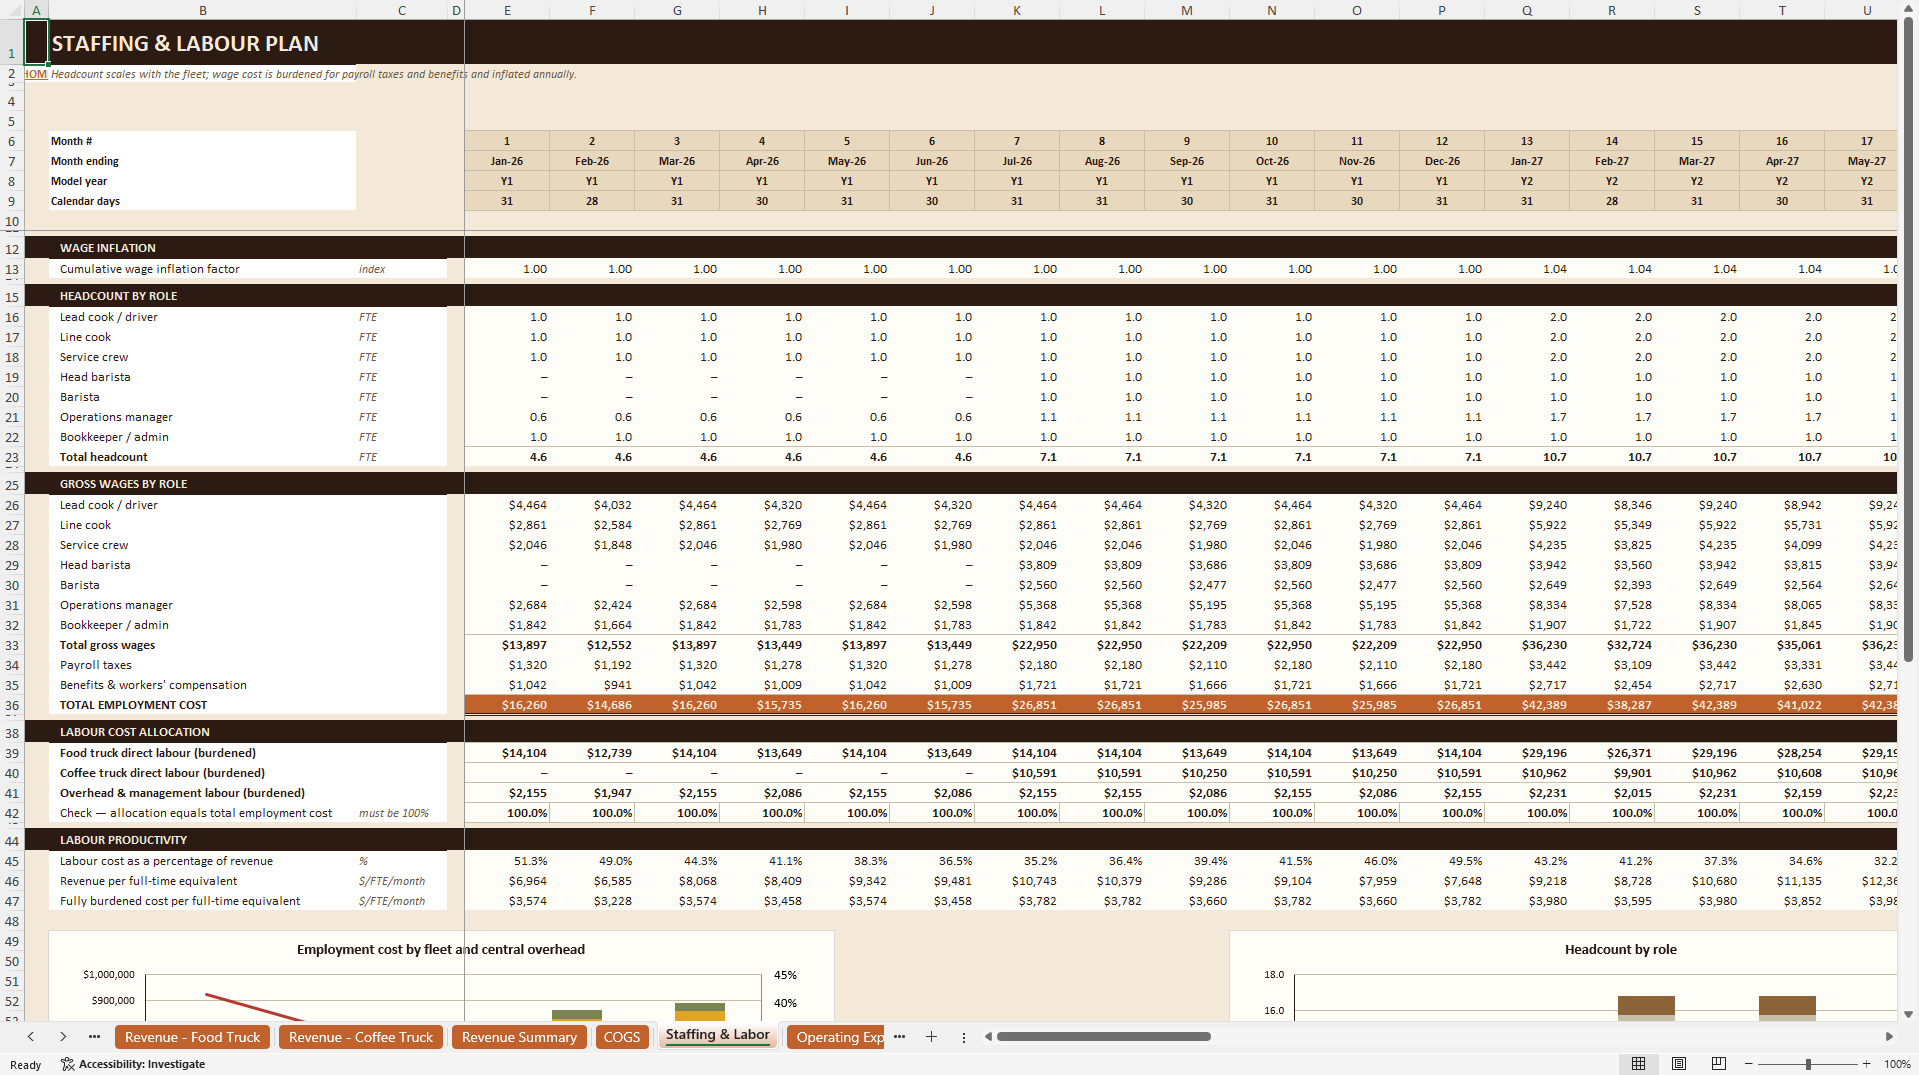
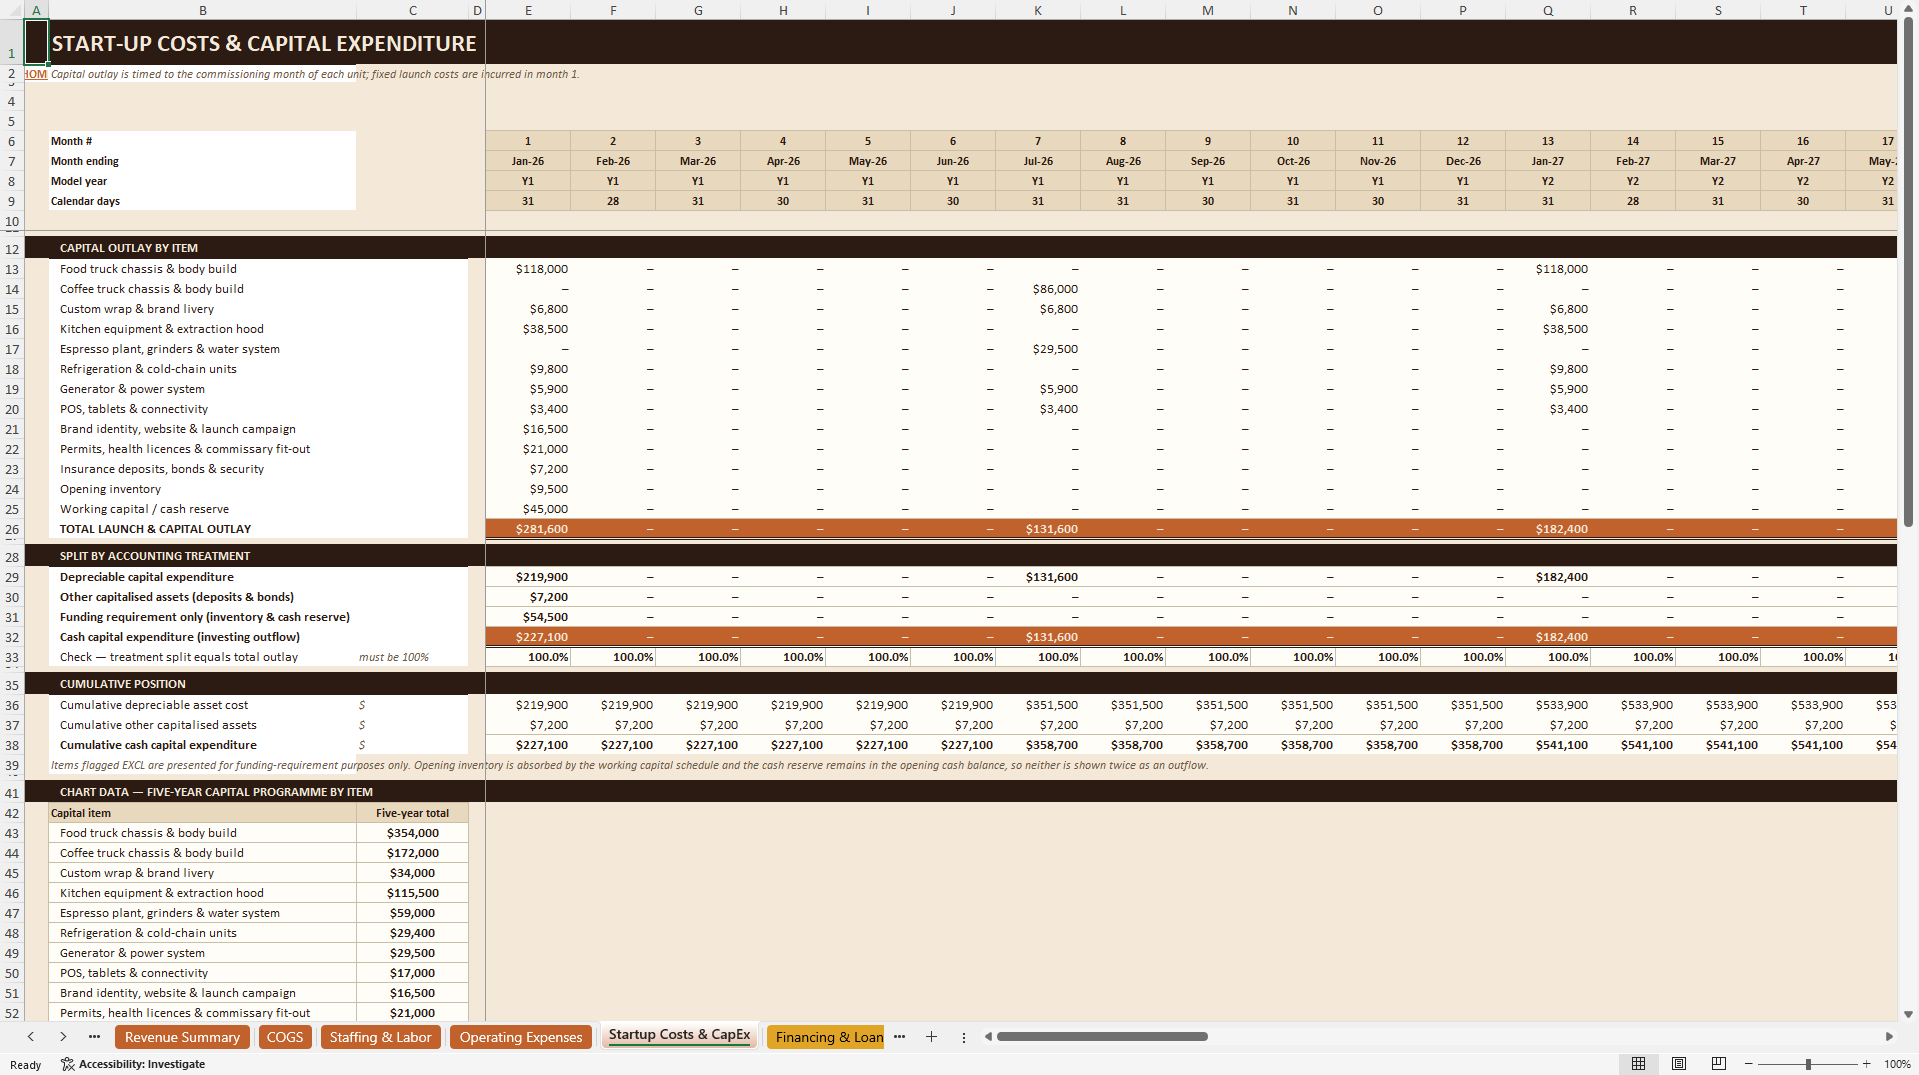
Cost and capacity assumptions cover food and beverage inputs, packaging, waste, role-based staffing, wages, payroll burden, benefits, operating-cost inflation, truck-level and fixed overheads, revenue-linked expenses, startup costs, capital expenditure and depreciation lives. Working-capital inputs include credit sales, debtor days, inventory days, creditor days and accrued payroll. Funding inputs include founder equity, senior term debt, equipment-finance advance rates and repayment terms, a revolving facility and a minimum operating cash buffer. Tax, WACC, terminal growth, exit EBITDA multiple and sensitivity steps are also editable.
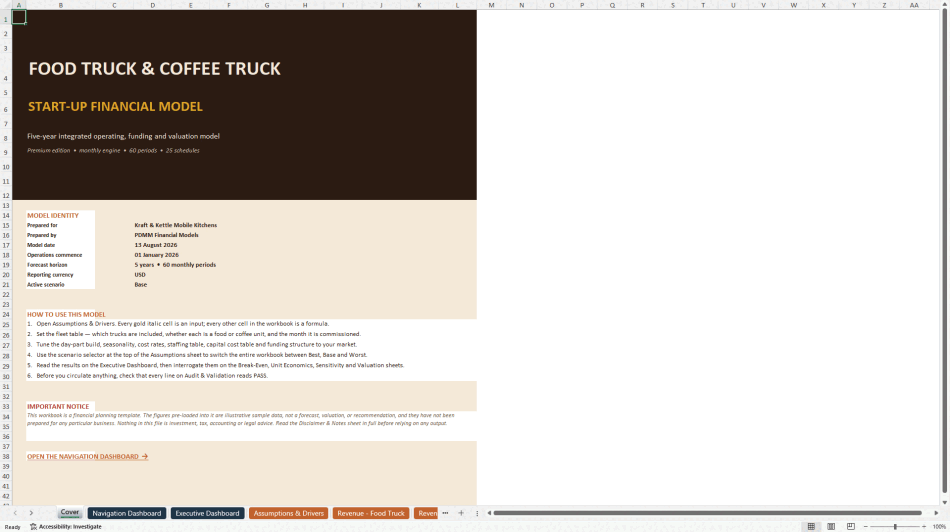
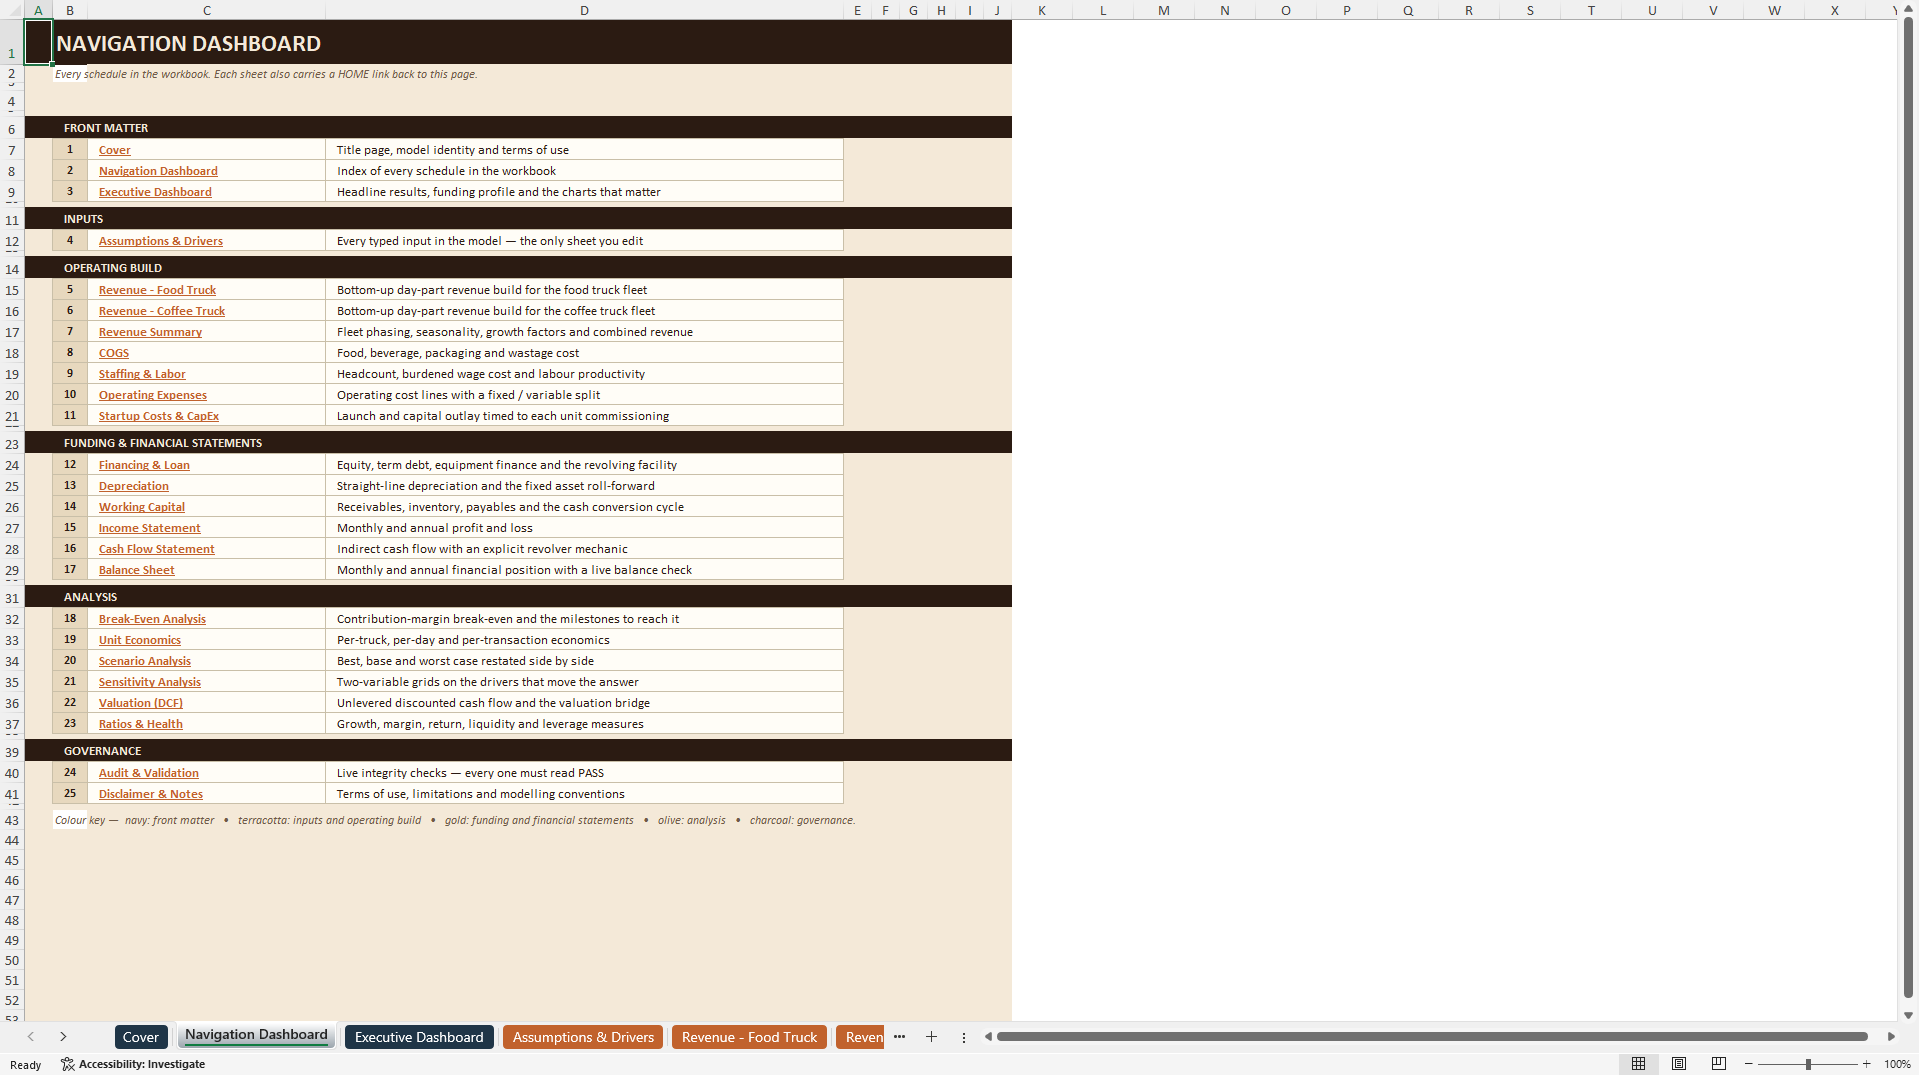
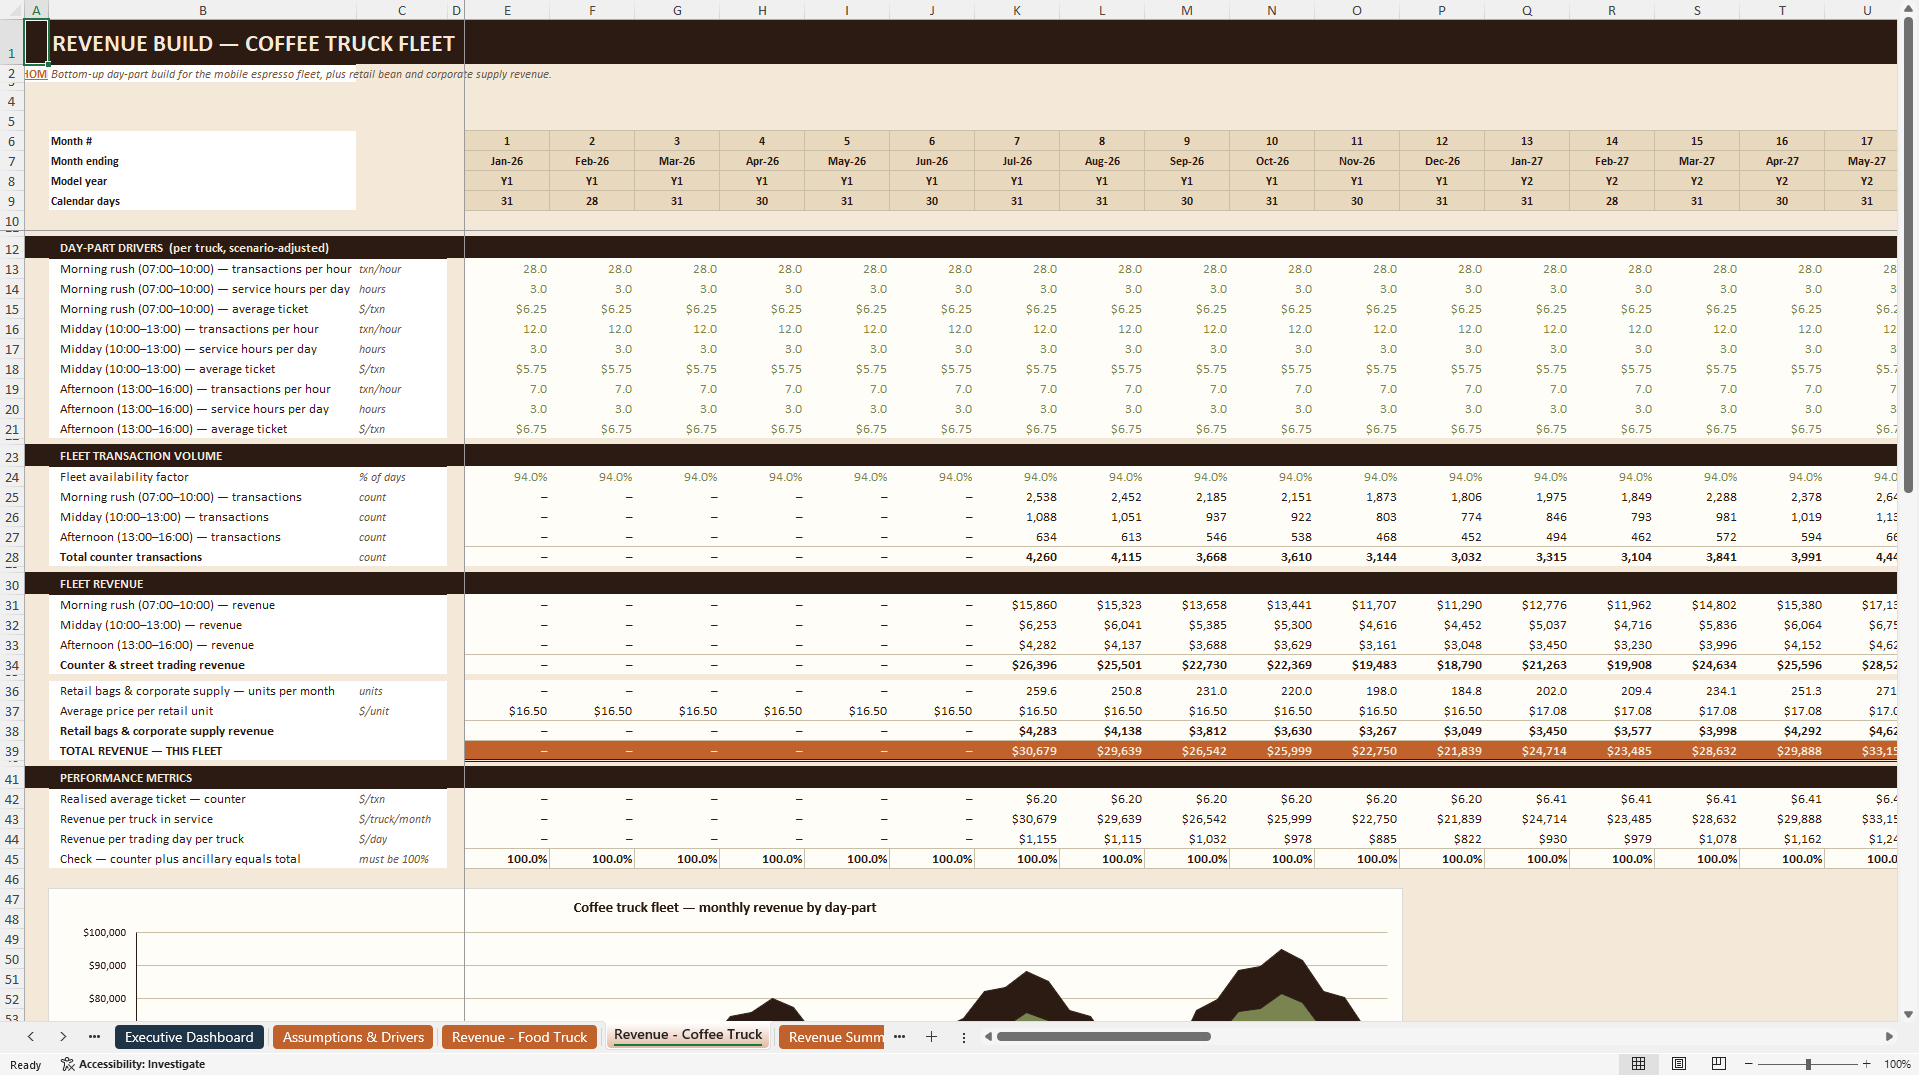
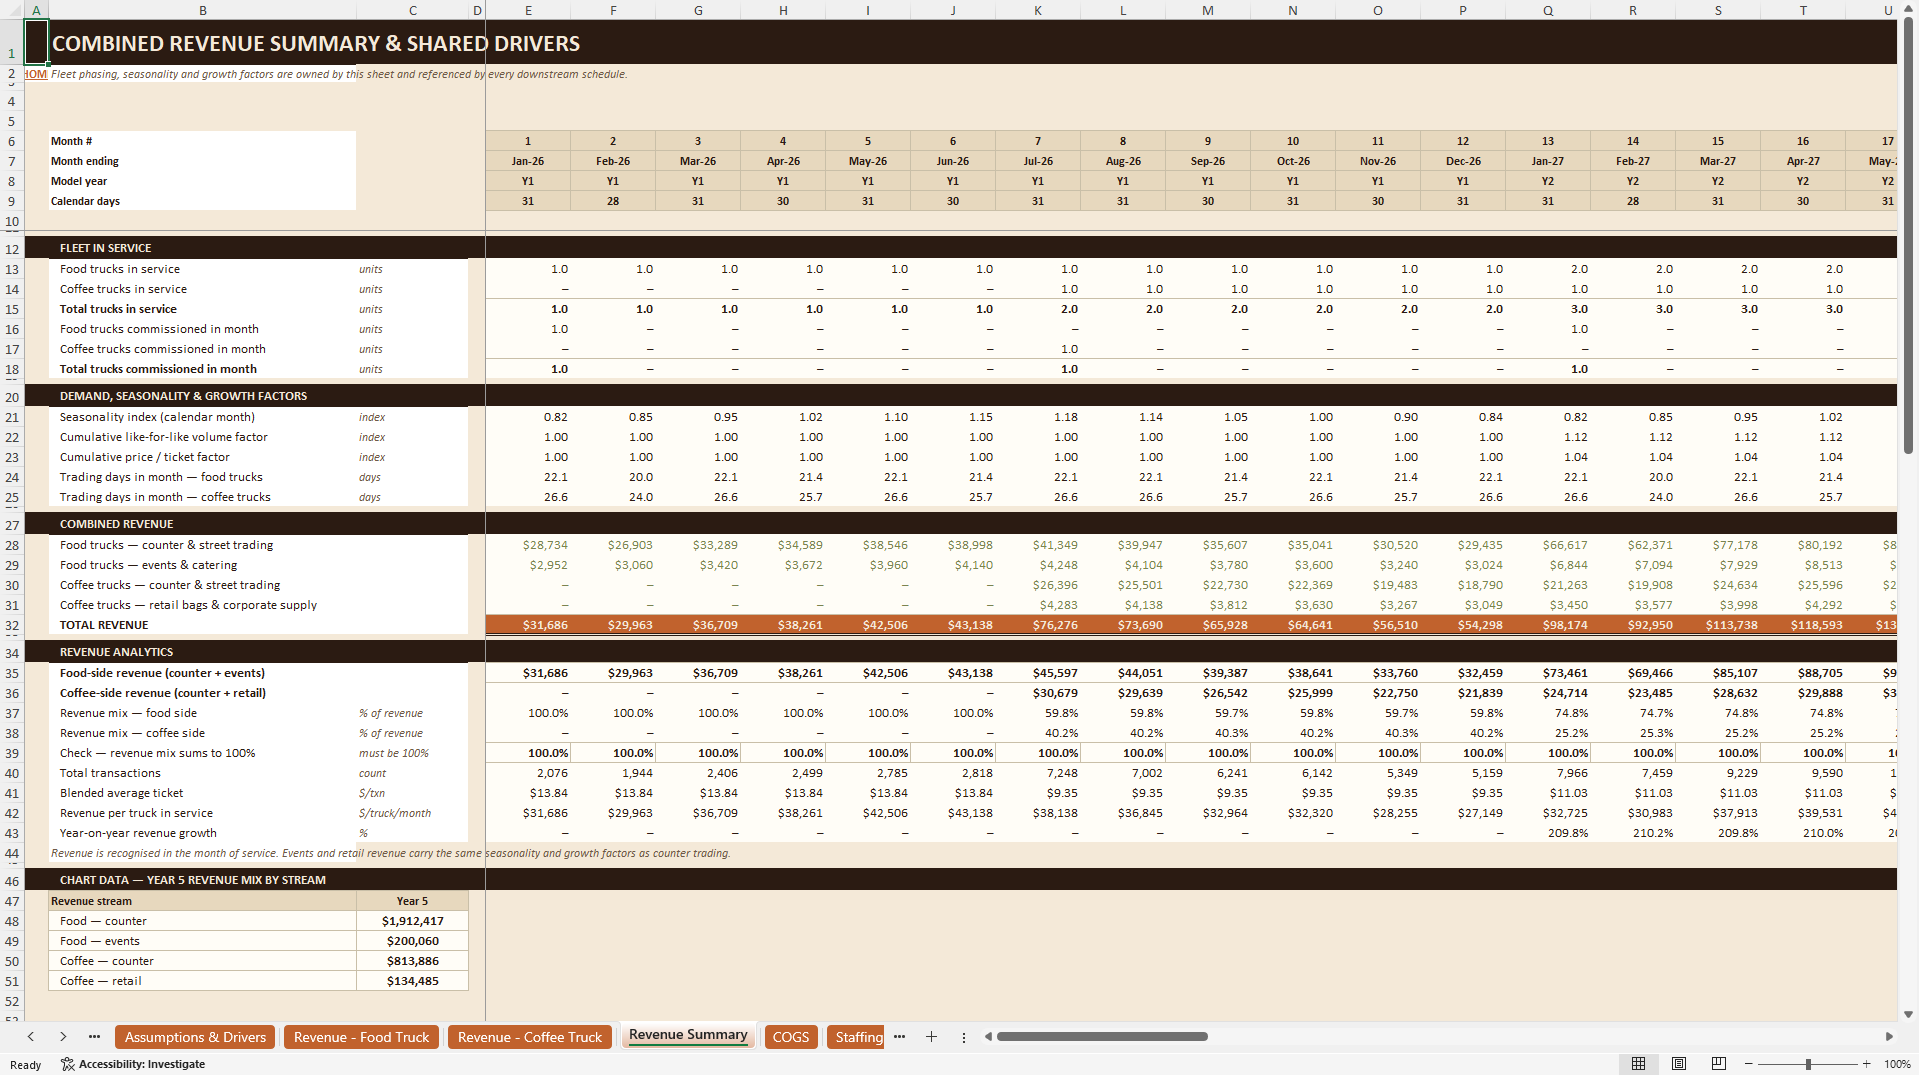
Separate Food Truck and Coffee Truck revenue schedules feed a combined Revenue Summary, allowing each format to retain its own operating pattern and ancillary revenue streams. The integrated Income Statement, Cash Flow Statement and Balance Sheet run monthly across all 60 periods and also provide annual summaries. Financing and Loan, Depreciation, Working Capital, Staffing & Labor, COGS, Operating Expenses, and Startup Costs & CapEx schedules provide the supporting calculations.
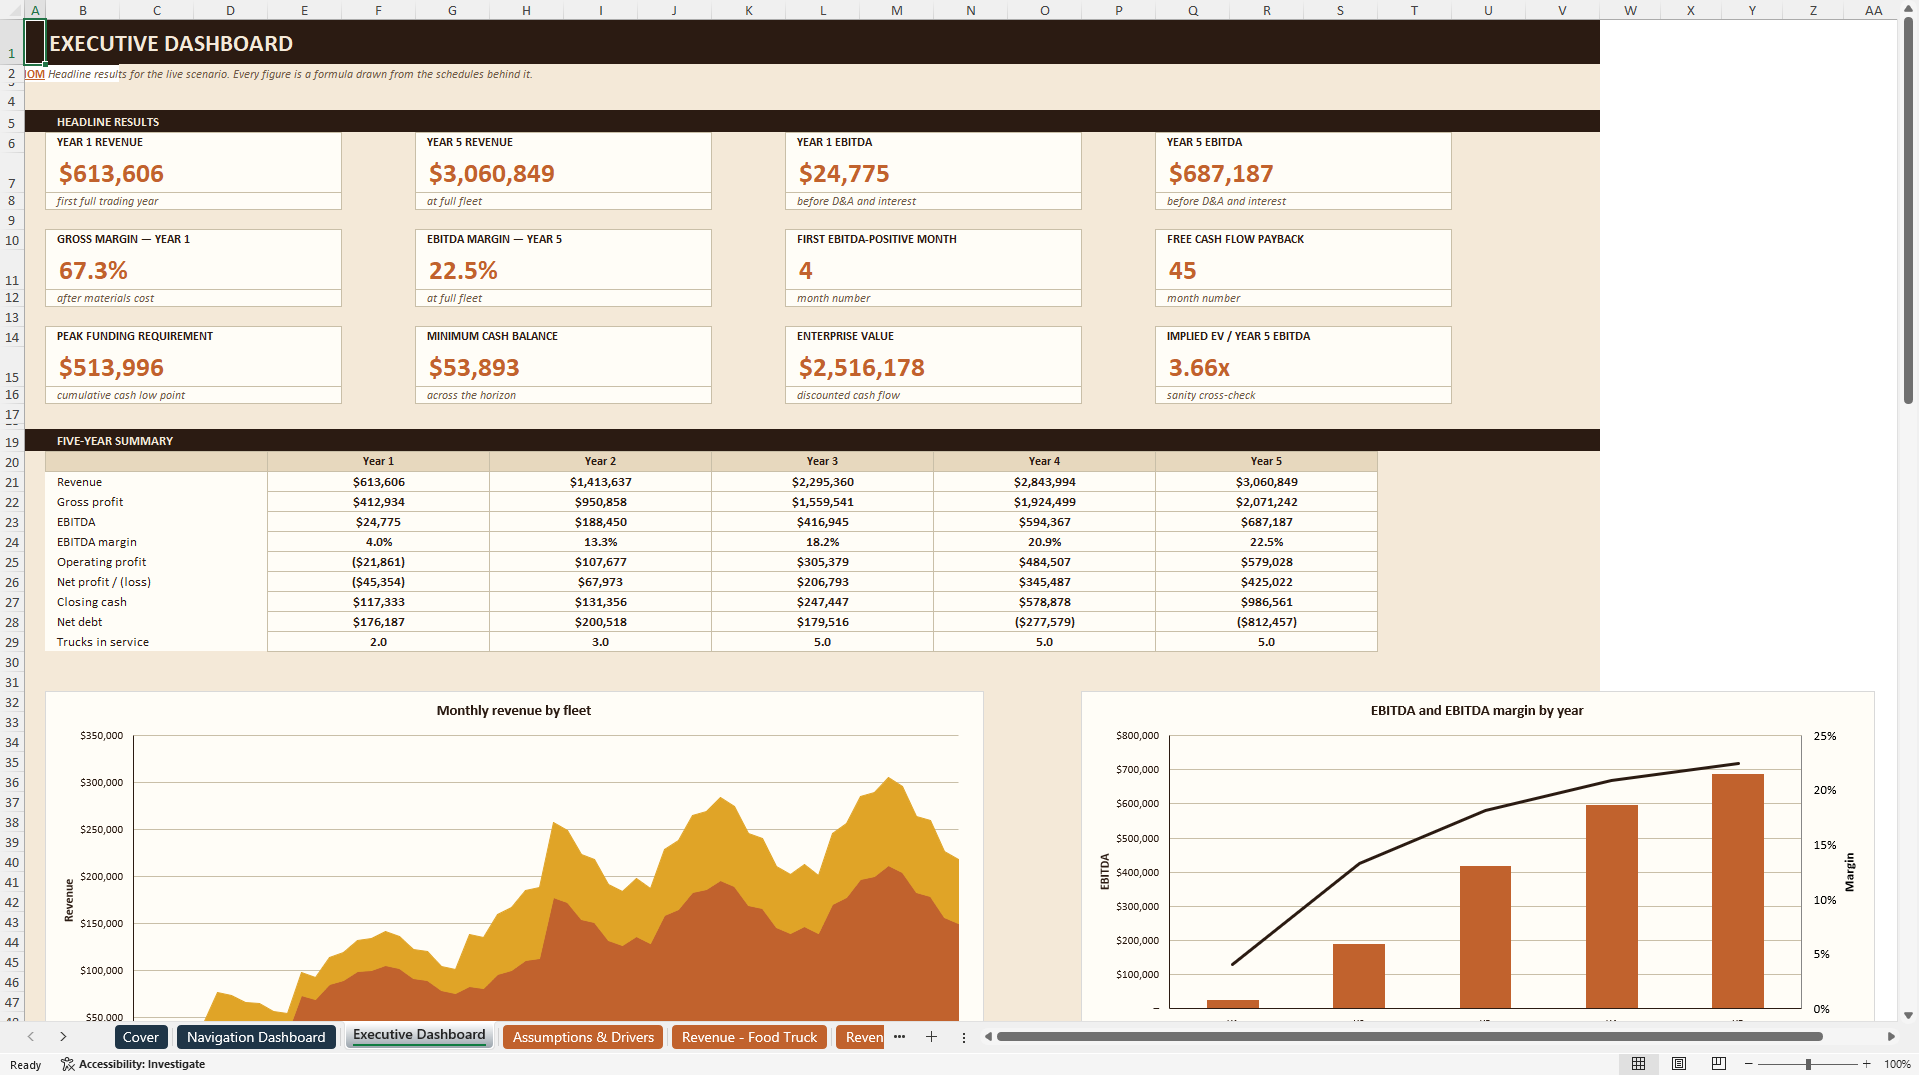
The Executive Dashboard presents Year 1 and Year 5 revenue and EBITDA, gross and EBITDA margins, first EBITDA-positive month, free-cash-flow payback, peak funding requirement, minimum cash balance, enterprise value and implied EV/Year 5 EBITDA. Charts show monthly revenue by fleet, EBITDA and margin progression, cash position, capital structure, the Year 5 profit bridge and the Year 1 cash-flow bridge.
Analysis sheets support practical decision-making. Break-Even Analysis measures EBITDA, full-cost and debt-service break-even revenue, transaction requirements, margin of safety, milestone months, payback and funding need. Unit Economics compares food and coffee formats by truck, trading day and transaction, including contribution, capital payback and return on unit capital. Scenario Analysis restates Best, Base and Worst cases side by side. Sensitivity Analysis provides two-variable grids for ticket versus volume, food versus beverage cost, and WACC versus terminal growth. Valuation (DCF) calculates unlevered free cash flow, terminal values, enterprise value, equity value and implied project returns. Ratios & Health provides growth, profitability, return, liquidity, leverage, coverage and operating-efficiency measures.
The workbook contains 25 worksheets and is supplied in .xlsx format. A full-sheet PDF preview and curated PNG screenshots are included in the marketplace package.
Got a question about the product? Email us at support@flevy.com or ask the author directly by using the "Ask the Author a Question" form. If you cannot view the preview above this document description, go here to view the large preview instead.
Source: Best Practices in Financial Modeling, Restaurant Industry Excel: Food & Coffee Truck Financial Model - 5-Year Forecast Excel (XLSX) Spreadsheet, PDMM Financial Models
ABOUT THE AUTHOR

PDMM Financial Models develops professional, decision-ready Excel models for business owners, entrepreneurs, investors, consultants, analysts, and finance teams. Our objective is to transform complex business assumptions into clear, structured analysis that supports better planning and investment decisions.
Our models cover business planning, forecasting, budgeting, feasibility analysis,
... [read more]
Ask the Author a Question
You must be logged in to contact the author.




























