

Financial Model with Advanced DCF Valuation – Excel XLSX
Excel (XLSX)
BENEFITS OF THIS DOWNLOADABLE EXCEL DOCUMENT
- Provides a framework for preparing a financial model and do a sophisticated DCF valuation
- Performs the core valuation, calculating present value of free cash flows over 5 years, determining terminal value using selected method (e.g., Gordon Growth, H-model, exit multiple)
- Provides advanced sensitivity-, financial statement-, and DuPont analysis
INTEGRATED FINANCIAL MODEL EXCEL DESCRIPTION
This DCF model is a simple, user-friendly template with convenient features. The valuation is derived from the 3-statement financial model and is fully customizable to suit any type of business. It also includes detailed financial statement analysis and DuPont analysis, providing comprehensive insights into a company's financial health and performance.
The DCF model is comprised of the following tabs:
Inputs:
The Inputs tab allows you to define the general parameters for the valuation.
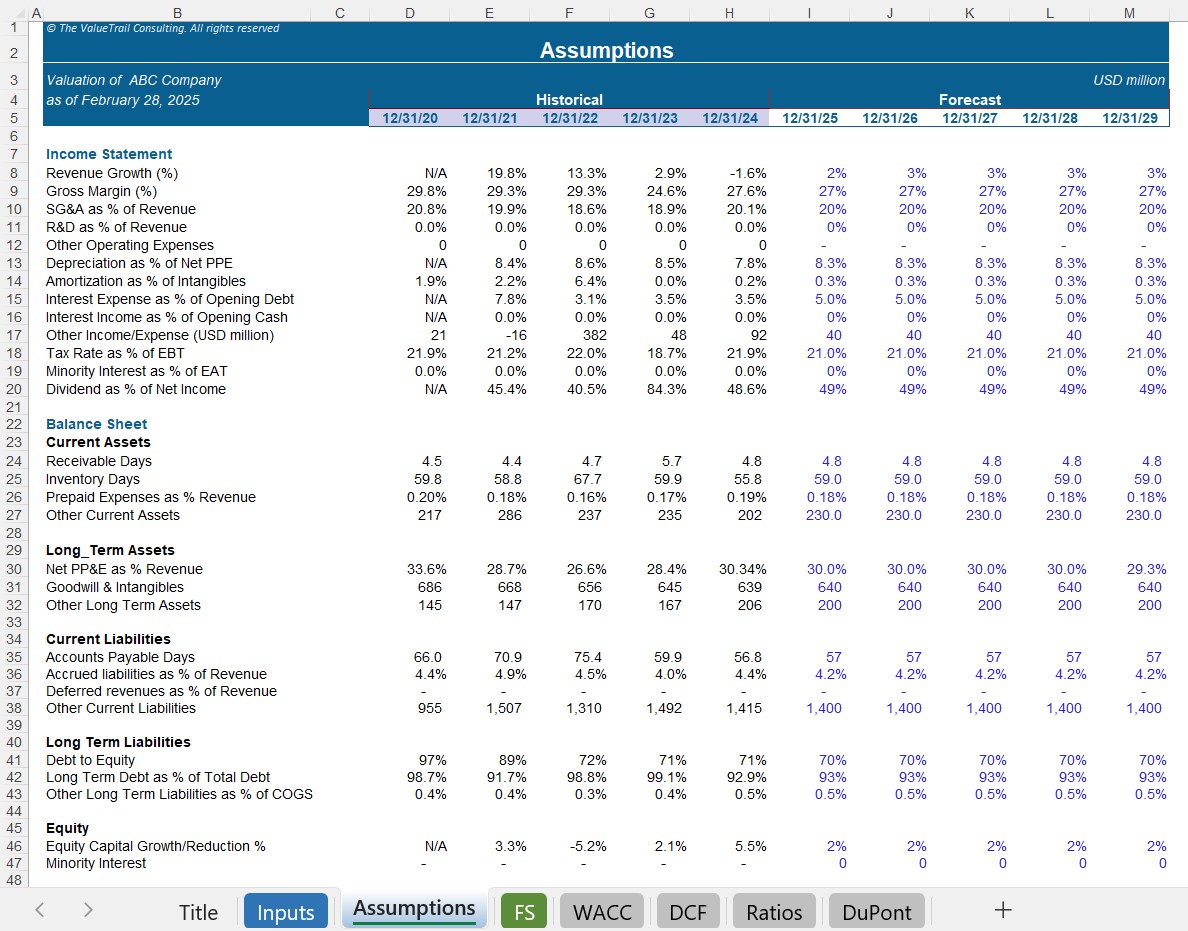
Assumptions:
The Assumptions tab is where you can define the key drivers for the financial statements.
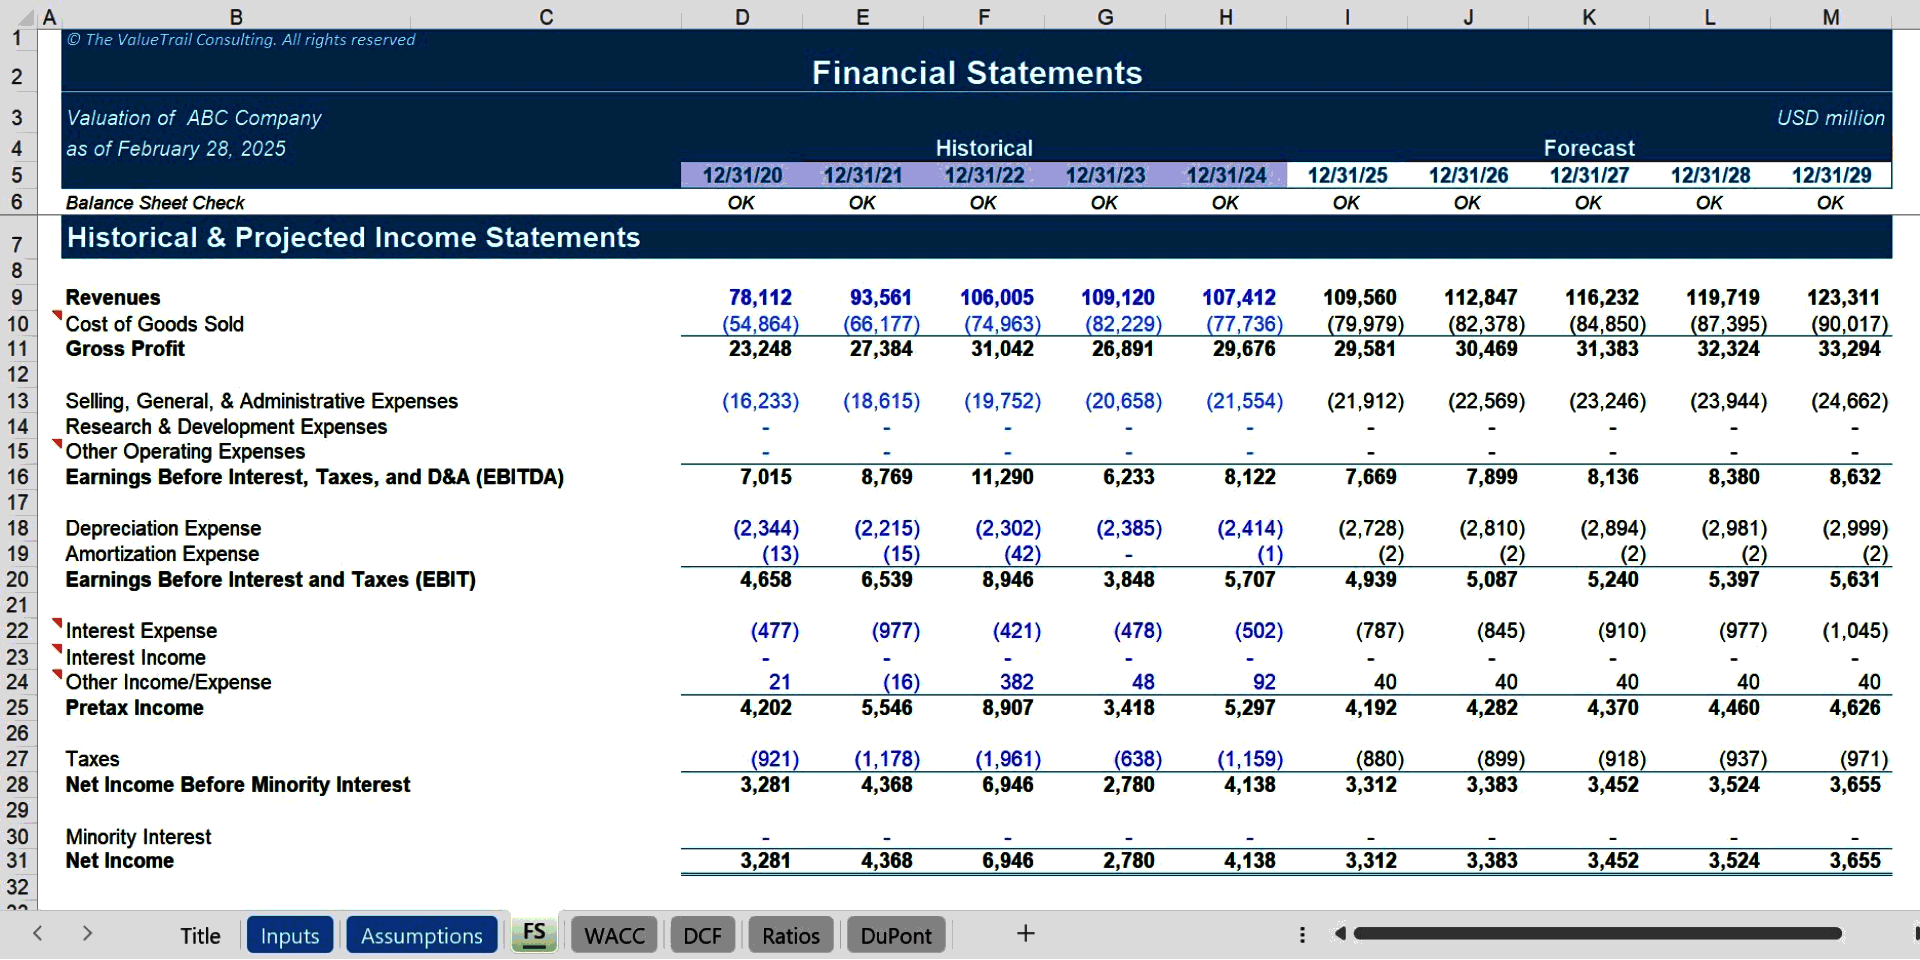
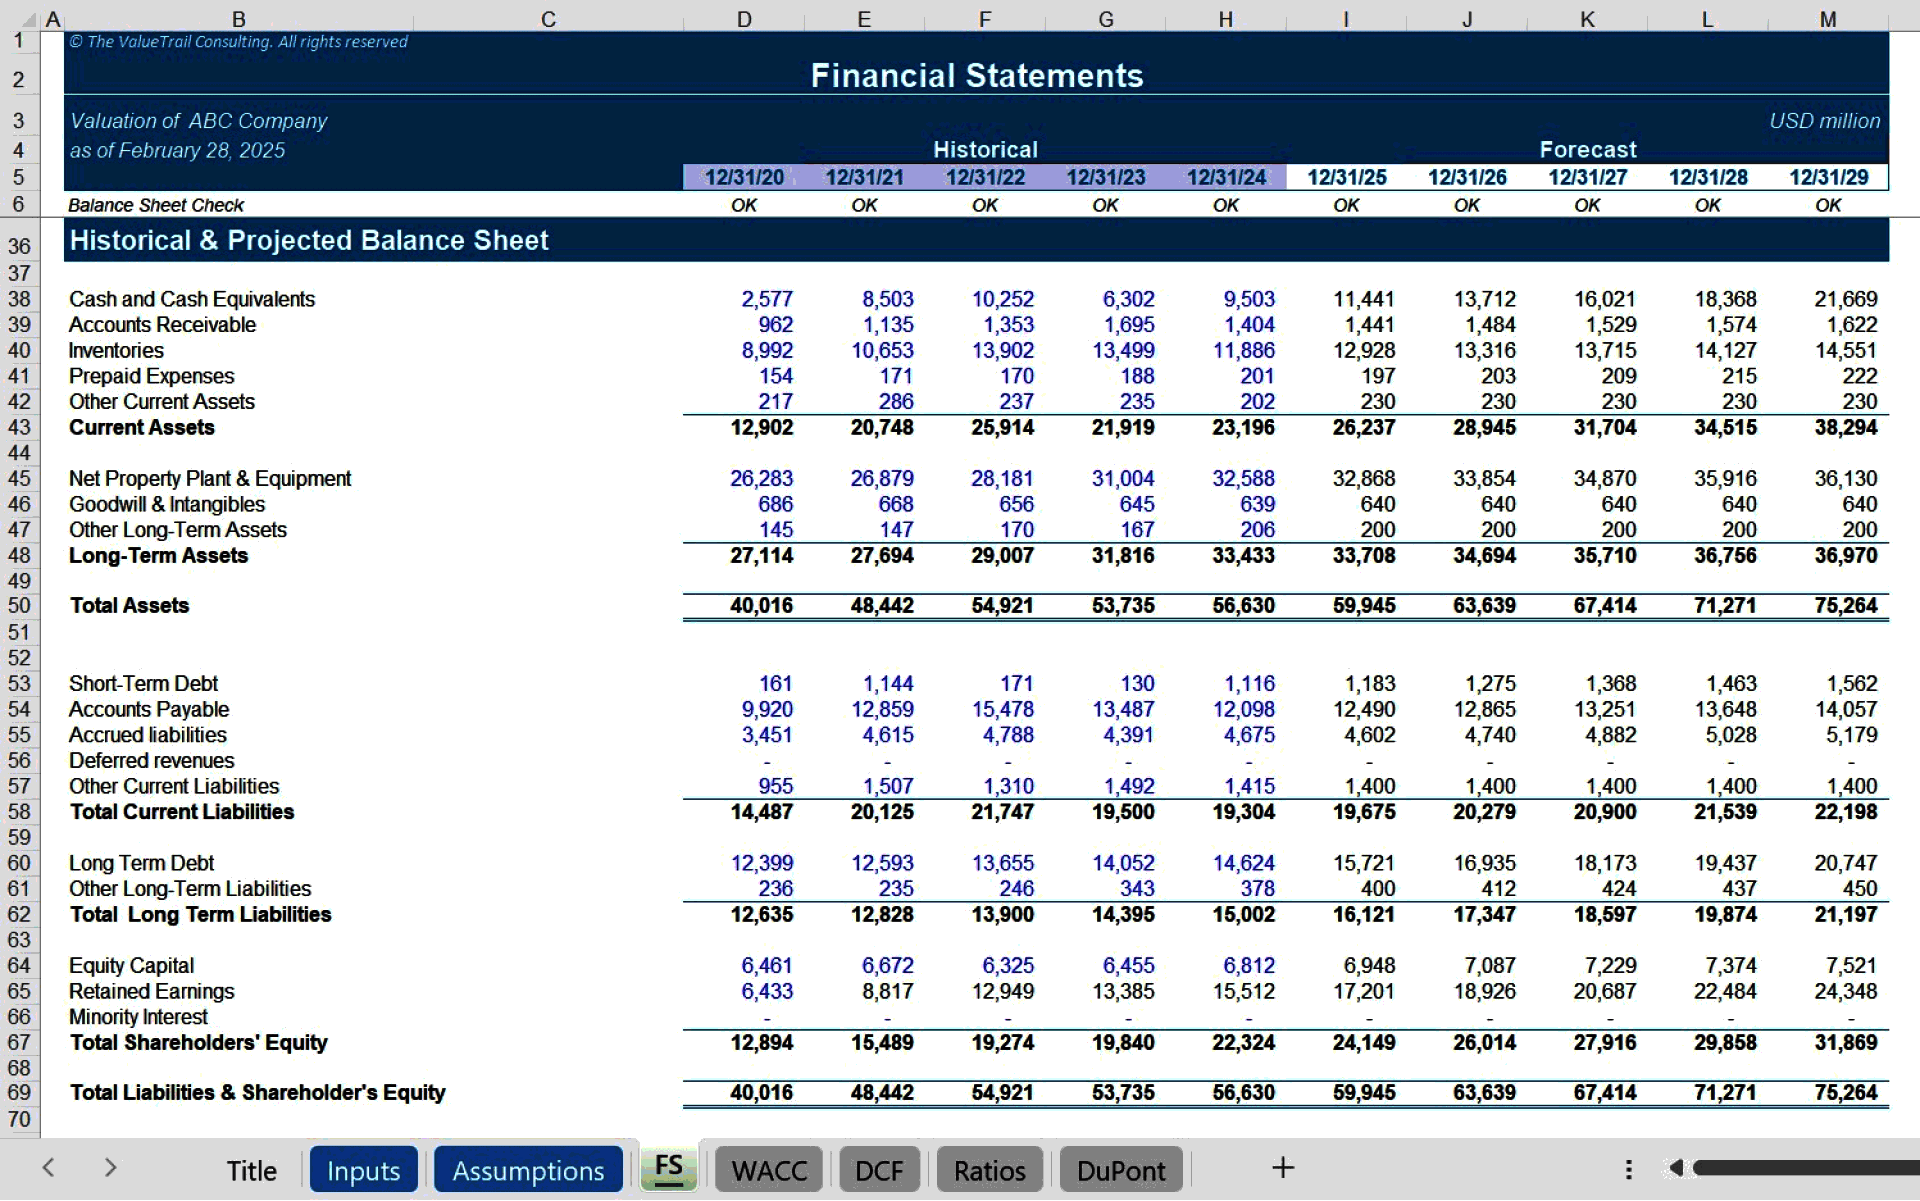
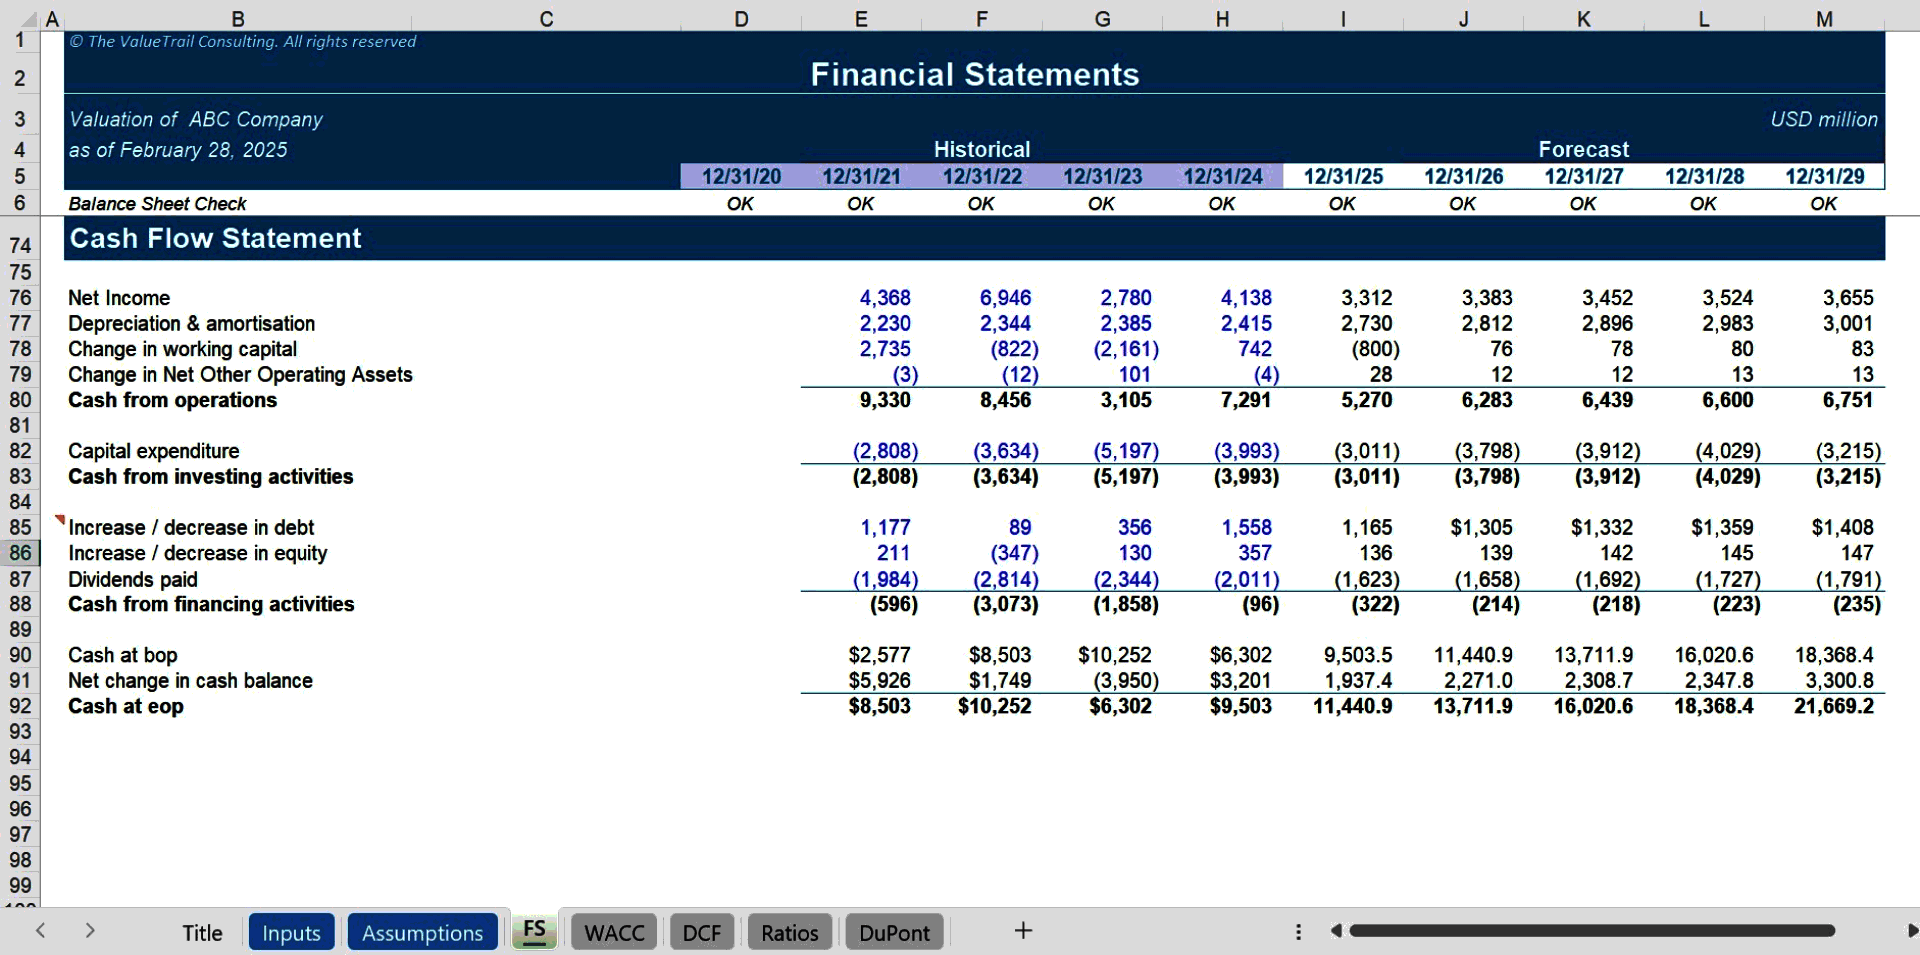
FS:
This tab contains the financial statements for the company, including the Income Statement (IS), Balance Sheet (BS), and Cash Flow Statement (CFS). The historical figures are inputted here, and all forecasts in this tab are dynamically calculated based on the inputs and assumptions defined in the previous tabs.
DCF:
The DCF tab performs the core valuation analysis. It calculates the present value of free cash flows over the explicit forecast period of 5 years. Determines the terminal value using the selected method (e.g. Gordon Growth model, H-model, exit multiple, etc.). Includes a stub year adjustment if the valuation date falls mid-year, ensuring accurate timing of cash flows. Provides a highly advanced sensitivity analysis to assess how changes in key variables impact the valuation. The sensitivity table automatically adjusts based on the chosen terminal value calculation method. This tab outputs the enterprise value (EV), equity value and the equity value per share, providing a clear estimate of the company's worth.
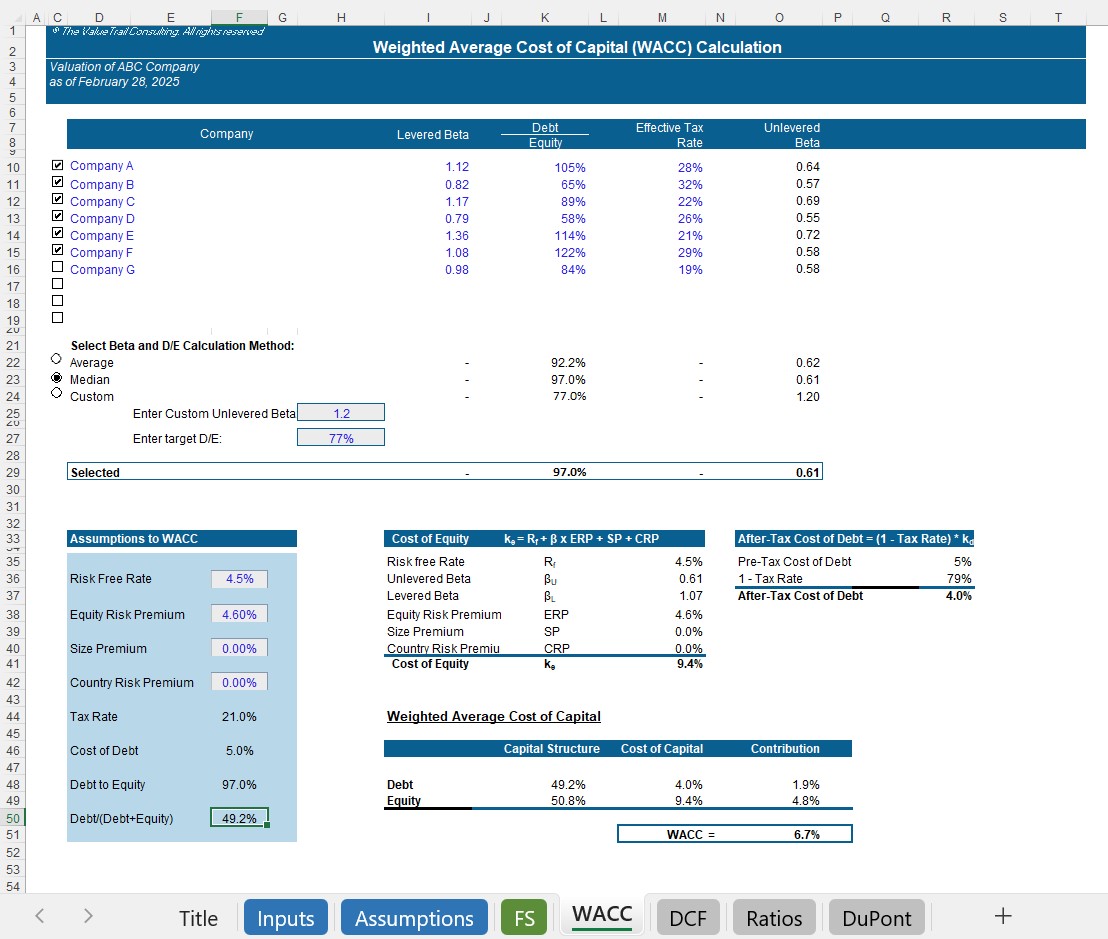
WACC:
The WACC tab calculates the discount rate used in the DCF analysis. The cost of equity is determined using the Capital Asset Pricing Model (CAPM). The capital structure and beta can either be derived from comparable companies that you input, or they can be entered manually (e.g., using industry averages, etc.).
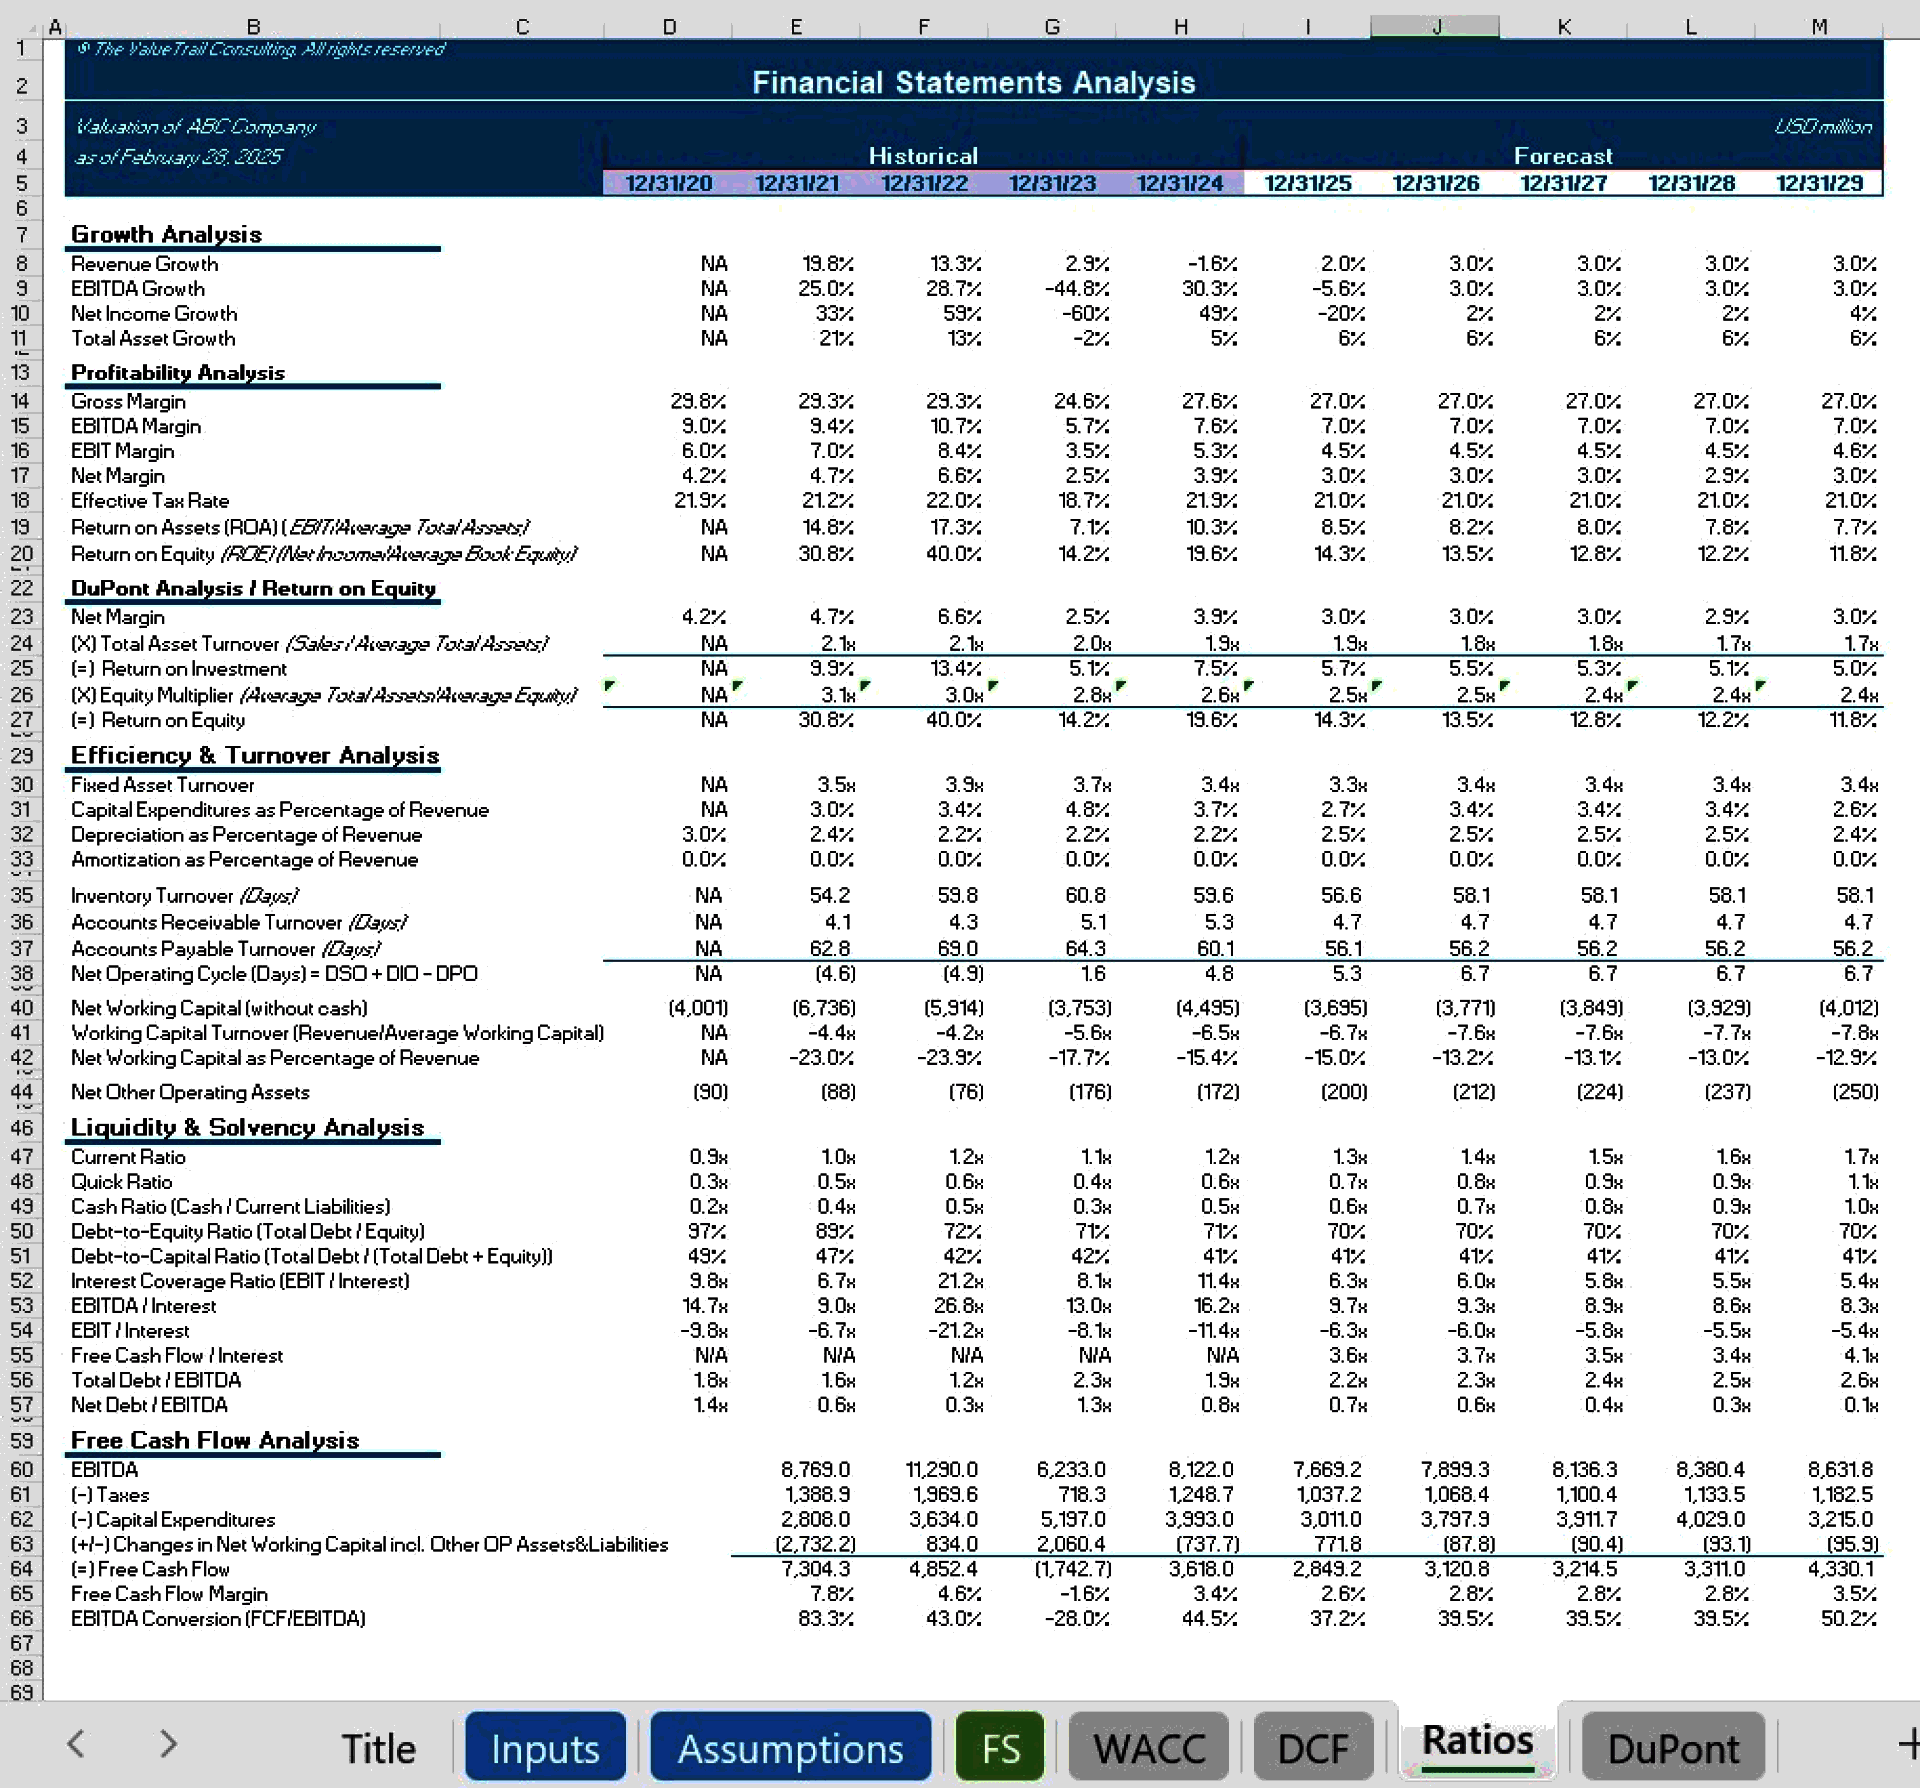
Ratios:
This tab performs a detailed financial statement analysis, calculating key metrics such as growth ratios, profitability ratios, efficiency ratios, liquidity and solvency ratios, Free Cash Flow Analysis.
DuPont Analysis:
The DuPont tab conducts a detailed five-step DuPont analysis , breaking down the company's Return on Equity (ROE) into its fundamental drivers.
Some supporting cells in the DCF tab related to the sensitivity analysis are locked to prevent overwriting and ensure proper functionality.
If you require customizations to this model or need a version tailored to your specific business, I'm happy to help.
For questions, customization requests, or custom financial modeling projects, feel free to contact me and I'll be glad to discuss your needs.
Additional details about our firm and services are available online under The ValueTrail Consulting.
Got a question about the product? Email us at support@flevy.com or ask the author directly by using the "Ask the Author a Question" form. If you cannot view the preview above this document description, go here to view the large preview instead.
Source: Best Practices in Integrated Financial Model Excel: Financial Model with Advanced DCF Valuation Excel (XLSX) Spreadsheet, The ValueTrail Consulting
ABOUT THE AUTHOR
At The ValueTrail Consulting, we specialize in financial modeling, business valuation, and business planning, providing both consulting assignments and tailored analytical support to businesses and investors. Our experience spans complex valuation analyses and the development of structured, decision-oriented financial models used in real-world transactions and strategic planning.
Building on
... [read more]
Ask the Author a Question
You must be logged in to contact the author.
