
Creator Economy Platform Business 10-Year Financial Model – Excel XLSX
Excel (XLSX)
BENEFITS OF THIS DOWNLOADABLE EXCEL DOCUMENT
- Provides a comprehensive framework for forecasting the financial performance of a creator economy platform over a 10-year horizon.
- Helps founders and analysts model creator growth, fan monetization, and platform revenue across multiple product lines.
- Supports strategic planning, fundraising, and investor analysis with a fully integrated three-statement financial projection system.
INTEGRATED FINANCIAL MODEL EXCEL DESCRIPTION
Curated by McKinsey-trained Executives
🎨 Creator Economy Platform Financial Model (10-Year Forecast)
The Complete Financial Planning & Forecasting System for Creator Economy Startups, Fan Monetization Platforms, and Digital Content Businesses 📊
The Creator Economy Platform Financial Model is a fully integrated 10-year financial forecasting Excel workbook built specifically for creator economy companies, fan subscription platforms, digital content marketplaces, and creator SaaS businesses.
This model allows you to project and analyze:
• creator acquisition, retention, and monetization across the full 10-year horizon
• revenue by product line: fan subscriptions, digital content, creator SaaS tools, tips & donations, and brand partnerships
• creator payouts, payment processing, hosting, and trust & safety costs
• gross profit margins driven by platform take rate and creator payout economics
• operating expenses and a detailed 15-role headcount plan
• capital expenditures and PP&E depreciation schedules across 4 asset categories
• working capital: receivables, creator payables, prepaid expenses, and deferred revenue
• debt, equity, and staged venture financing structures including seed, Series A through C, and venture debt rounds
• full 3-statement financial projections
All financial projections are driven by core creator economy operating drivers – not simple revenue growth assumptions.
No generic templates.
No simplified financial calculators.
Just a structured creator economy financial model designed around how real fan monetization platforms actually operate.
📊 Built Around Real Creator Economy Revenue Drivers
Unlike generic financial templates, this model reflects the real economics of a creator economy business.
Creator economy platforms generate revenue from multiple sources including:
• fan subscription take rates applied to gross creator transaction volume
• digital content sales commissions
• creator SaaS tool subscriptions billed monthly per paying creator
• tips, donations, and live event platform fees
• brand partnership and sponsorship marketplace commissions
Each of these drivers is modeled using operational assumptions defined in the Assumptions sheet and calculated across the 10-year forecast period.
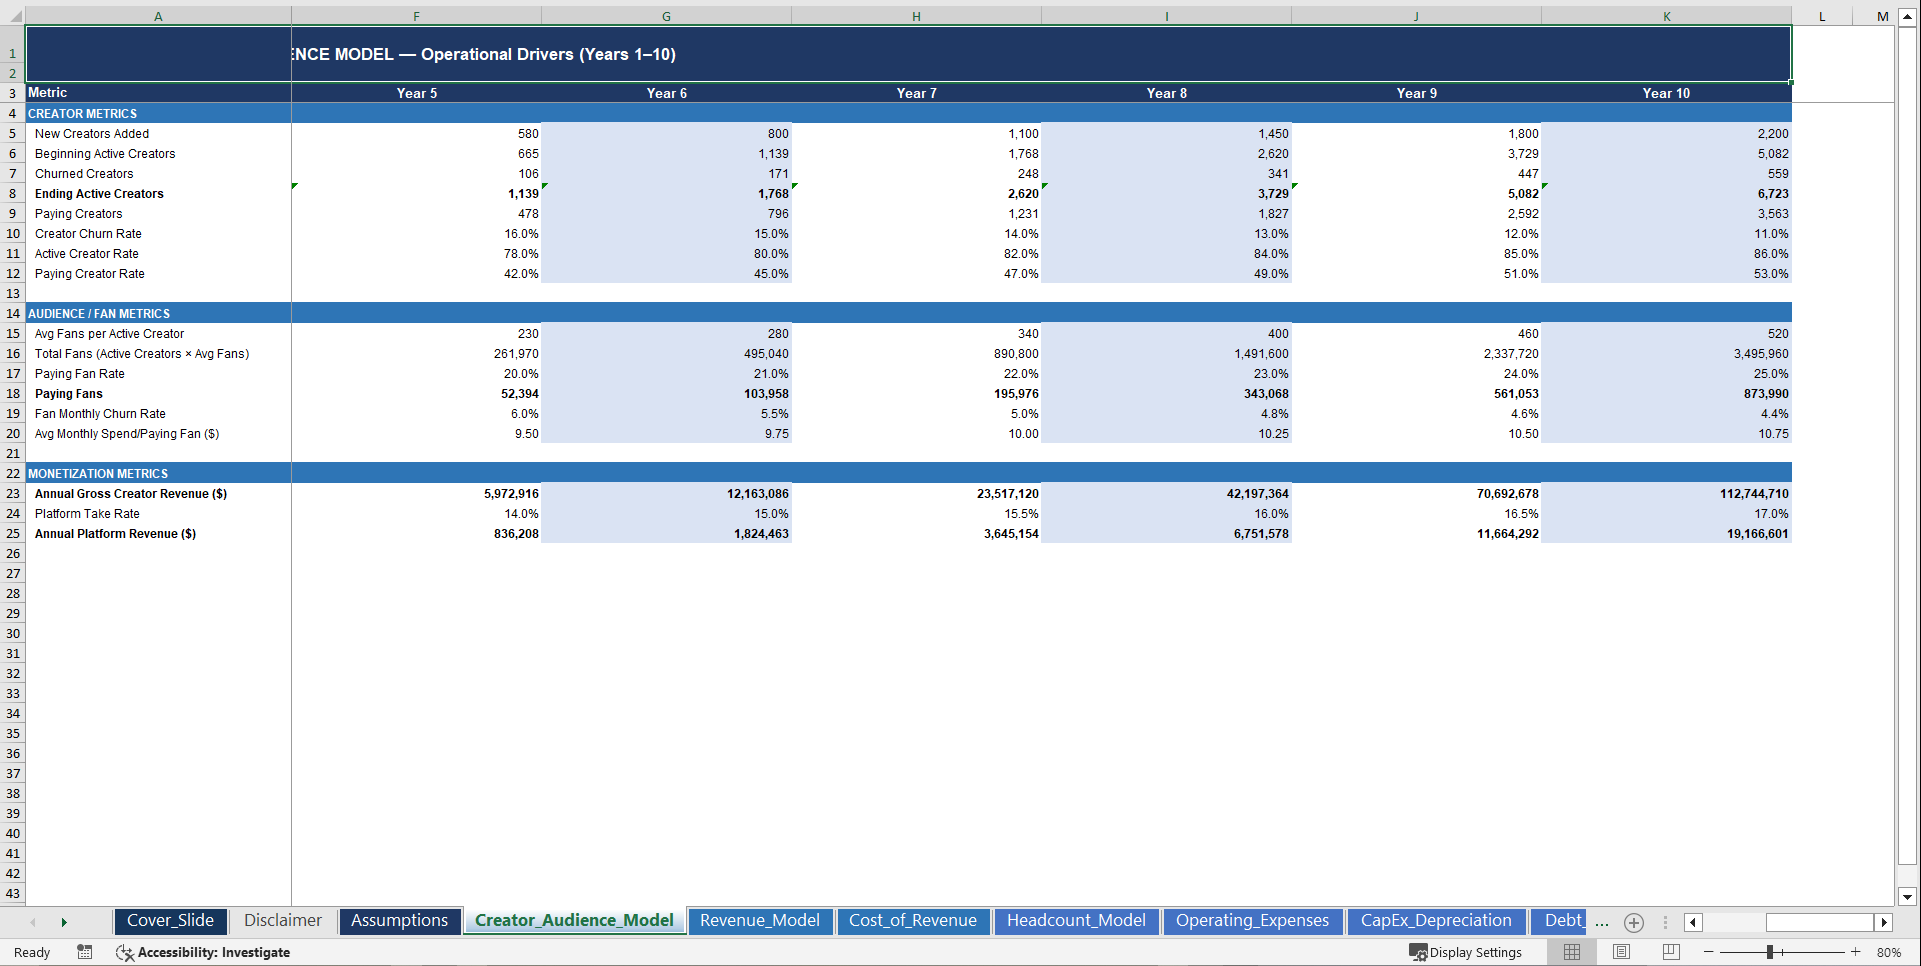
📑 Creator & Audience Model
The Creator & Audience Model is the core operational engine of the financial model.
It tracks the growth of creators, fans, and monetization activity over the entire forecast period.
Key creator economy drivers include:
• new creators added per year with a configurable annual acquisition rate
• creator churn rate declining year by year as the platform matures
• active creator rate and paying creator conversion tracked separately
• average fans per active creator scaling with platform network effects
• paying fan conversion rate growing year over year across the forecast
• average monthly spend per paying fan with annual price escalation
From these inputs, the model automatically calculates:
• beginning and ending active creator counts each year
• churned creators subtracted from the opening base
• total fan pool and paying fan base
• gross creator revenue generated on the platform
• platform revenue after applying the configurable take rate
These metrics drive the entire revenue structure of the creator economy platform.
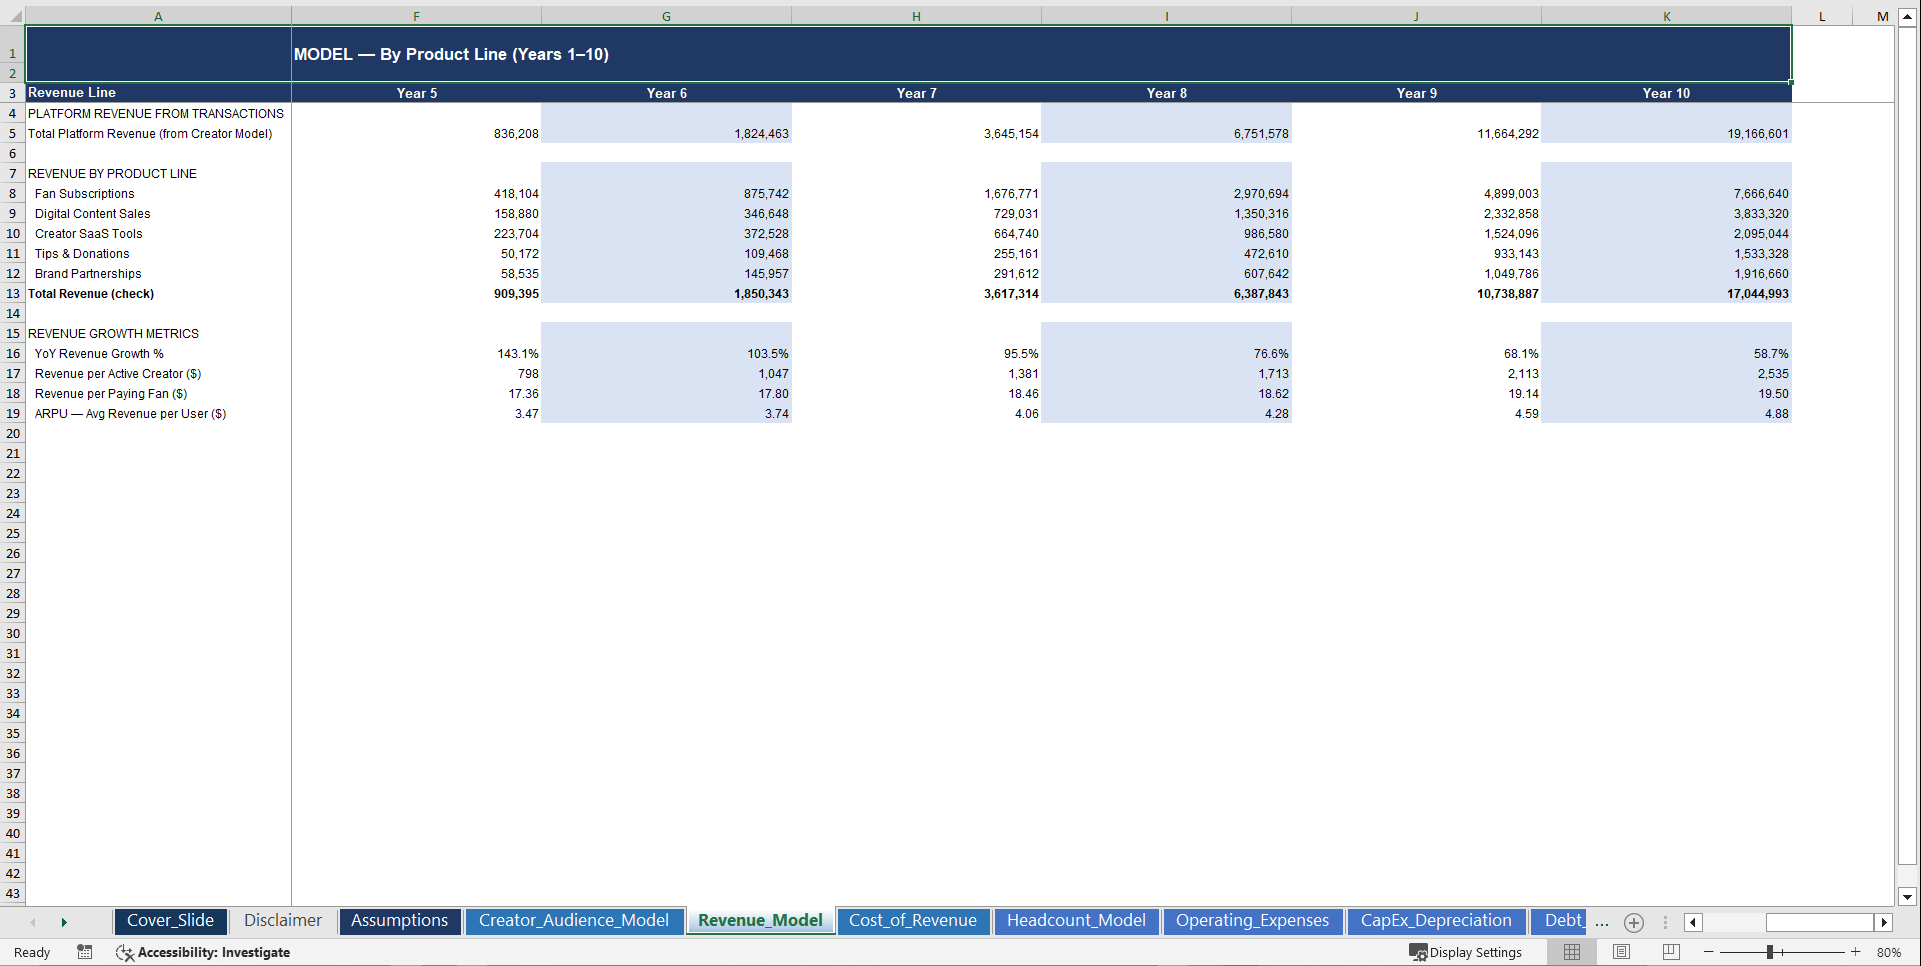
💰 Revenue Model
Creator economy platform revenue is generated from five distinct product lines across multiple monetization layers.
The model calculates revenue using:
• paying fans linked directly from the Creator & Audience Model
• average monthly spend per paying fan with annual escalation
• creator SaaS tool subscriptions billed per paying creator per month
• platform take rate – configurable and rising year over year
• brand partnership and tips revenue scaled as a percentage of total platform revenue
Revenue by product line is calculated automatically:
• fan subscription revenue
• digital content sales revenue
• creator SaaS tools revenue
• tips & donations revenue
• brand partnerships revenue
• total platform revenue
Summary metrics calculated automatically include:
• total revenue and year-on-year revenue growth %
• revenue per active creator
• revenue per paying fan
• ARPU across the total fan base
📉 COGS & Gross Margin Modeling
The Cost of Revenue schedule models the cost of facilitating creator monetization – with creator payouts as the dominant cost driver.
Cost of revenue is built from operationally-driven assumptions:
• creator payouts and revenue share as a configurable percentage of gross creator revenue – declining year over year as platform economics improve
• payment processing fees as a percentage of total platform revenue
• hosting and infrastructure costs driven by total fan user count and a per-user monthly hosting rate
• content moderation and trust & safety costs as a percentage of revenue
• customer support costs scaled to revenue
The model calculates each COGS component in full dollars, total cost of revenue, gross profit, and gross margin percentage – updated dynamically across all 10 years.
Gross margins reflect the creator payout-heavy economics of early-stage platform businesses – with improving unit economics year over year as the platform take rate rises and hosting costs are spread across a larger and larger user base.
This structure allows users to test how different take rate, payout rate, and hosting cost assumptions impact the path to sustainable gross margins.
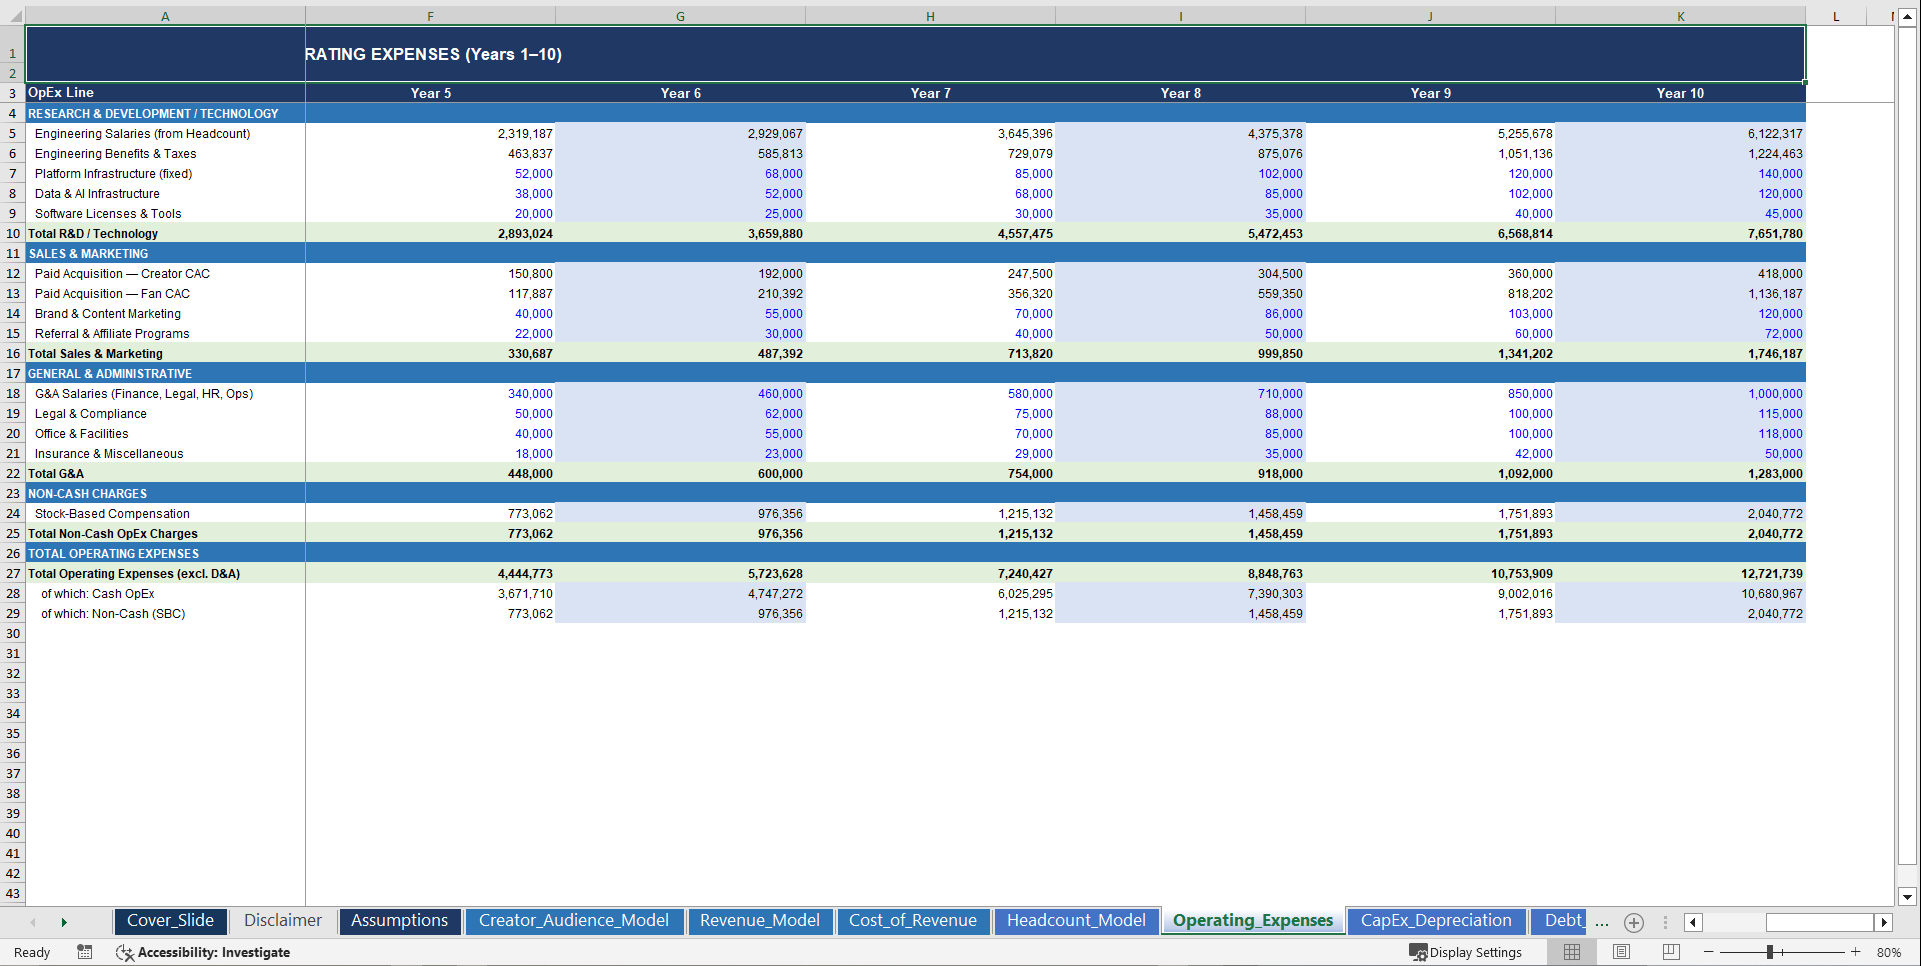
🧾 Operating Expense Structure
The Operating Expenses sheet models the full cost structure required to run a creator economy platform.
Expense line items included in the model:
R&D & Technology
• engineering salaries drawn directly from the Headcount Model
• engineering benefits and payroll taxes
• platform infrastructure fixed costs
• data & AI infrastructure investments
• software licenses & tools
Sales & Marketing
• creator paid acquisition – creator CAC multiplied by new creators added each year
• fan paid acquisition – fan CAC applied to audience growth
• brand & content marketing
• referral & affiliate program spend
General & Administrative
• G&A salaries for finance, legal, HR, and operations teams
• legal & compliance costs
• office & facilities costs
• insurance & miscellaneous
Non-Cash Charges
• stock-based compensation tracked separately at 15% of base salary
The model also calculates:
• total operating expenses in full dollars each year
• cash OpEx vs. non-cash OpEx split
• each OpEx category tracked across all 10 years
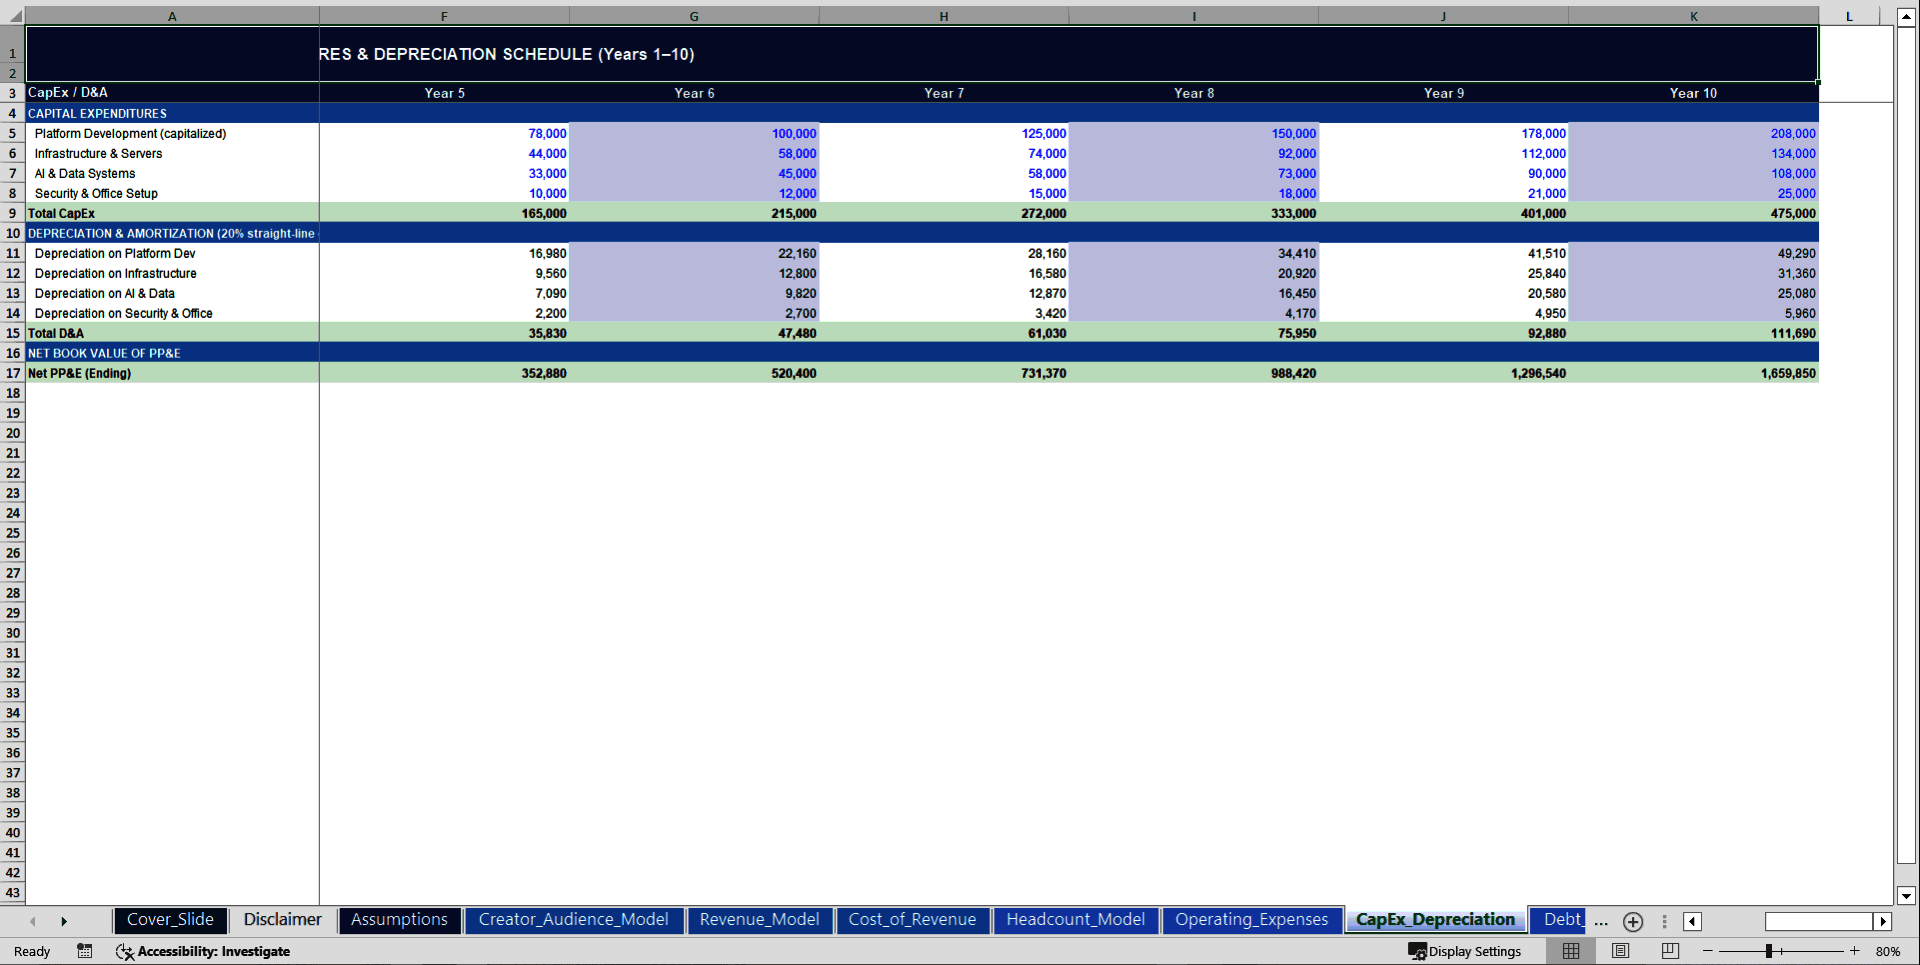
🏗 CapEx & Depreciation Schedule
The CapEx & Depreciation sheet models long-term capital investments required to build and grow the creator economy platform.
Capital expenditure categories include:
• platform development CapEx
• infrastructure & servers CapEx
• AI & data systems CapEx
• security & office setup CapEx
• total CapEx summed automatically across all 4 categories
The sheet includes a full depreciation schedule:
• annual depreciation calculated at 20% straight-line across all 4 asset categories
• depreciation by category tracked separately each year
• net PP&E book value roll-forward year by year
Depreciation flows automatically into the Income Statement, Cash Flow Statement, and Balance Sheet.
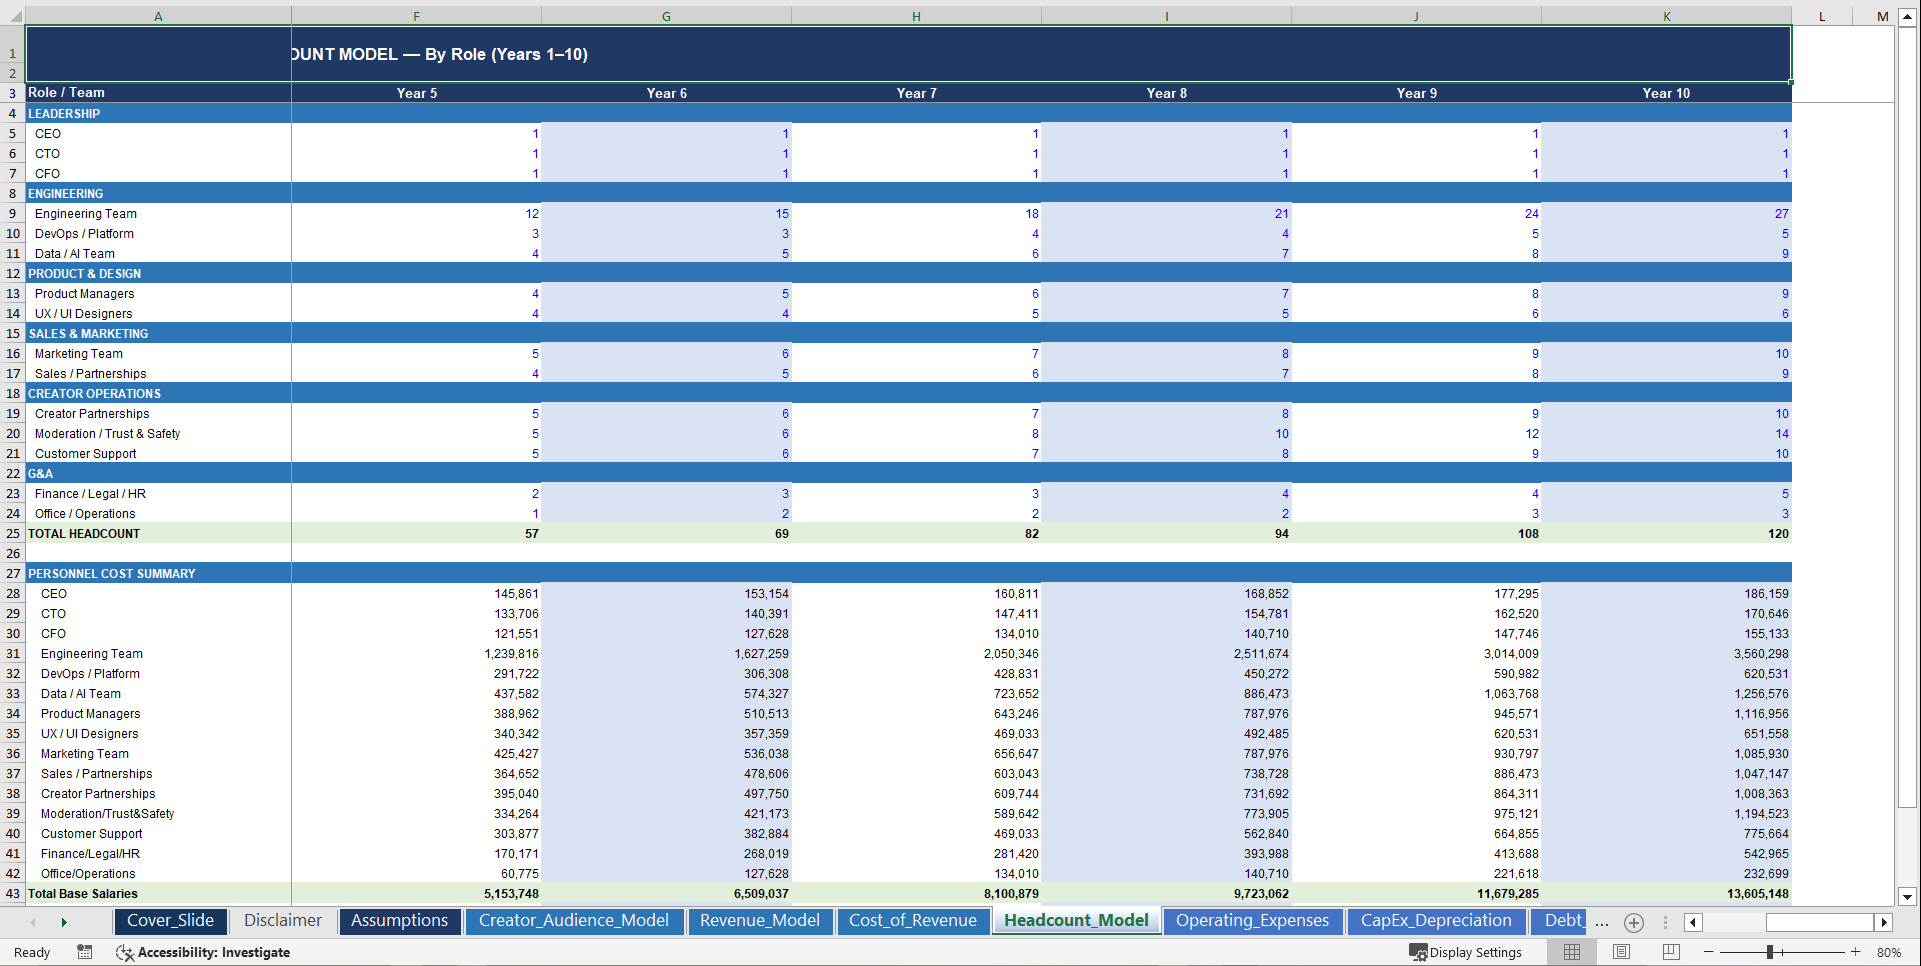
👥 Headcount Model
The Headcount Model breaks down 15 individual roles across 6 departments.
Departments and roles modeled include:
Leadership – CEO, CTO, CFO
Engineering – Engineering Team, DevOps / Platform, Data / AI Team
Product & Design – Product Managers, UX / UI Designers
Sales & Marketing – Marketing Team, Sales / Partnerships
Creator Operations – Creator Partnerships, Moderation / Trust & Safety, Customer Support
G&A – Finance / Legal / HR, Office / Operations
For each role, the model tracks:
• headcount by year across the full 10-year hiring plan
• base salary per role with 5% annual raises applied automatically
• benefits and payroll taxes at 20% of base salary
• bonus and variable compensation at 10% of base salary
• stock-based compensation at 15% of base salary
• total fully-loaded personnel cost calculated per year
Total headcount grows from 11 FTEs in Year 1 to 120 FTEs by Year 10 – driving all personnel-related cost lines across the operating expense schedule.
💼 Working Capital
The working capital dynamics are modeled across the full forecast – reflecting the real cash cycle of a creator economy platform.
Working capital line items include:
• accounts receivable – driven by days sales outstanding applied to annual revenue
• prepaid expenses – modeled as a percentage of total operating expenses
• accounts payable – driven by variable infrastructure and hosting obligations
• accrued expenses – driven by operating expense accrual rates
• deferred revenue – modeled as one month of fan subscription revenue
• creator payables – modeled as one month of creator payout obligations
Changes in each working capital line feed directly into the cash flow statement each year.
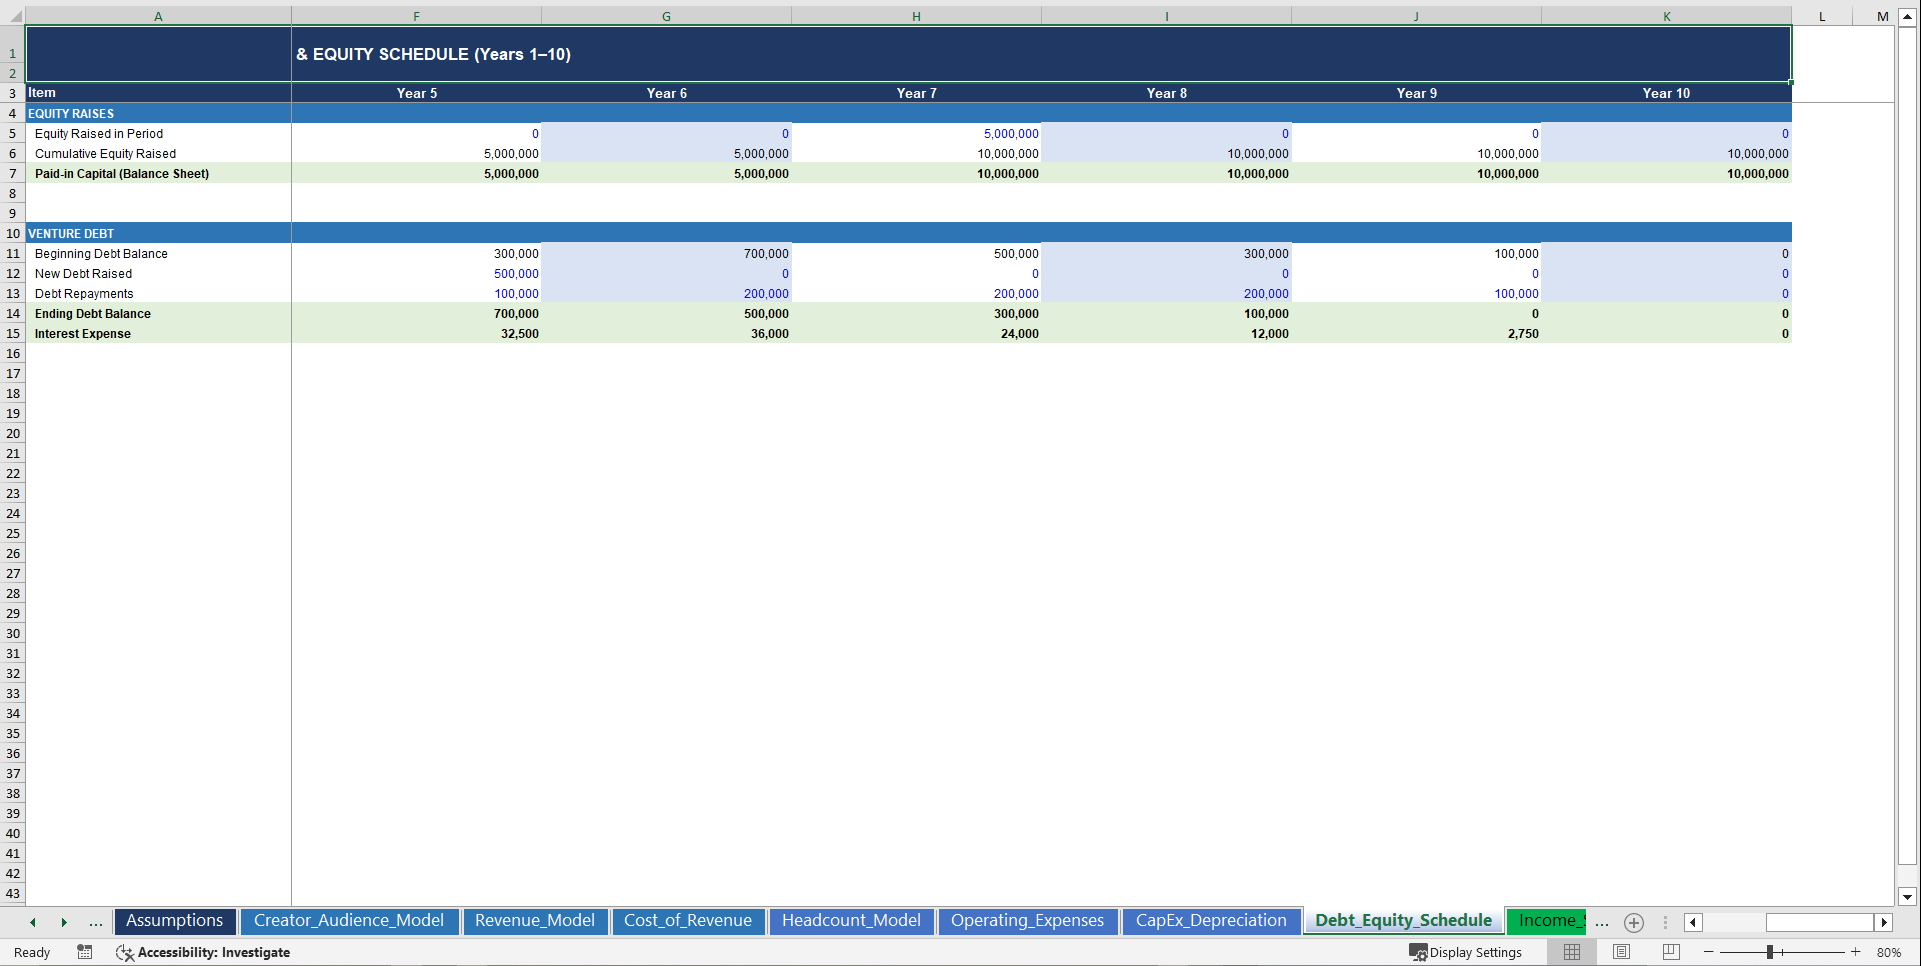
💳 Debt & Equity Schedule
The Debt & Equity sheet models the full financing structure of the creator economy platform across staged venture financing rounds.
Equity schedule includes:
• Seed Round in Year 1
• Series A in Year 2
• Series B in Year 4
• Series C in Year 7
• cumulative paid-in capital roll-forward across all 10 years
• cumulative SBC reserve tracked year by year
Venture debt schedule includes:
• venture debt drawn in Year 2 and again in Year 5
• annual repayment schedule across Years 3–8
• interest expense calculated on average annual debt balances
• configurable interest rates declining year over year
• closing debt balance roll-forward across all 10 years
💵 Fully Integrated 3-Statement Financial Model
All operational assumptions feed directly into a fully integrated financial model including:
• Income Statement
• Cash Flow Statement (Indirect Method)
• Balance Sheet
Changing a single assumption in the Assumptions sheet updates the entire financial model automatically – across all 13 sheets and 1,358 live linked formulas.
📑 Income Statement
The Income Statement tracks the full profitability of the creator economy platform across all 10 years.
Line items included:
• fan subscriptions, digital content, creator SaaS tools, tips, and brand partnerships – revenue shown by product line
• total revenue with year-on-year growth %
• creator payouts, payment processing, hosting, moderation, and customer support costs
• gross profit and gross margin %
• R&D / technology, sales & marketing, G&A, and stock-based compensation
• EBITDA and EBITDA margin %
• depreciation & amortization
• EBIT (operating income) and EBIT margin %
• interest expense on venture debt
• pre-tax income
• income tax expense – zero in loss years with NOL-aware tax calculation applying only to profitable periods
• net income and net margin %
💰 Cash Flow Statement
The Cash Flow Statement (Indirect Method) tracks the company's liquidity across all 10 years.
Operating Activities
• net income / (loss)
• depreciation & amortization add-back
• stock-based compensation add-back
• change in accounts receivable
• change in prepaid expenses
• change in accounts payable
• change in accrued expenses
• change in deferred revenue
• change in creator payables
• net cash from operations
Investing Activities
• capital expenditures across all 4 asset categories
• net cash from investing
Financing Activities
• equity raised by round
• venture debt drawn
• debt repaid
• net cash from financing
Cash Position
• net change in cash each year
• opening cash balance
• minimum cash floor enforced automatically
• closing cash balance – linked directly to the Balance Sheet
🧾 Balance Sheet
The Balance Sheet shows the financial position of the creator economy platform at the end of each forecast year.
Assets include:
• cash and cash equivalents
• accounts receivable
• prepaid expenses
• total current assets
• net PP&E
• capitalized software (net)
• total non-current assets
• total assets
Liabilities include:
• accounts payable
• accrued expenses
• deferred revenue
• creator payables
• total current liabilities
• venture debt (long-term)
• total liabilities
Shareholders' Equity includes:
• paid-in capital
• stock-based compensation reserve (cumulative)
• retained earnings / (deficit)
• total equity
• total liabilities and equity
The Balance Sheet includes a live reconciliation check cell – verifying assets equal liabilities plus equity across every year of the forecast.
📊 Sensitivity Analysis
The Sensitivity Analysis sheet allows users to stress test key creator economy assumptions.
Table 1: Platform Take Rate vs. New Creator Growth – Net Income at Year 10
Tests net income across a matrix of:
• platform take rates from 10% to 19%
• new creators added per year from 50 to 300
Table 2: Fan Monthly Churn Rate vs. Creator CAC – EBITDA at Year 5
Tests EBITDA across:
• fan monthly churn rates from 4% to 9%
• creator CAC from $200 to $400
Scenario Comparison Table – 5 pre-built scenarios compared side by side:
• Base Case
• High Growth Case
• Slow Growth Case
• Recession Case
• Viral Growth Case
Each scenario shows Year 5 revenue, Year 5 EBITDA, Year 10 revenue, Year 10 net income, break-even year, Year 10 cash balance, and LTV/CAC ratio.
Each sensitivity table uses color-coded conditional formatting – green for profitable outcomes, red for loss scenarios.
📈 Executive Dashboard
The Executive Dashboard provides a complete visual overview of the creator economy platform's 10-year performance.
8 live KPI cards showing Year 10 performance:
• total revenue
• gross margin %
• EBITDA
• net income
• active creators
• paying fans
• cash balance
• LTV / CAC ratio
6 fully working dynamic charts:
• Revenue & Gross Profit bar chart (10 years)
• EBITDA & Net Income line chart (10 years)
• Creator & Fan Growth line chart (10 years)
• Gross Margin % trend line chart (10 years)
• Cash Balance bar chart (10 years)
• Revenue Mix by Product stacked bar chart (10 years)
Conditional Management Alert Table – 4 live alerts:
• cash balance below threshold
• LTV/CAC ratio below 1.5x
• fan monthly churn rate above 10%
• gross margin below 45% in Year 5
All charts and alerts update automatically when assumptions change.
⚙️ Simple Professional Input Structure
The model uses a clean, professional Excel input system.
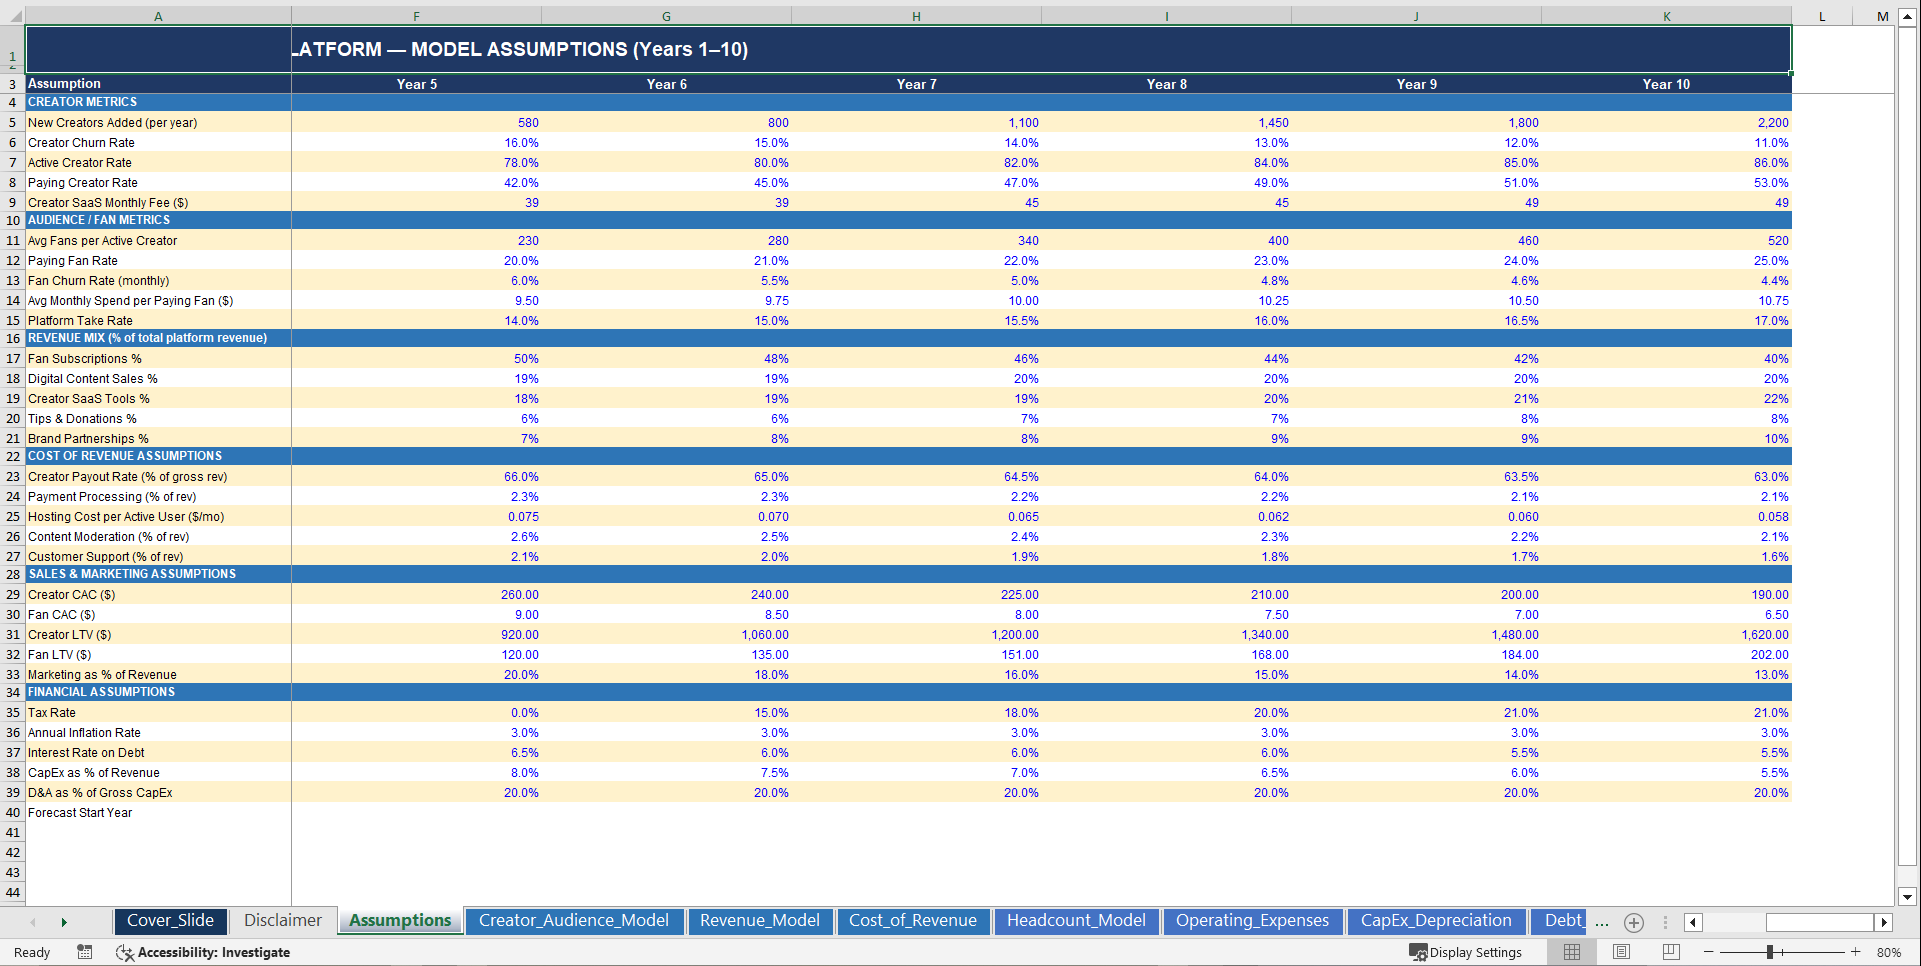
All major inputs are centralized in the Assumptions sheet, organized into six structured sections:
• Creator Metrics – new creators added per year, creator churn rate, active creator rate, paying creator rate, creator SaaS monthly fee
• Audience / Fan Metrics – avg fans per active creator, paying fan rate, fan monthly churn rate, avg monthly spend per paying fan, platform take rate
• Revenue Mix – percentage split across fan subscriptions, digital content, creator SaaS, tips & donations, and brand partnerships – configurable by year
• Cost of Revenue – creator payout rate, payment processing %, hosting cost per active user per month, content moderation %, customer support %
• Sales & Marketing – creator CAC, fan CAC, creator LTV, fan LTV, marketing as % of revenue
• Financial – tax rate, annual inflation rate, interest rate on debt, CapEx as % of revenue, D&A rate as % of gross CapEx, forecast start year
All inputs are formatted in blue text following industry-standard financial model color conventions. Changing any assumption instantly updates the entire financial model.
📊 Complete Workbook Structure
The model includes 13 structured Excel worksheets:
1️⃣ Dashboard
2️⃣ Assumptions
3️⃣ Creator & Audience Model
4️⃣ Revenue Model
5️⃣ Cost of Revenue
6️⃣ Headcount Model
7️⃣ Operating Expenses
8️⃣ CapEx & Depreciation
9️⃣ Debt & Equity Schedule
🔟 Income Statement
1️⃣1️⃣ Balance Sheet
1️⃣2️⃣ Cash Flow Statement
1️⃣3️⃣ Sensitivity Analysis
🎯 Who This Financial Model Is For
This model is designed for:
✔ Creator economy startups and fan monetization platforms
✔ Subscription content and digital product businesses
✔ Creator SaaS and community platform founders
✔ Patreon, Substack, and Kajabi competitors building at scale
✔ Financial analysts and CFOs at digital media companies
✔ Venture capital and growth equity investors evaluating creator economy deals
✔ Founders raising Seed through Series C rounds
✔ Strategic planners and investment bankers covering the creator economy sector
If your business monetizes creators, manages fan subscriptions, and scales digital content distribution, this model provides a complete financial forecasting system.
🚀 Build and Scale a Creator Economy Platform
The Creator Economy Platform Financial Model connects:
• creator acquisition and audience growth modeled from operational drivers
• fan audience scaling from a small early base to nearly 3.5 million total fans by Year 10
• paying fan base growing from under 500 in Year 1 to nearly 874,000 by Year 10
• active creators growing from 50 in Year 1 to over 6,700 by Year 10
• five product revenue lines with configurable mix shifts year by year
• creator payout economics and platform take rate optimization
• operating expenses and headcount scaling across 15 roles and 120 FTEs by Year 10
• capital expenditure and capitalized software amortization
• working capital and deferred revenue dynamics
• staged venture financing across Seed, Series A, B, and C equity rounds plus venture debt
into a single integrated financial forecasting system.
Everything flows into:
📊 clear financial projections
📈 operational performance metrics
💰 full 3-statement financial statements
A complete financial planning framework for building, analyzing, and scaling a modern creator economy platform.
✅ Perfect for fundraising and investor due diligence
✅ Investor-ready 10-year projections
✅ Institutional-grade model structure
✅ 13 sheets, 1,358 live linked formulas, zero errors
✅ Fully integrated Income Statement, Balance Sheet & Cash Flow Statement
✅ 10-year forecasting horizon from Year 1 through Year 10
Key Words:
Strategy & Transformation, Growth Strategy, Strategic Planning, Strategy Frameworks, Innovation Management, Pricing Strategy, Core Competencies, Strategy Development, Business Transformation, Marketing Plan Development, Product Strategy, Breakout Strategy, Competitive Advantage, Mission, Vision, Values, Strategy Deployment & Execution, Innovation, Vision Statement, Core Competencies Analysis, Corporate Strategy, Product Launch Strategy, BMI, Blue Ocean Strategy, Breakthrough Strategy, Business Model Innovation, Business Strategy Example, Corporate Transformation, Critical Success Factors, Customer Segmentation, Customer Value Proposition, Distinctive Capabilities, Enterprise Performance Management, KPI, Key Performance Indicators, Market Analysis, Market Entry Example, Market Entry Plan, Market Intelligence, Market Research, Market Segmentation, Market Sizing, Marketing, Michael Porter's Value Chain, Organizational Transformation, Performance Management, Performance Measurement, Platform Strategy, Product Go-to-Market Strategy, Reorganization, Restructuring, SWOT, SWOT Analysis, Service 4.0, Service Strategy, Service Transformation, Strategic Analysis, Strategic Plan Example, Strategy Deployment, Strategy Execution, Strategy Frameworks Compilation, Strategy Methodologies, Strategy Report Example, Value Chain, Value Chain Analysis, Value Innovation, Value Proposition, Vision Statement, Corporate Strategy, Business Development, Business plan pdf, business plan, PDF, Business Plan DOC, Business Plan Template, PPT, Market strategy playbook, strategic market planning, competitive analysis tools, market segmentation frameworks, growth strategy templates, product positioning strategy, market execution toolkit, strategic alignment playbook, KPI and OKR frameworks, business growth strategy guide, cross-functional strategy templates, market risk management, market strategy PowerPoint doc, guide, ebook, e-book ,McKinsey Change Playbook, Organizational change management toolkit, Change management frameworks 2025, Influence model for change, Change leadership strategies, Behavioral change in organizations, Change management PowerPoint templates, Transformational leadership in change, supply chain KPIs, supply chain KPI toolkit, supply chain PowerPoint template, logistics KPIs, procurement KPIs, inventory management KPIs, supply chain performance metrics, manufacturing KPIs, supply chain dashboard, supply chain strategy KPIs, reverse logistics KPIs, sustainability KPIs in supply chain, financial supply chain KPIs, warehouse KPIs, digital supply chain KPIs, 1200 KPIs, supply chain scorecard, KPI examples, supply chain templates, Corporate Finance SOPs, Finance SOP Excel Template, CFO Toolkit, Finance Department Procedures, Financial Planning SOPs, Treasury SOPs, Accounts Payable SOPs, Accounts Receivable SOPs, General Ledger SOPs, Accounting Policies Template, Internal Controls SOPs, Finance Process Standardization, Finance Operating Procedures, Finance Department Excel Template, FP&A Process Documentation, Corporate Finance Template, Finance SOP Toolkit, CFO Process Templates, Accounting SOP Package, Tax Compliance SOPs, Financial Risk Management Procedures.
NOTE: Our digital products are sold on an "as is" basis, making returns and refunds unavailable post-download. Please preview and inquire before purchasing. Please contact us before purchasing if you have any questions! This policy aligns with the standard Flevy Terms of Usage.
Got a question about the product? Email us at support@flevy.com or ask the author directly by using the "Ask the Author a Question" form. If you cannot view the preview above this document description, go here to view the large preview instead.
Source: Best Practices in Integrated Financial Model Excel: Creator Economy Platform Business 10-Year Financial Model Excel (XLSX) Spreadsheet, SB Consulting
ABOUT THE AUTHOR
SB Consulting is dedicated to empowering businesses to communicate their ideas with impact. This consulting firm specializes in teaching organizations how to create effective corporate and management presentations. With training from top-tier global consulting firms, including McKinsey, BCG, and Porsche Consulting, extensive expertise in presentation design and ... [read more]
Ask the Author a Question
You must be logged in to contact the author.
