
 Click main image to view in full screen.
Battery Storage (BESS) Model: Two-IRR Degradation Bridge – Excel XLSX
Excel (XLSX) + supplemental PDF


BENEFITS OF THIS DOWNLOADABLE EXCEL DOCUMENT
- The wear cost is proved, not asserted: set both degradation inputs to zero and the developer and bankable IRRs become numerically identical, and the quality suite checks that condition on every release.
- Warranty exposure is priced on its own line: aggressive stacking earns the highest IRR while exhausting guaranteed throughput in year 9.6 and leaving $9,232,610 of cell replacement uncovered, 86% of equity.
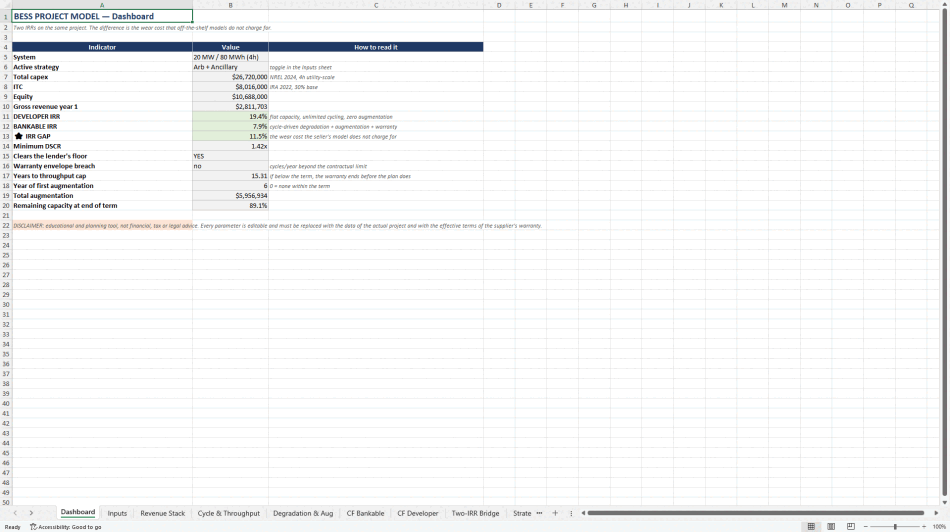
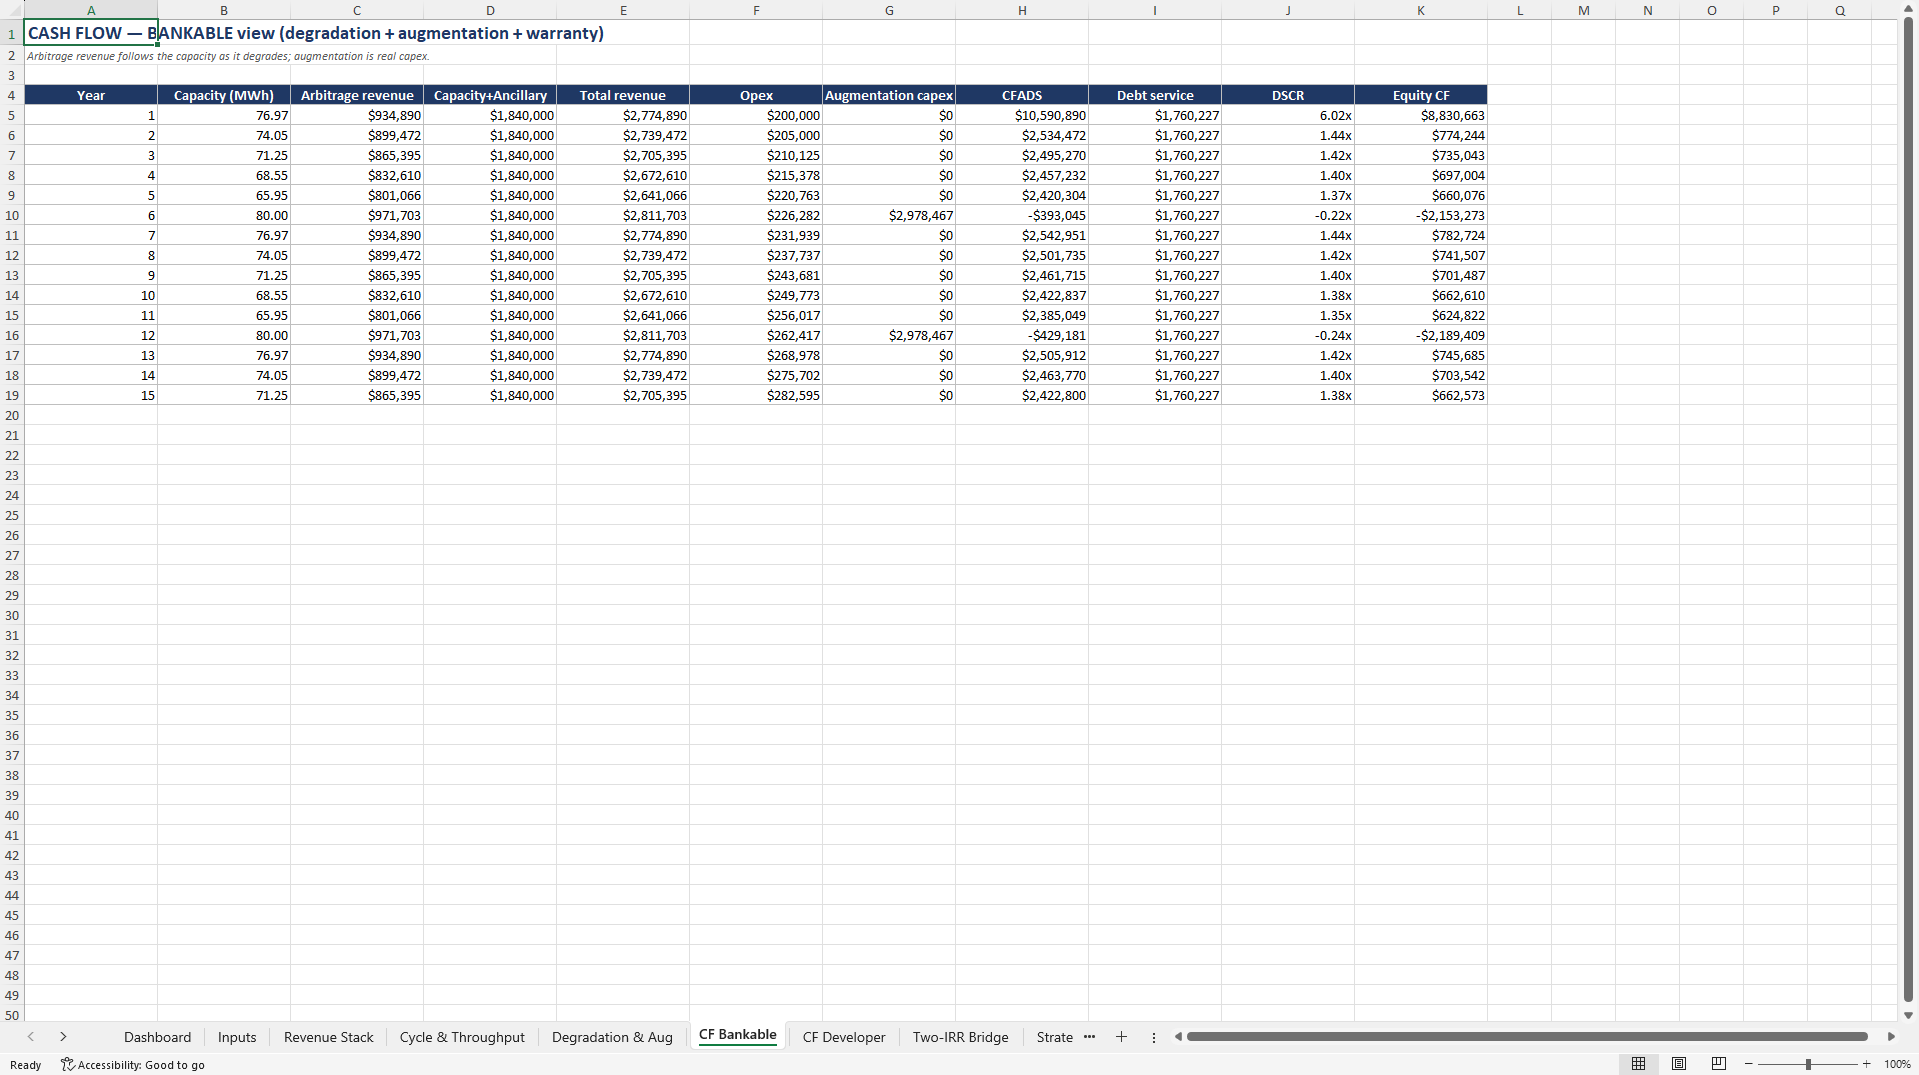
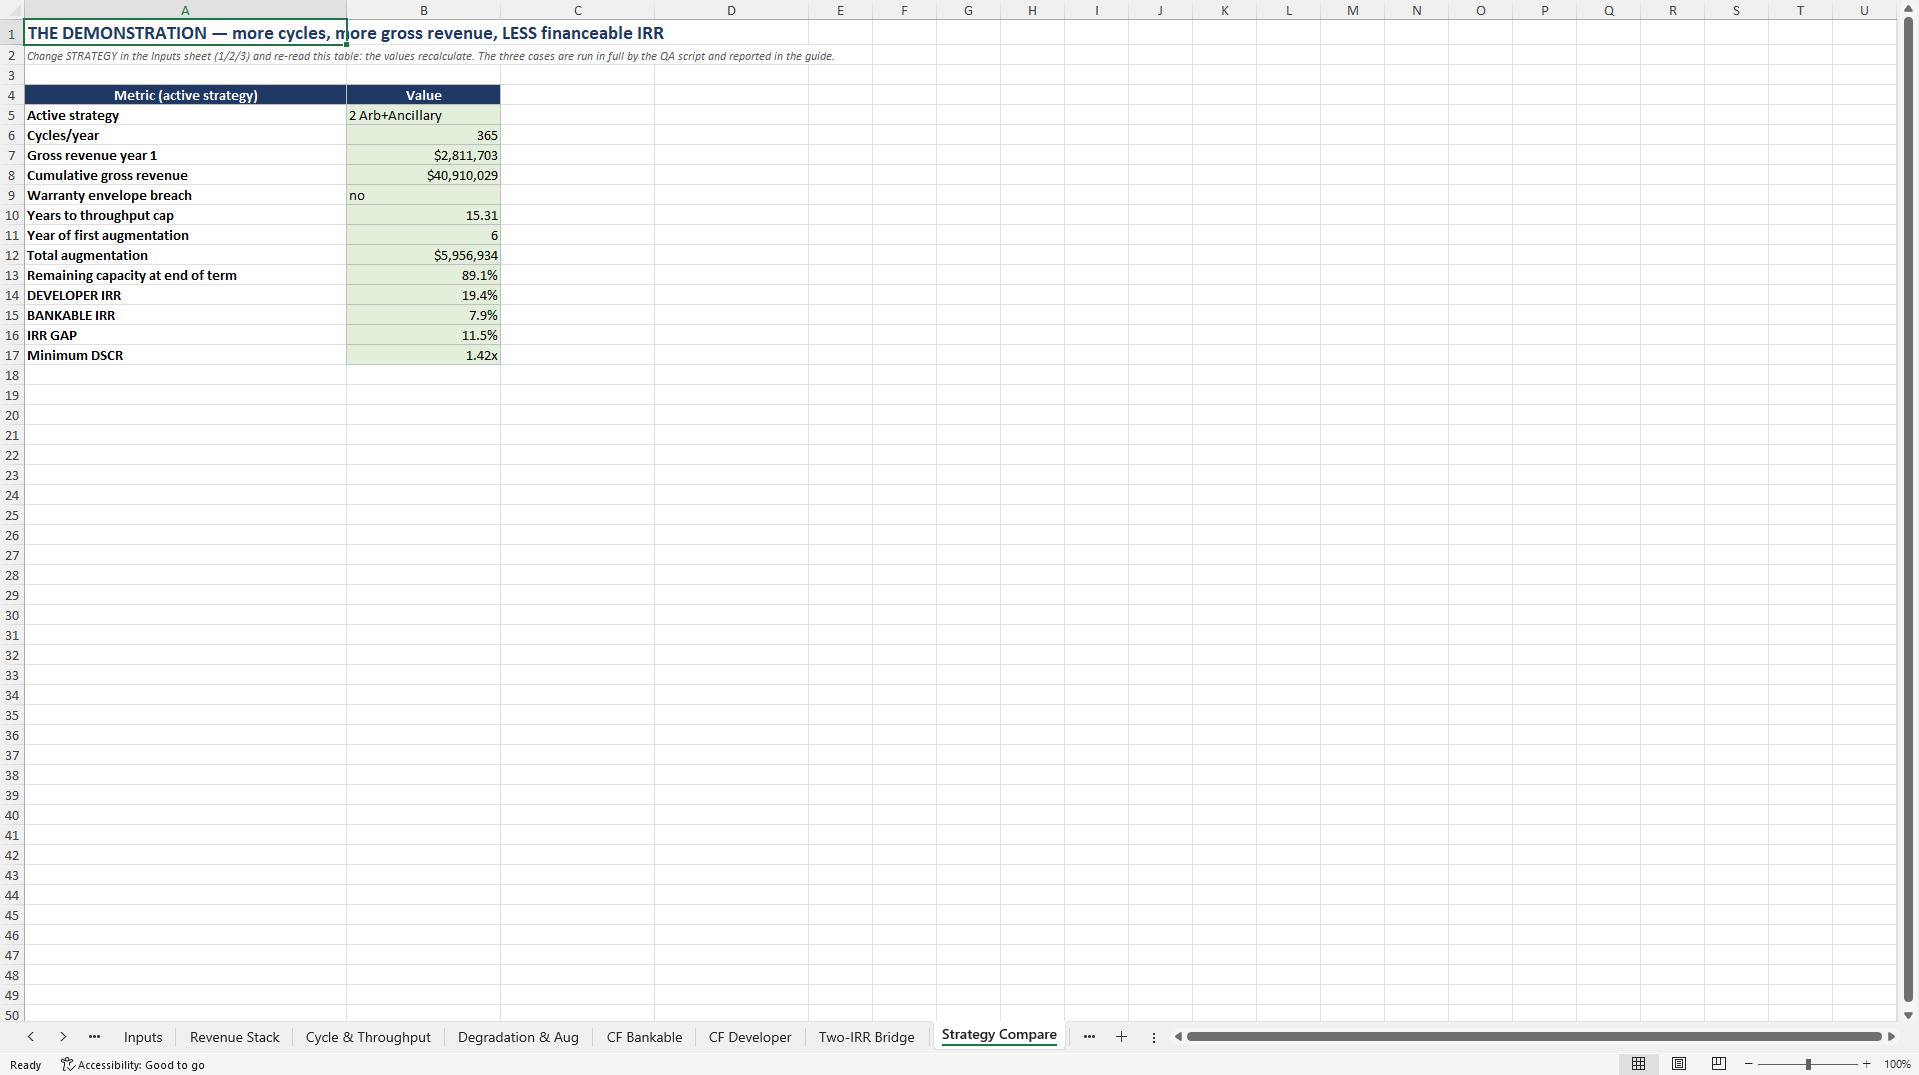
- Augmentation is a dated event, not a footnote: $5,956,934 lands in year 6 of the base case, with capacity at term end of 89.1% of nameplate and a minimum DSCR of 1.42x.
RENEWABLE ENERGY EXCEL DESCRIPTION
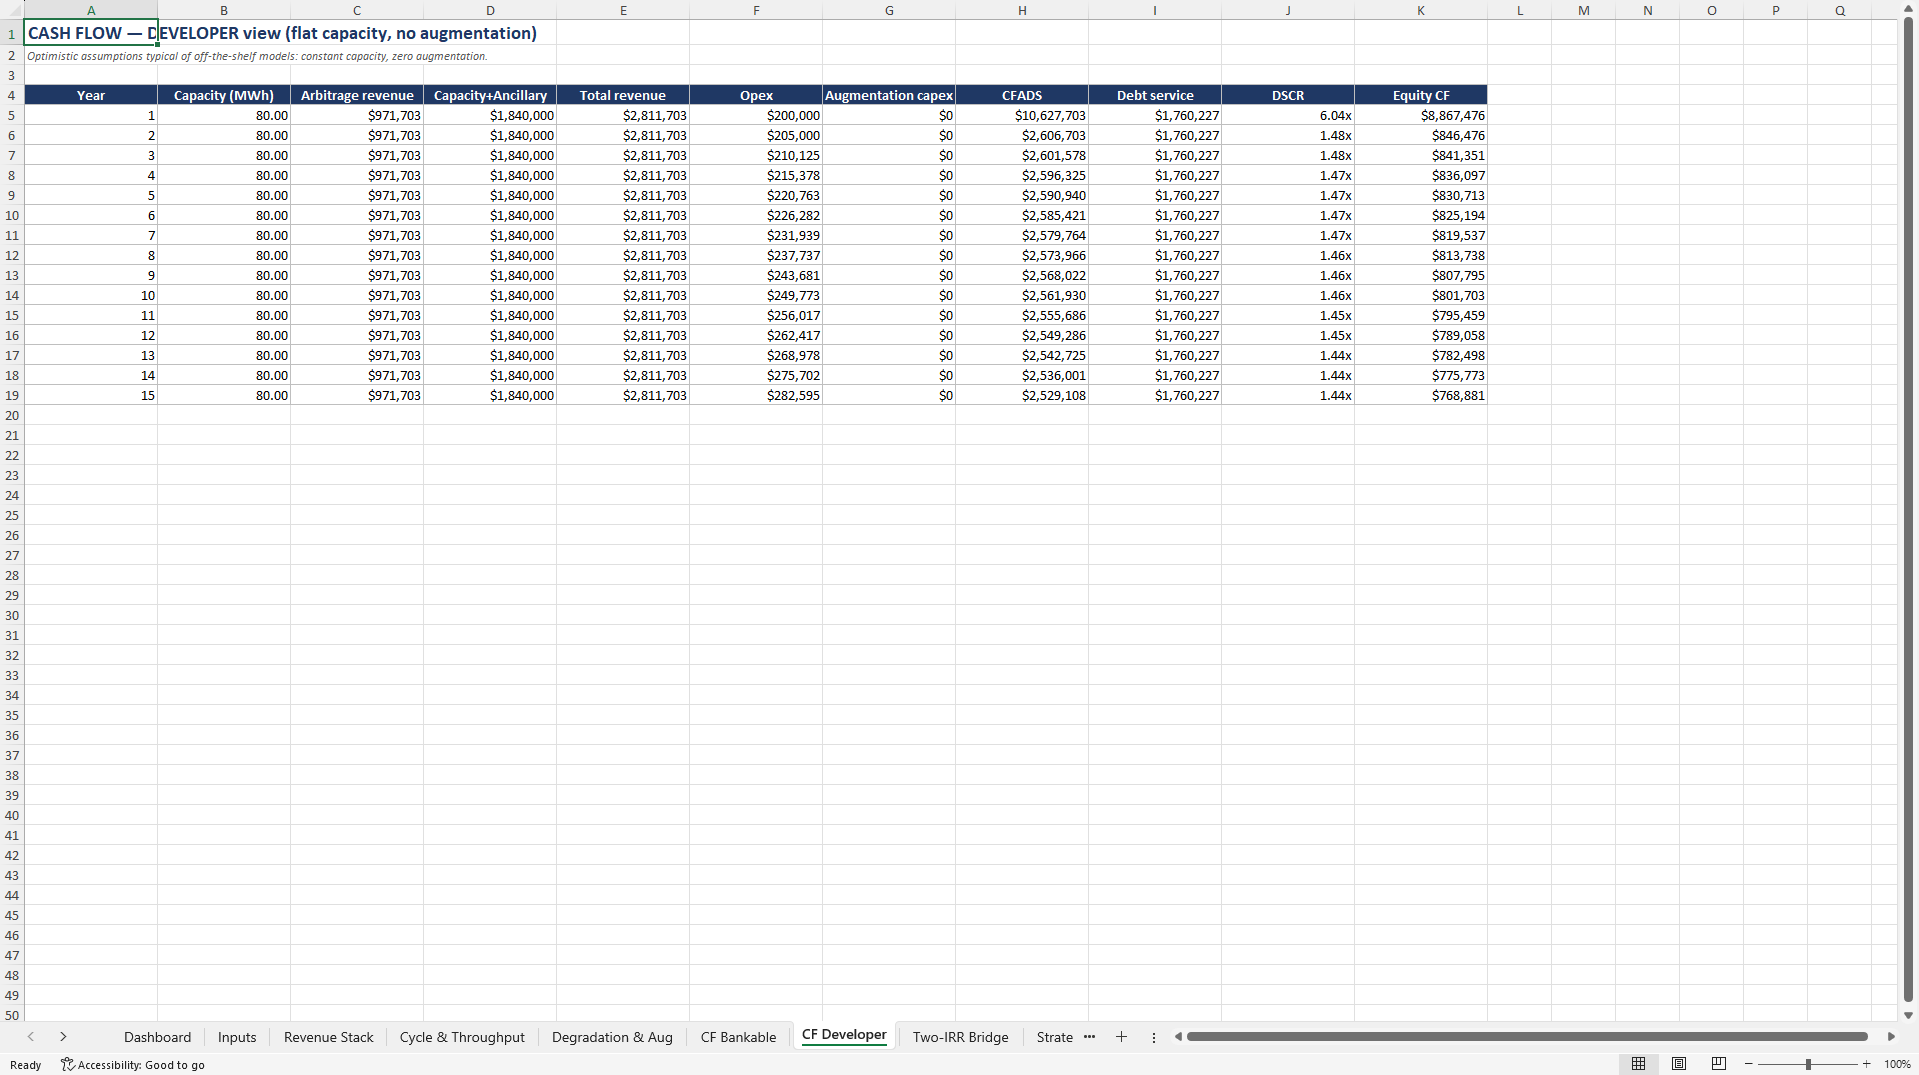
This model prints two internal rates of return on the same battery energy storage project and shows exactly what separates them. The developer view assumes flat capacity, unconstrained cycling and no augmentation, which is how most storage models on sale are built. The bankable view charges cycle-linked degradation, caps throughput at the supplier's warranty envelope, and schedules augmentation capex as a real event with a date. On the base-case 20 MW / 80 MWh four-hour system, that is a developer IRR of 19.4% against a bankable IRR of 7.9%.
The gap is proved rather than asserted. Set both degradation inputs to zero and the two IRRs become numerically identical; the quality suite checks precisely that condition, so the difference is wear and not a modelling artefact. Thirty-six automated checks run across three engines: structure, a full Excel recalculation on every strategy and stress case with zero error cells, and a Google Sheets compatibility scan. Four of those checks are logic proofs.
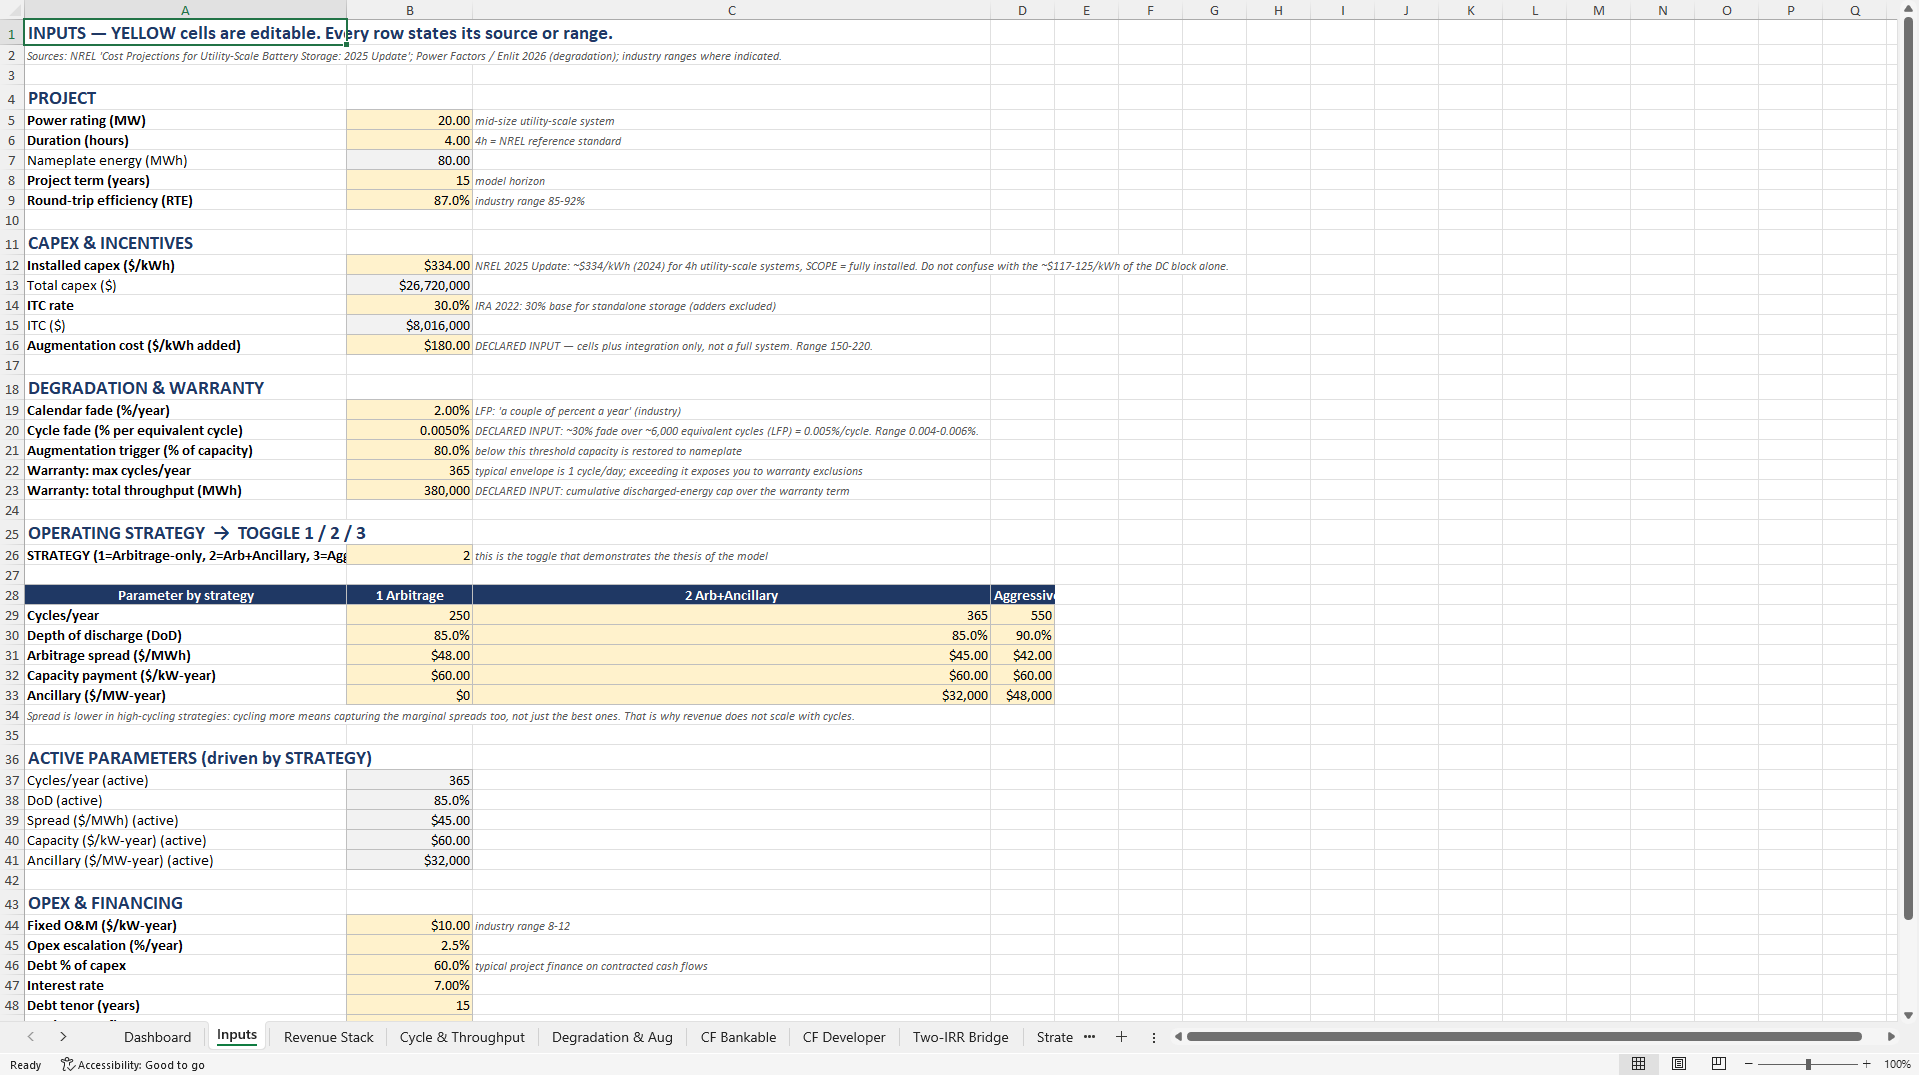
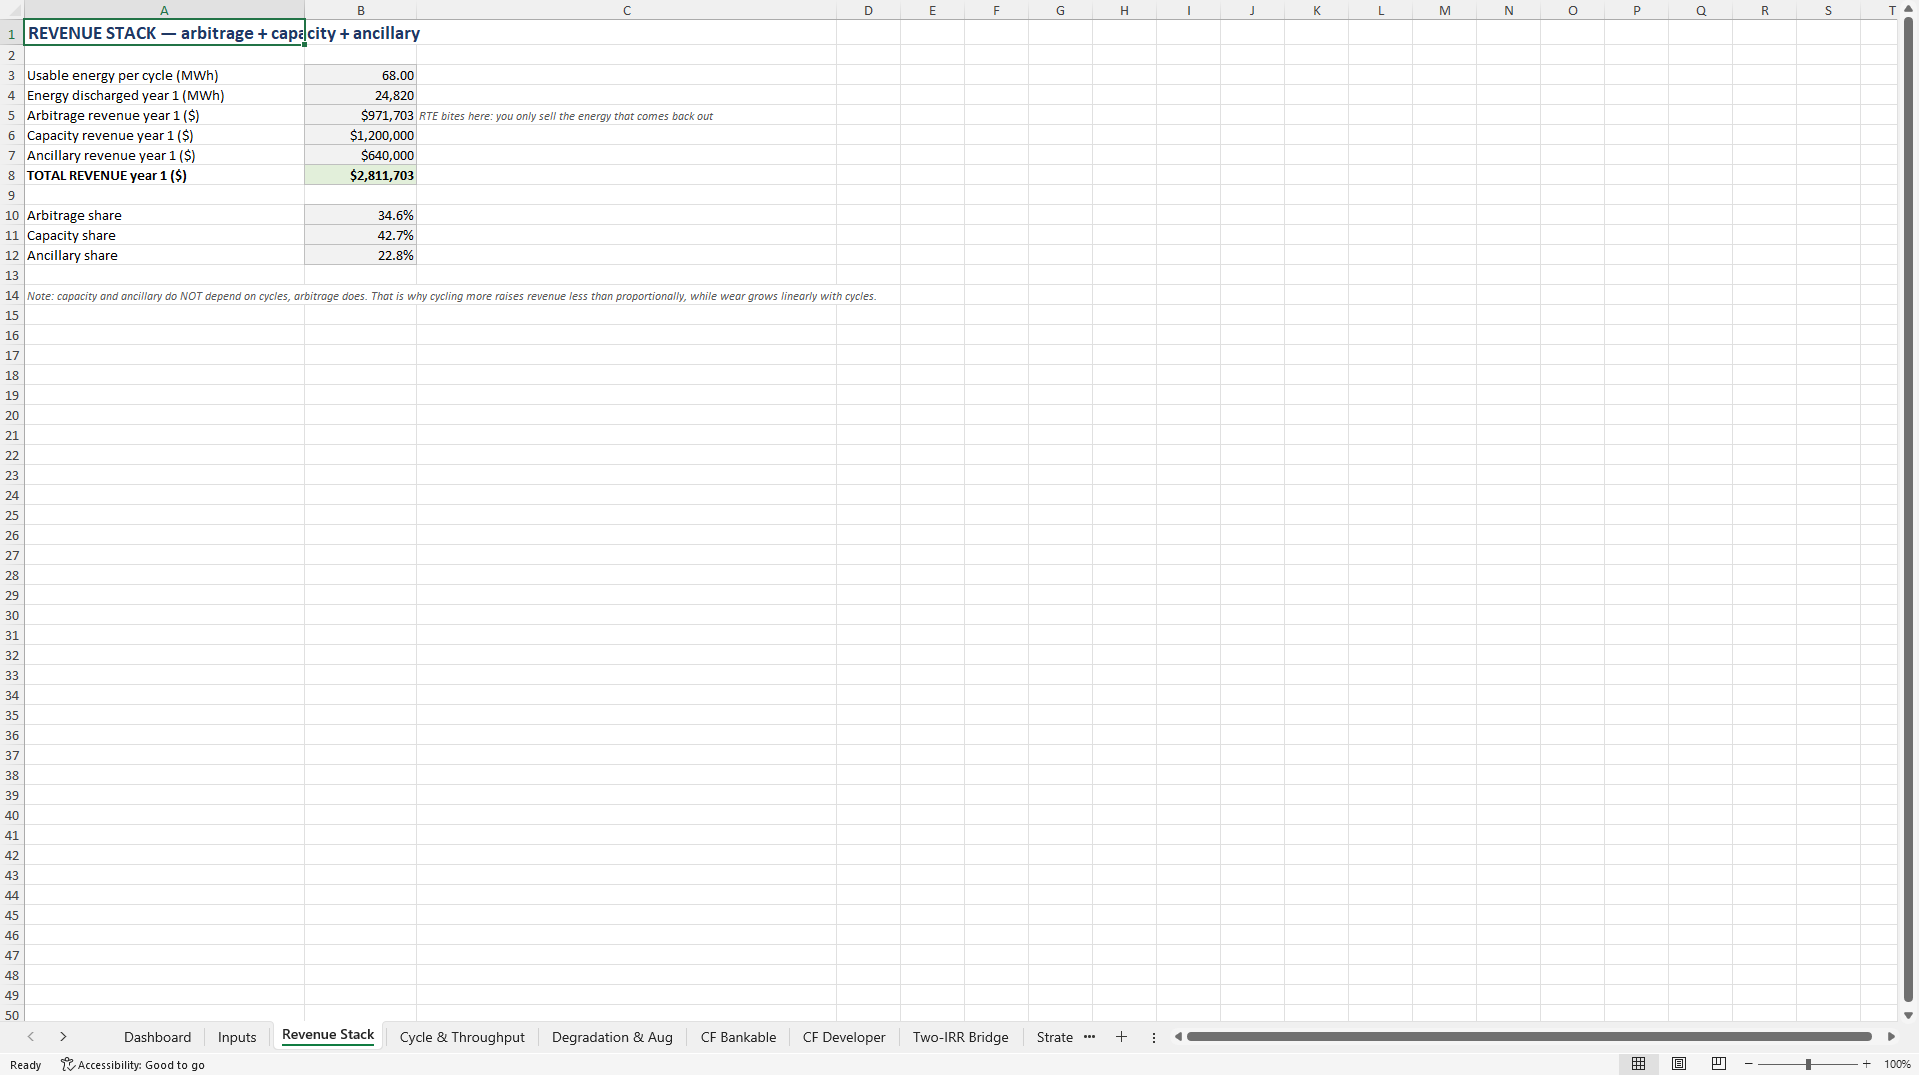
The base case uses installed capex of $26,720,000 drawn from NREL's Cost Projections for Utility-Scale Battery Storage: 2025 Update, equity of $10,688,000, Year-1 revenue of $2,811,703 from arbitrage, capacity payments and ancillary services, a minimum DSCR of 1.42x, augmentation of $5,956,934 with its first event in year 6, and capacity at term end of 89.1% of nameplate. The investment tax credit is taken at the 30% base rate for standalone storage under the Inflation Reduction Act 2022 and treated as a Year-1 inflow rather than a discount at closing.
A three-way strategy comparison carries the finding that changed the thesis. The model was built to show that cycling harder destroys the bankable return; it does not. Arbitrage only earns $1,909,920 of Year-1 revenue and does not recover equity. Arbitrage plus ancillary earns $2,811,703 and a 7.9% bankable IRR. Aggressive stacking earns $3,606,984 and the highest IRR at 25.4%, while exhausting guaranteed throughput in year 9.6 of a fifteen-year plan, running 5.4 years with no cover, and leaving $9,232,610 of cell replacement at your own risk, equal to 86% of the equity invested. That exposure is quantified in dollars on its own line and deliberately not smuggled into the IRR through an invented risk premium.
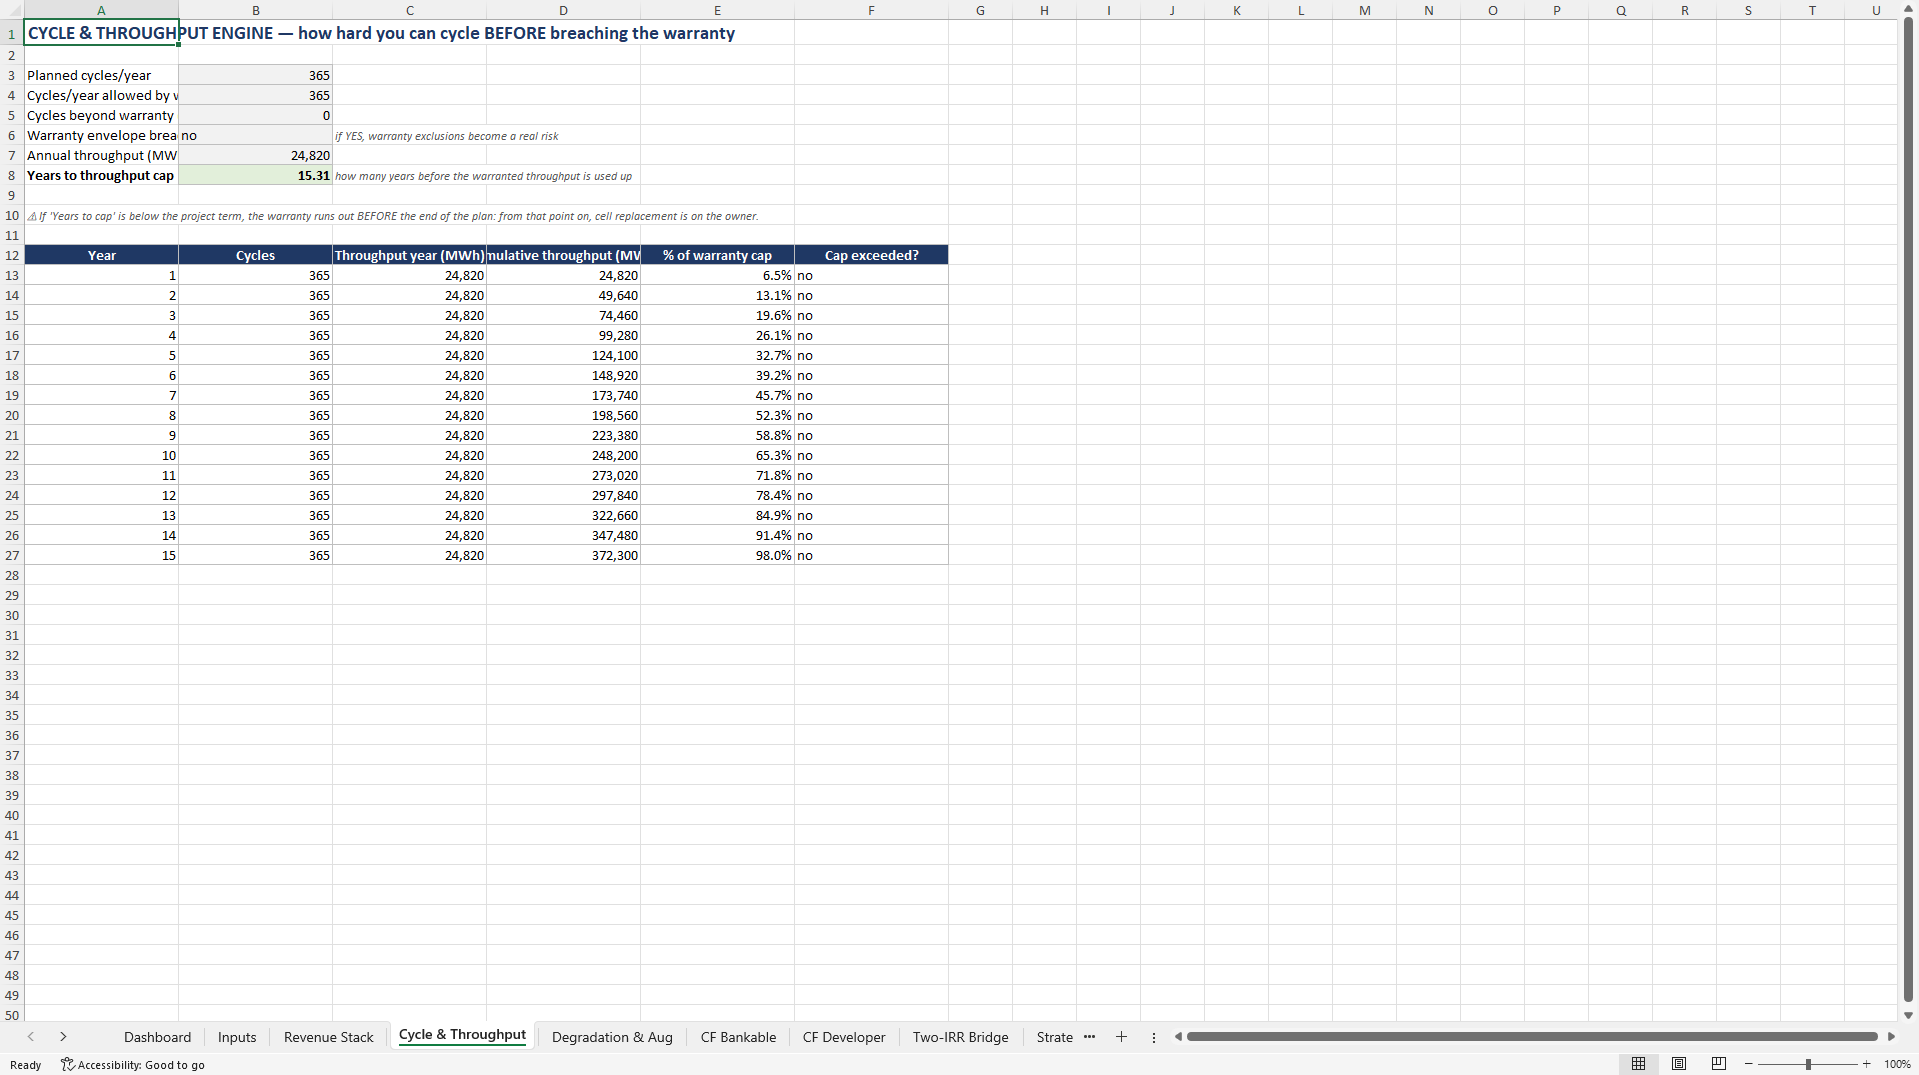
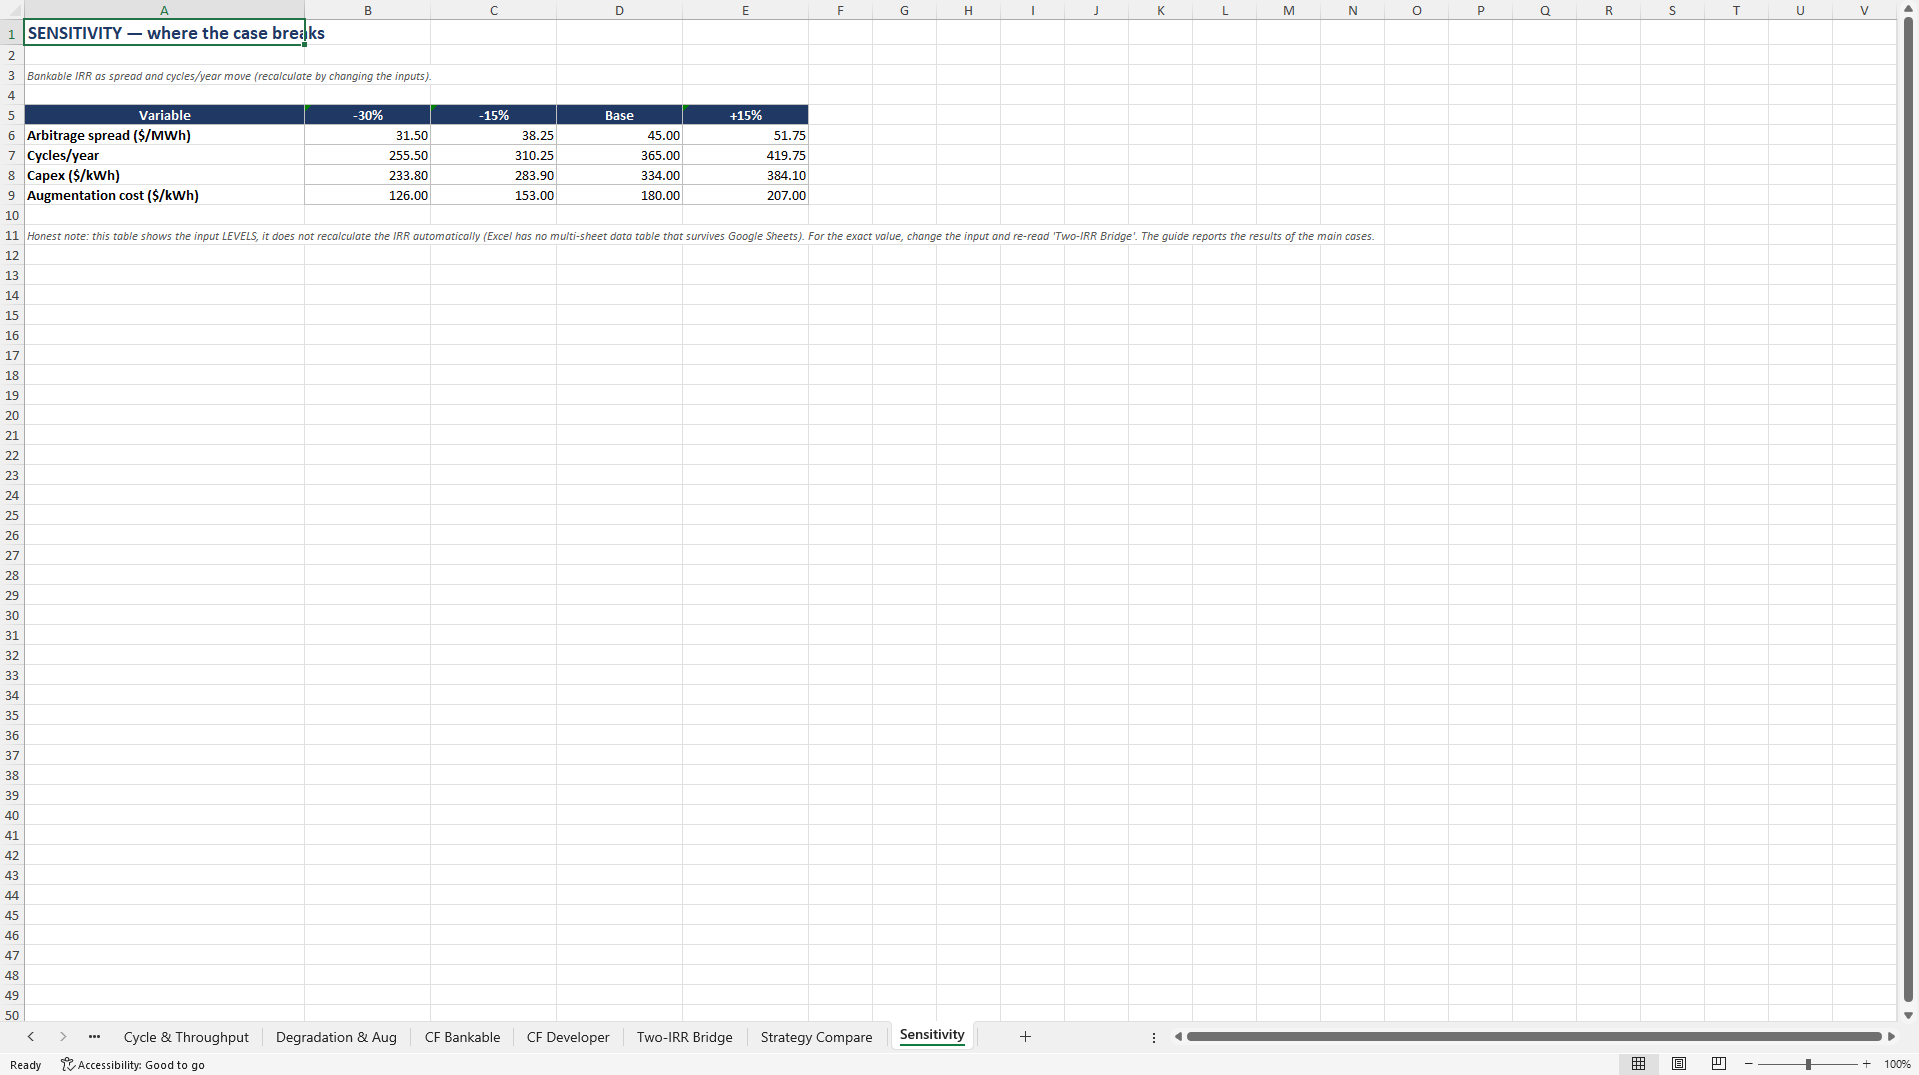
Ten sheets and roughly six hundred formulas cover the dashboard, inputs with every assumption sourced or declared with a band, the revenue stack across arbitrage, capacity payments and ancillary services, cycles and throughput measured against the warranty envelope, degradation and augmentation, two cash-flow views, the two-IRR bridge with the uncovered-exposure line, the three-way strategy comparison, and sensitivity. Yellow cells are inputs and everything else is formula-driven, in Excel and Google Sheets, with no macros, add-ins or external links.
The limits are stated on the page rather than buried. The model does not build tax-equity partnership flips, does not optimise dispatch over an 8760-hour price series, and does not forecast merchant prices, since you supply the spread. Inputs without a public source are marked as declared model inputs with a stated band. Educational and planning tool, not financial, tax or legal advice.
Got a question about the product? Email us at support@flevy.com or ask the author directly by using the "Ask the Author a Question" form. If you cannot view the preview above this document description, go here to view the large preview instead.
Source: Best Practices in Renewable Energy, Integrated Financial Model Excel: Battery Storage (BESS) Model: Two-IRR Degradation Bridge Excel (XLSX) Spreadsheet, ProformaWorks
ABOUT THE AUTHOR

ProformaWorks builds acquisition-grade financial models for Main Street and lower-middle-market businesses - the kind of deal financed with an SBA 7(a) loan or a small commercial facility.
Every model answers one question: does this deal pencil at the bank? That means SDE or NOI rebuilt from the seller's own numbers, the add-backs a lender will and will not accept, a debt-service
... [read more]
Ask the Author a Question
You must be logged in to contact the author.




























