 Click main image to view in full screen.
Battery Energy Storage Financial Model for C&I Peak Shaving – Excel XLSX
Excel (XLSX)


BENEFITS OF THIS DOWNLOADABLE EXCEL DOCUMENT
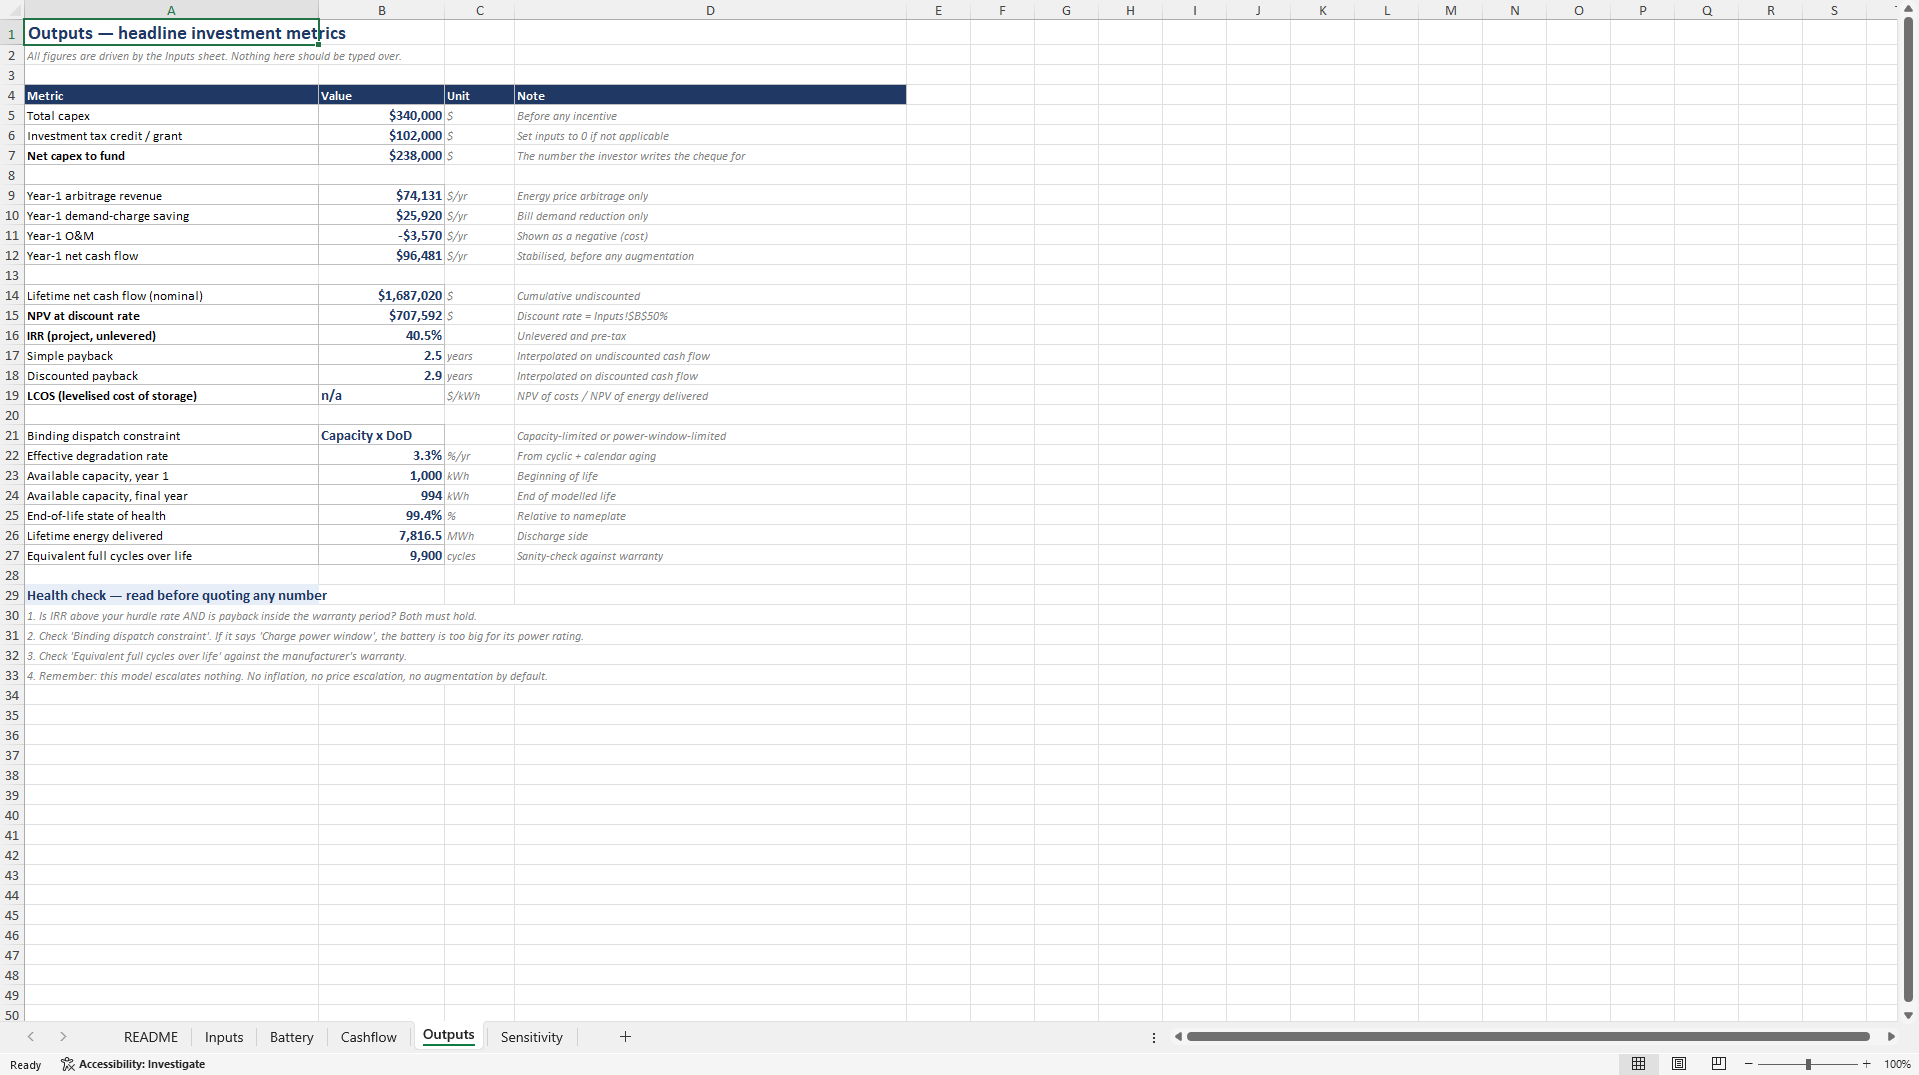
- Produces credit-committee-ready outputs -- NPV, IRR, payback, discounted payback, and LCOS -- from a single Inputs sheet.
- Derives battery degradation from operating conditions instead of a fixed annual percentage, so long-horizon cash flows are not overstated.
- Benchmarked against a published C&I peak-shaving case, with payback within 2% of the published figure.
ENERGY INDUSTRY EXCEL DESCRIPTION
Overview
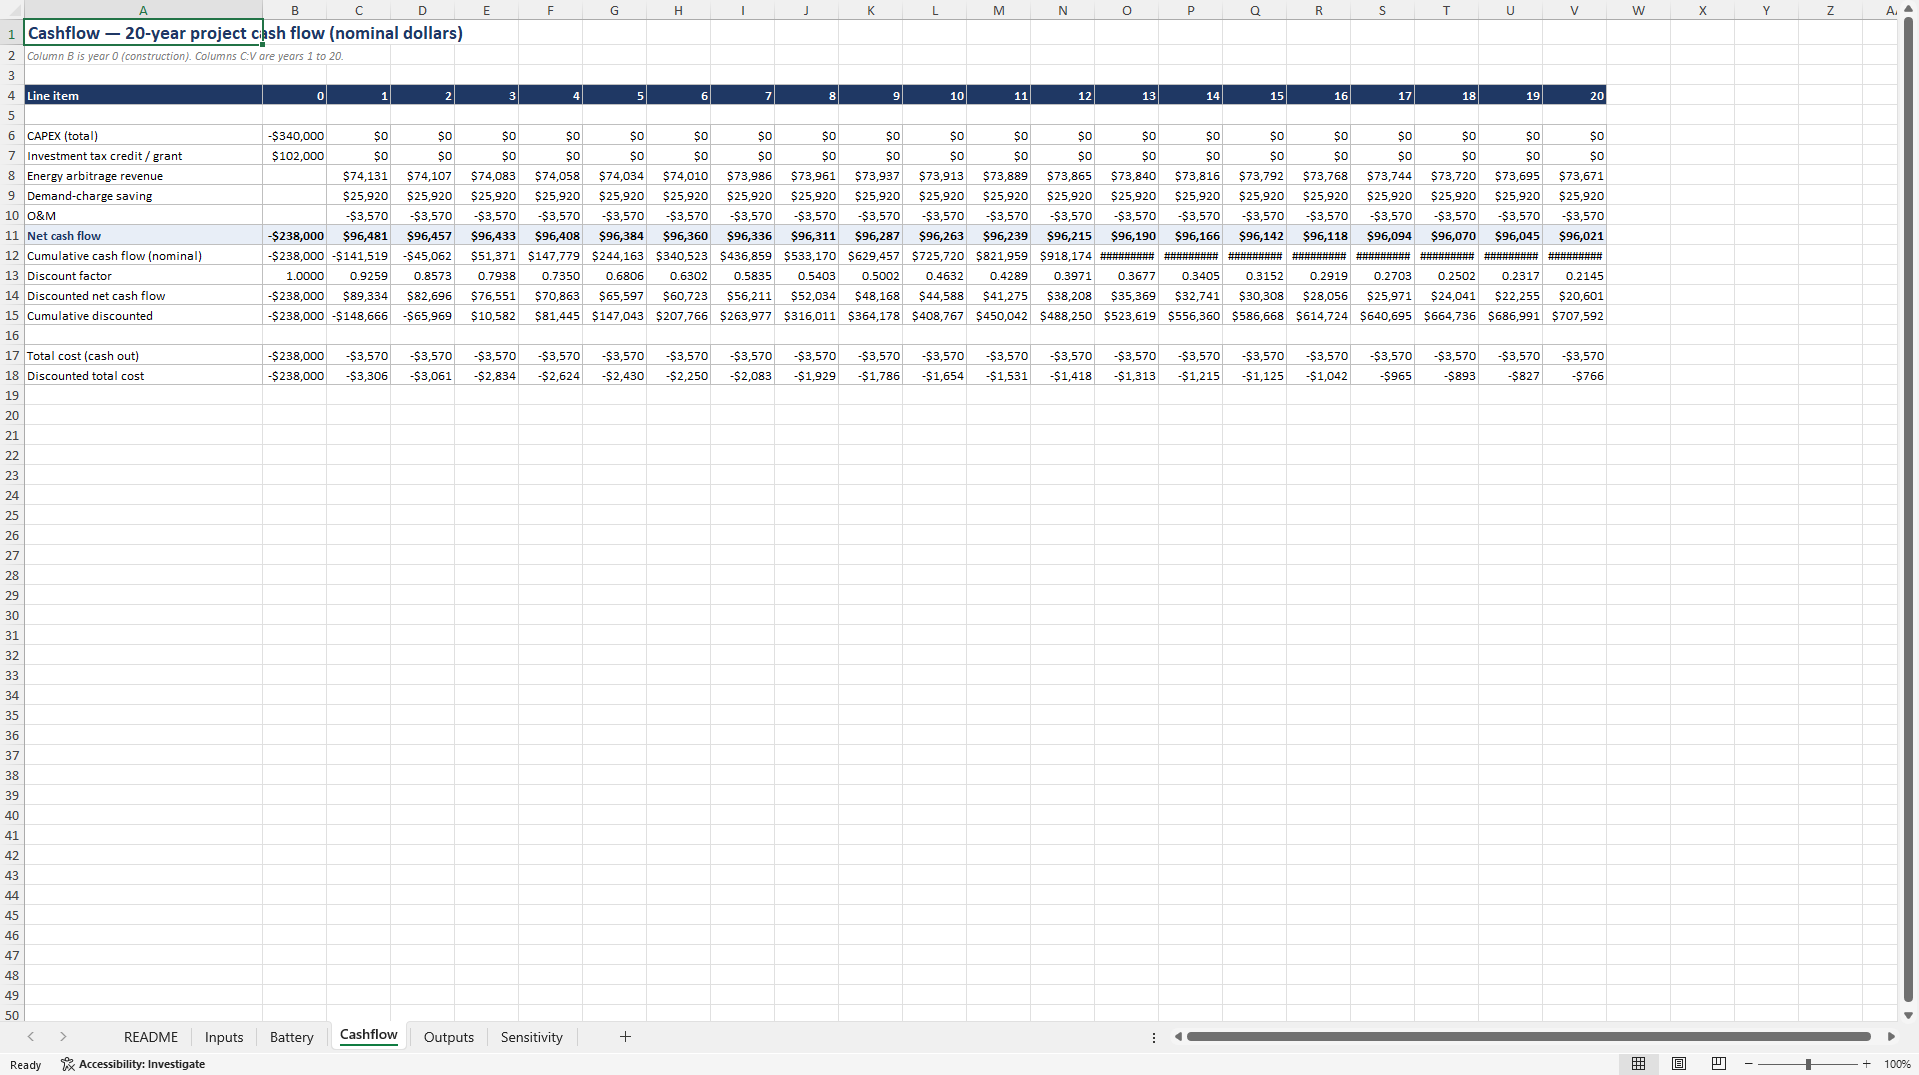
This is a project-finance model for behind-the-meter commercial and industrial (C&I) battery energy storage systems (BESS). It evaluates two revenue streams – peak-demand-charge reduction and time-of-use (TOU) energy arbitrage – and returns the metrics a credit committee or investment memo requires: NPV, IRR, payback period, discounted payback, and levelised cost of storage (LCOS).
Who this is for
• Project developers and EPCs screening C&I storage opportunities
• Financial analysts underwriting behind-the-meter storage
• Energy consultants building investment memos for industrial clients
• Asset owners evaluating a proposed system before committing capital
What makes it different
Most storage financial models available today treat battery degradation as a fixed annual percentage. That assumption is where the numbers break down, because degradation depends on how the battery is actually operated.
This model derives degradation from operating conditions instead:
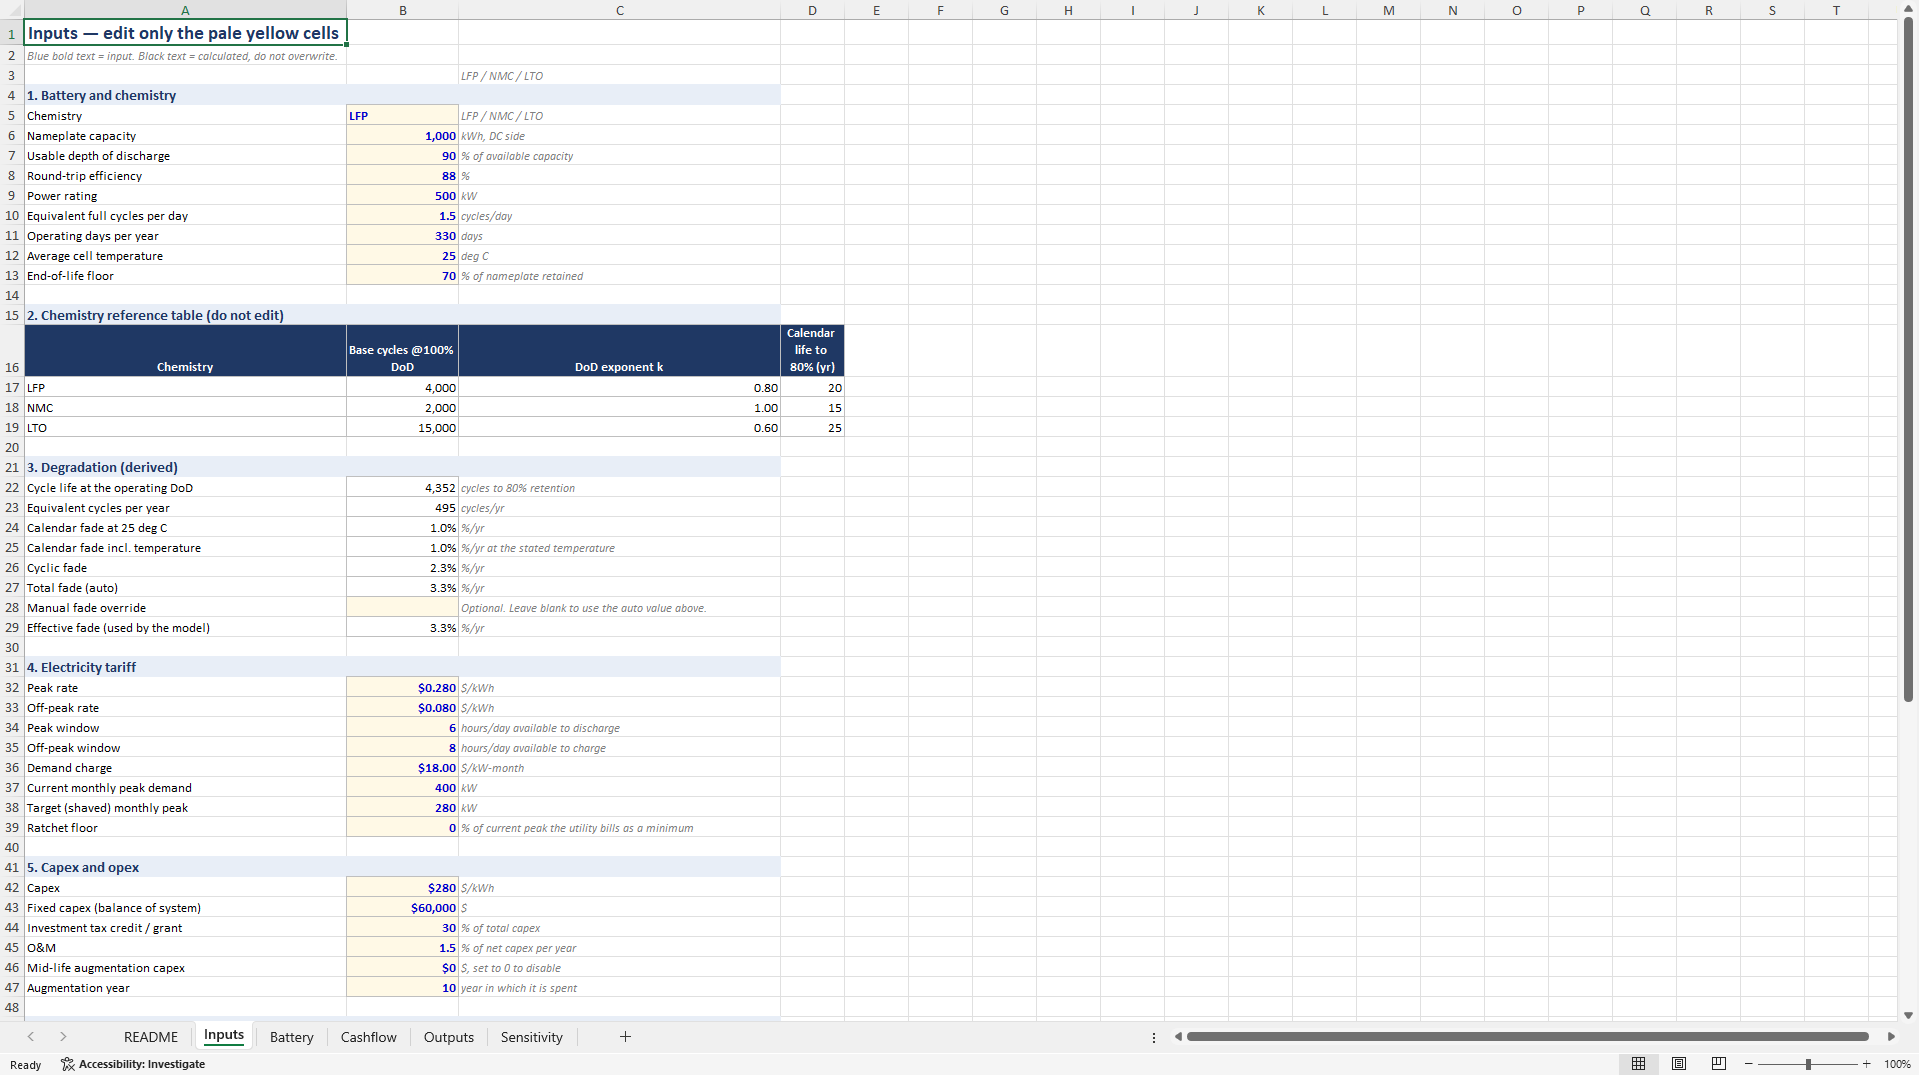
• Cycle life as a power-law function of depth of discharge (DoD): cycles_at_DoD = base_cycles x (100 / DoD)^k, with chemistry-specific exponents (LFP k = 0.80, NMC k = 1.00, LTO k = 0.60)
• Arrhenius calendar ageing, which doubles fade for every 10 deg C rise in cell temperature
• An end-of-life floor that stops the capacity decline at a defined state of health
It also enforces the physical constraints most simple calculators omit:
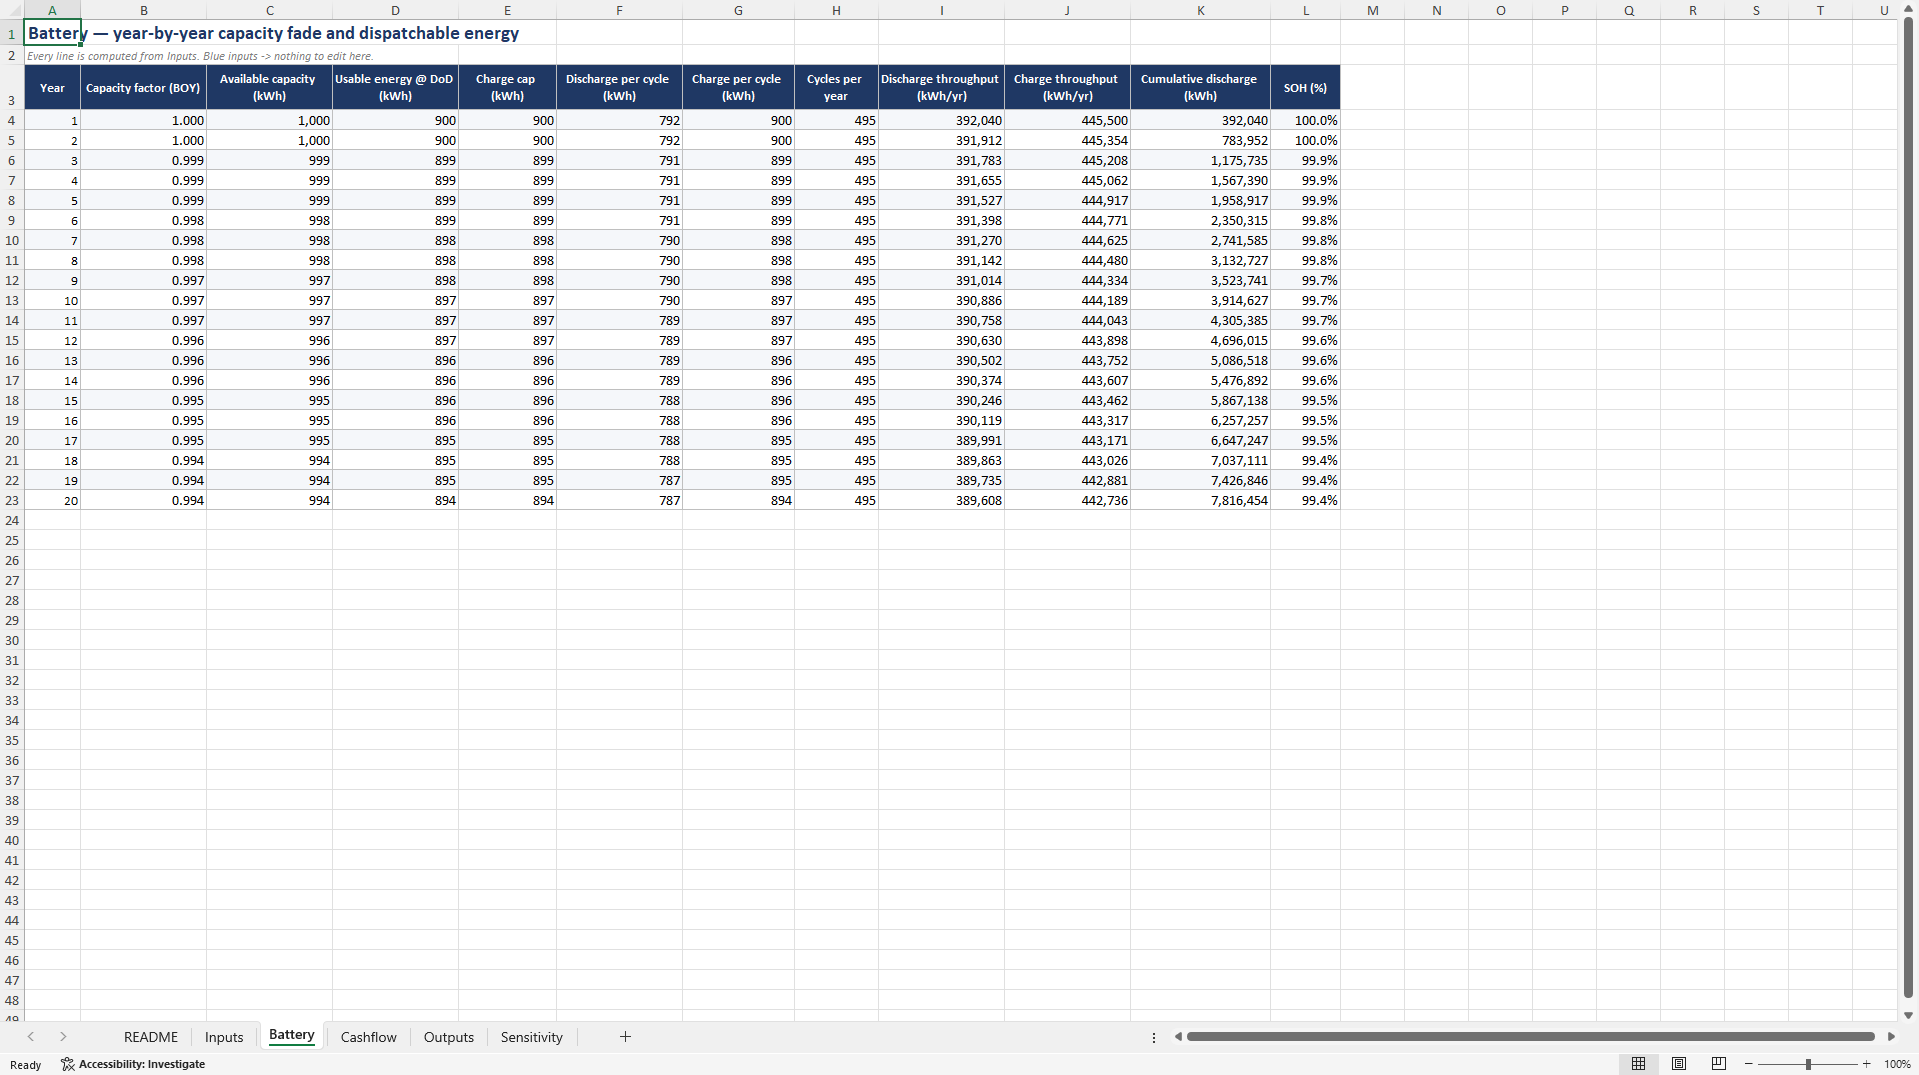
• Dispatch is limited by both energy (capacity x DoD) and power (power rating x window hours), and the model reports which constraint binds
• Round-trip efficiency is applied to the charge side, not subtracted crudely from the tariff spread
• Demand-charge savings respect a ratchet clause, where one exists
• Degradation is applied year by year, so later-year cash flows are not overstated
What is included
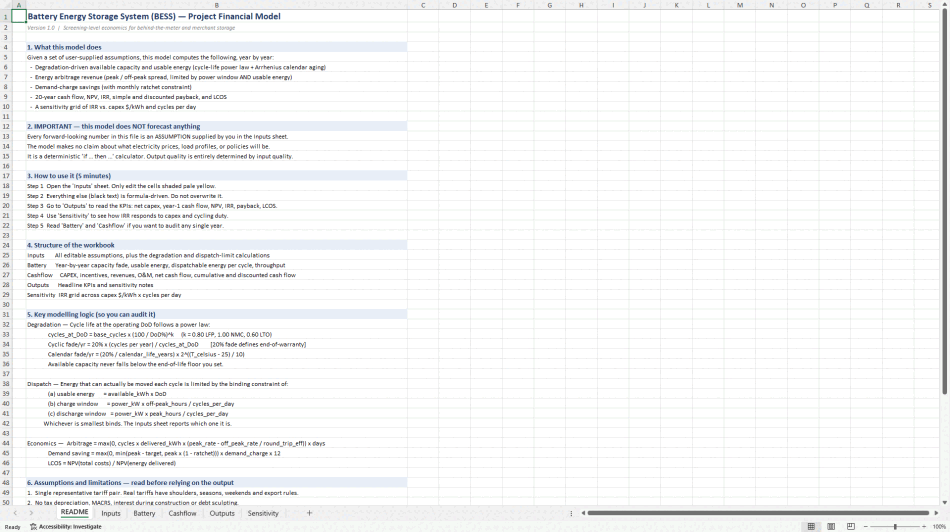
Six worksheets, all live Excel formulas – no hard-coded results:
• README – model logic and assumptions, written for the buyer
• Inputs – all assumptions in one place; the pale yellow cells are the only edits required
• Battery – year-by-year capacity, available energy, and dispatch limits
• Cashflow – 20-year annual cash flow, nominal and discounted
• Outputs – headline metrics and a pre-quote health check
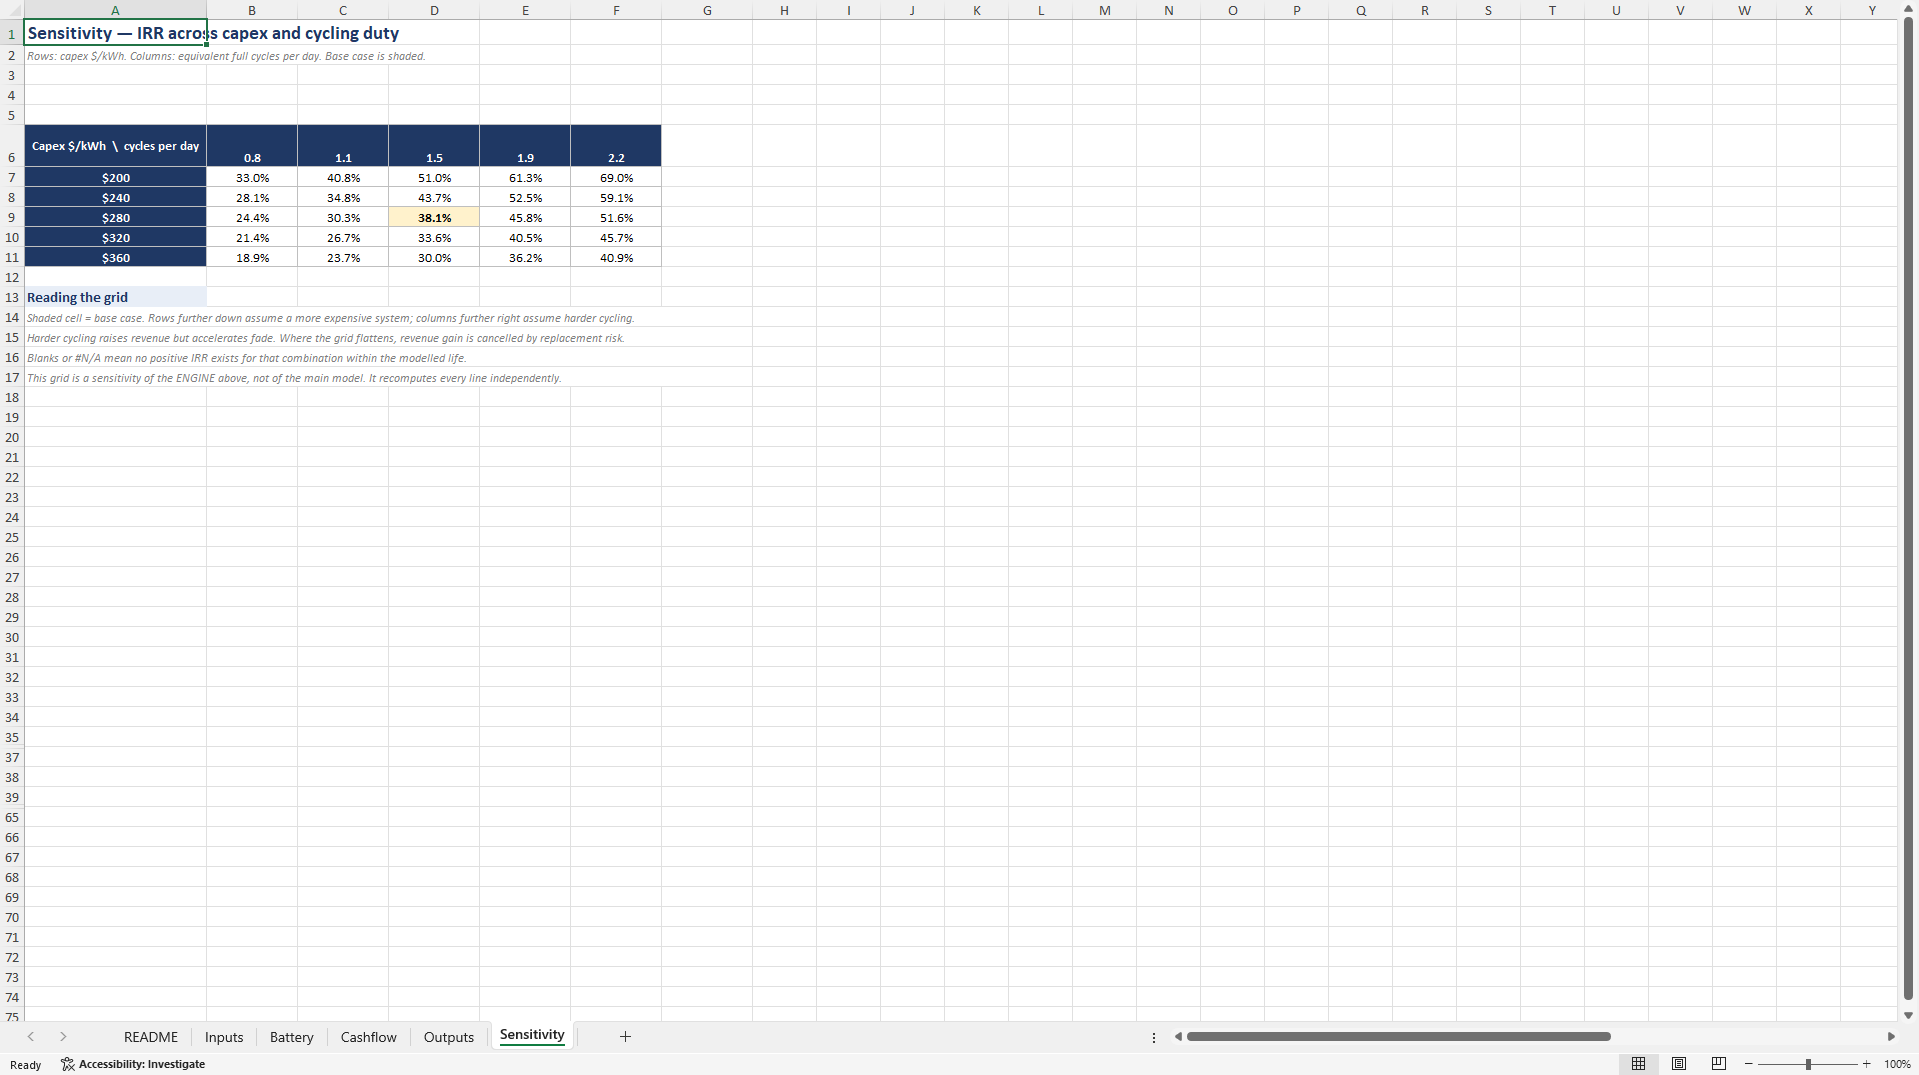
• Sensitivity – tornado and two-way sensitivity on rate, capex, and degradation
Validation
The model has been benchmarked against a published C&I peak-shaving case study. For a 250 kW / 522 kWh system with a 480 kW to 300 kW peak reduction at a $20/kW-month demand charge, the model returns a payback of 3.16 years against the published figure of 3.10 years – a deviation of 2%. Annual demand-charge savings match exactly. See the README sheet for the full comparison.
What this model does not do
It is a screening and underwriting tool, not an investment recommendation. It escalates no prices and models no battery augmentation schedule by default. It does not model wholesale market revenue, ancillary services, or tax depreciation. All inputs must be replaced with project-specific data before any figure is used for a real decision.
Requirements
Microsoft Excel 2016 or later, or WPS Office. No macros, no add-ins, no external data connections.
Got a question about the product? Email us at support@flevy.com or ask the author directly by using the "Ask the Author a Question" form. If you cannot view the preview above this document description, go here to view the large preview instead.
Source: Best Practices in Energy Industry, Integrated Financial Model Excel: Battery Energy Storage Financial Model for C&I Peak Shaving Excel (XLSX) Spreadsheet, Shawn -- Energy Storage Engineer