

Barber Shop Financial Model – Excel XLSX
Excel (XLSX)
BENEFITS OF THIS DOWNLOADABLE EXCEL DOCUMENT
- Facilitates accurate financial forecasting and performance evaluation for barber shops, aiding in effective budgeting and strategic decision-making.
- Provides a robust tool with specialized tabs for data input, comprehensive calculations, and visual displays of key financial metrics, simplifying financial analysis.
- Captures various income sources from grooming services and product sales, enhancing business growth and financial stability.
INTEGRATED FINANCIAL MODEL EXCEL DESCRIPTION
Summary:
The Barber Shop financial model is a comprehensive and versatile tool designed to analyze and forecast the financial performance of a barber shop. This model accommodates a range of services including haircuts, beard trims, shaves, hair styling, and grooming services for men, such as hair treatments, facials, and scalp massages, along with revenue from retail product sales.
The model features several tabs, including:
• Inputs: For data entry and assumptions.
• Outputs: For presenting key results.
• Financial Statements: For integrated income statement, balance sheet, and cash flow statement.
• Calculations: For granular financial line-item breakdowns.
• Graphs: For visually insightful representations of KPIs, revenue, profitability, expense composition, cash flows, and balance sheet items.
Detailed Description:
This comprehensive financial model has been meticulously designed to provide a strategic roadmap for your barber shop business, which is also known by other names such as Barber Salon, Men's Salon, Hair Salon, Barber Lounge, Barber Studio, Shaving Parlor, Men's Grooming Studio, Traditional Barber Shop etc.
With a horizon extending over five years, the model encapsulates monthly projections that aggregate into annual forecasts. The revenue streams include revenue from different services and retail sales of products
Designed to cater to diverse financial needs, the model proves to be an invaluable tool for investor presentations, internal analysis, loan applications, and other financial deliberations. The model's intuitive design is complemented by detailed guidance provided within the 'Instructions & Description' tabs, facilitating seamless navigation and input entry across its various tabs.
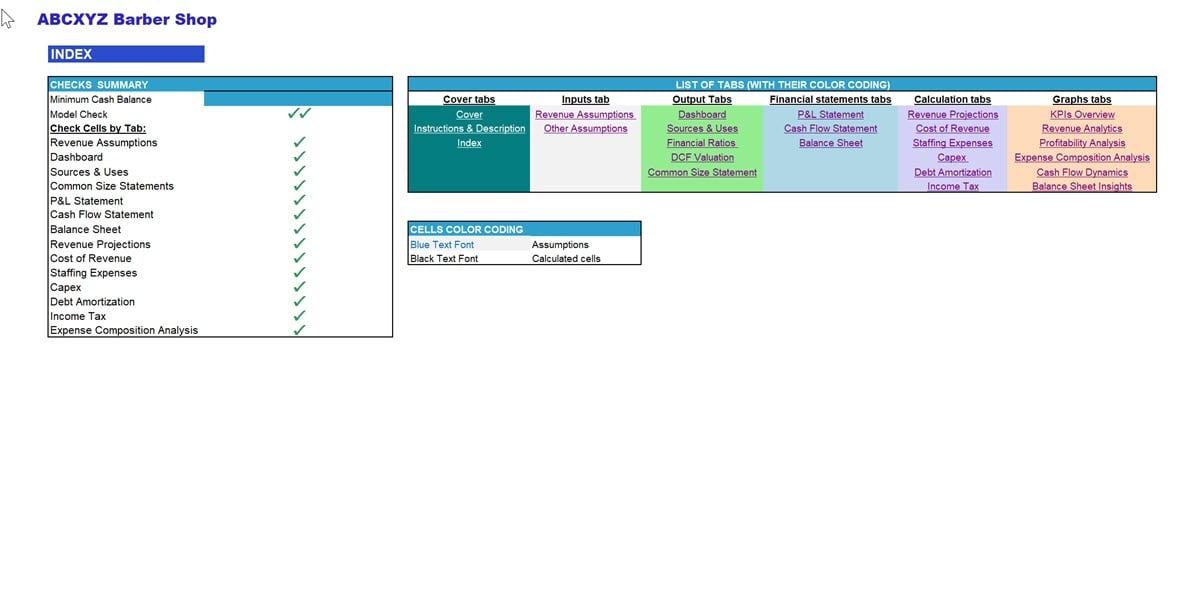
Rows for 'check cells' have been incorporated at the end of each tab to flag potential inconsistencies or errors within the model. These checks include ensuring numbers fall within an expected range, monthly figures sum up to the corresponding annual totals, beginning/end-of-year balances match the first/last month's figures, and figures correspond between two different tabs. When an inconsistency or error is detected, the corresponding check cell will display a '1'; otherwise, it will show '0'. Column A in each tab is designated for validation checks, showing the total of all check cells in that row. A green tick mark (✔) indicates no discrepancies, while a red cross (✖) alerts to an error. The aggregated result of all check rows in Column A is displayed in cell A4 of the tab. The Index tab consolidates check cells from all sheets, providing a quick overview and aiding in easy identification of discrepancies on any sheet. If the overall model check is satisfactory, cell A3 on each tab will display a double green tick mark (✔✔); otherwise, it will show a double red cross (✖✖)."
The financial model is organized into 25 different tabs, categorized into 6 sections: Cover Tabs, Input Tabs, Output Tabs, Financial Statements Tabs, Calculation Tabs, and the Graphs Tabs. This structure offers a panoramic view of the business's financial landscape:
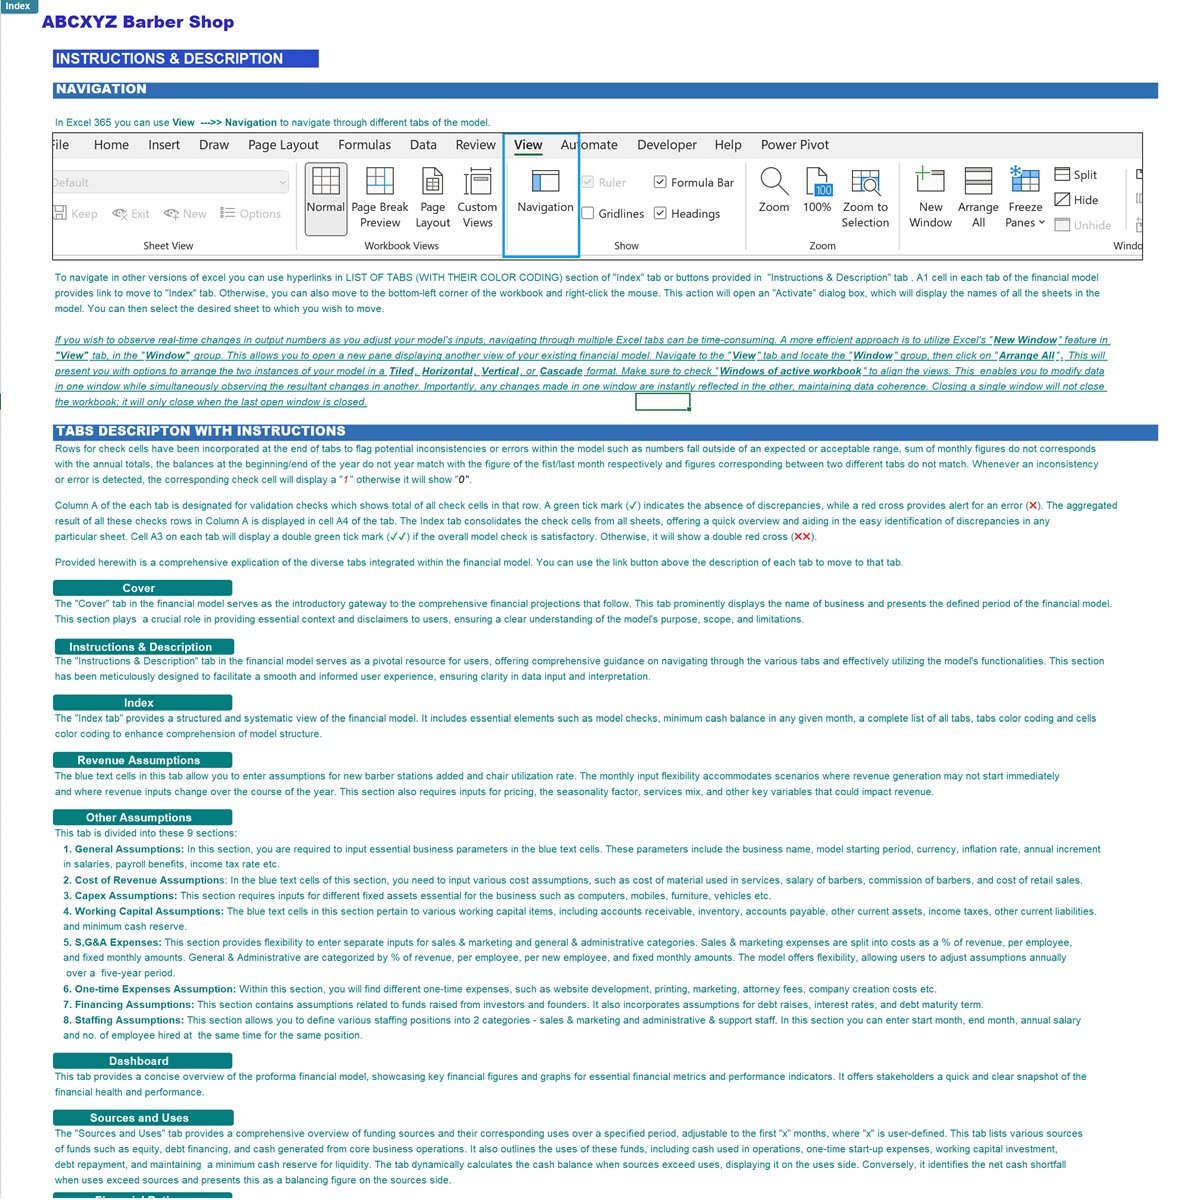
1. Cover Tabs: The cover tabs provide:
Crucial instructions
Description of all the tabs in the model
Color coding conventions
Navigation guidance
Essential checkpoints
2. Inputs Tabs: The input tabs in the financial model enable customization and alignment with your business's unique characteristics and operational strategies. Below is a breakdown of the key functionalities within this section:
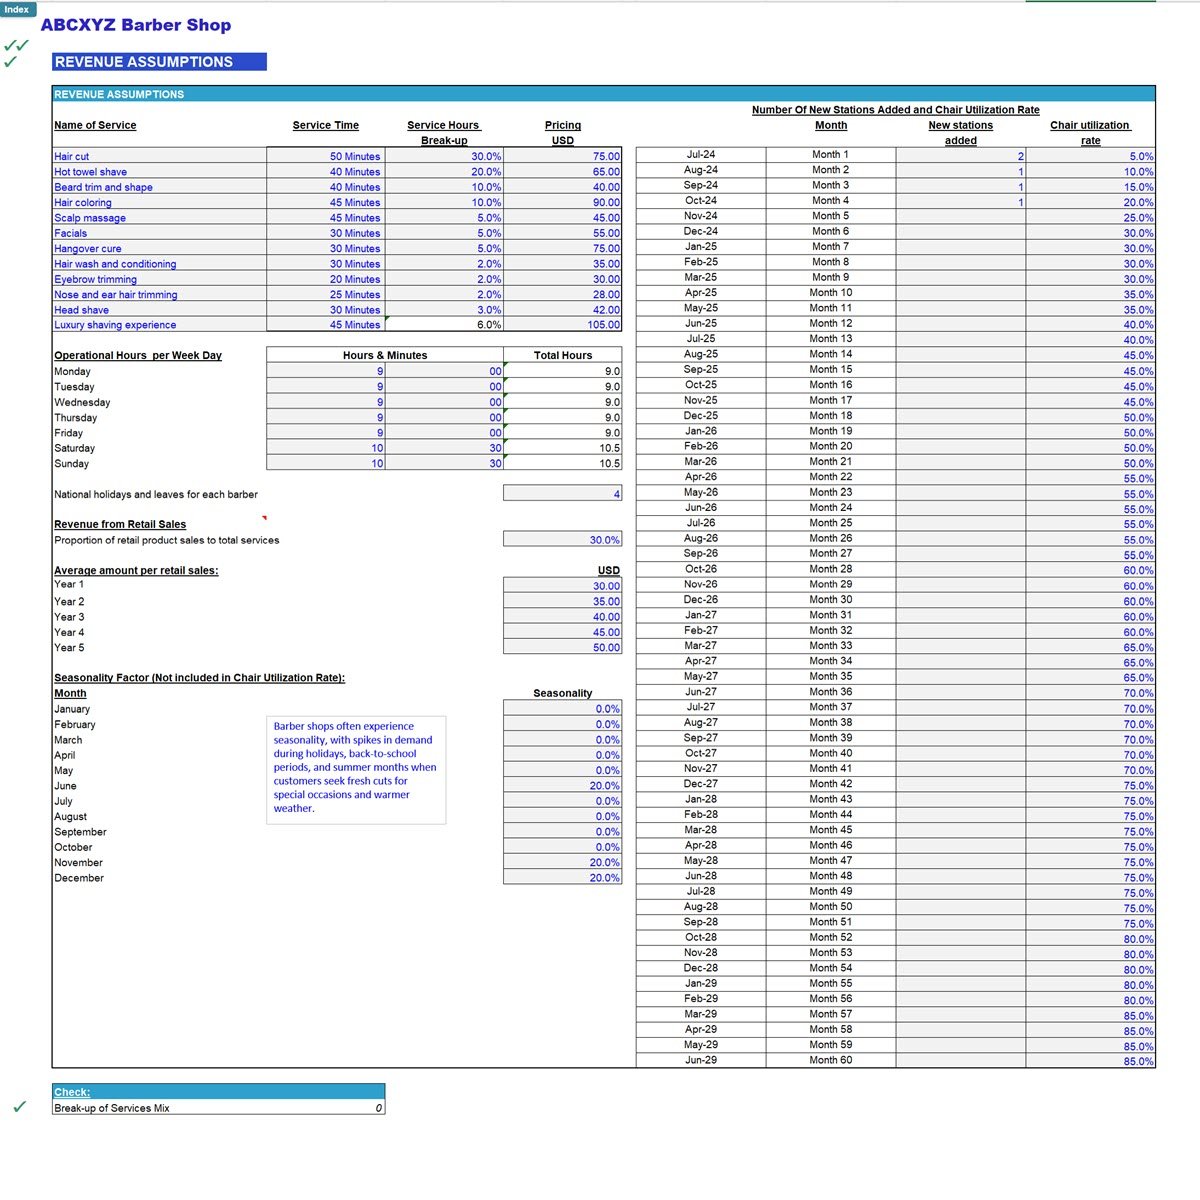
Revenue Assumptions: This sub-section comprehensively covers key revenue-driving variables for the following revenue streams:
• Revenue from different services such as hair cut, shave, hair coloring, facials etc.
• Retail sales of products
These variables include pricing strategy, product/service mix, volume, growth, chair utilization rate, seasonality, etc.
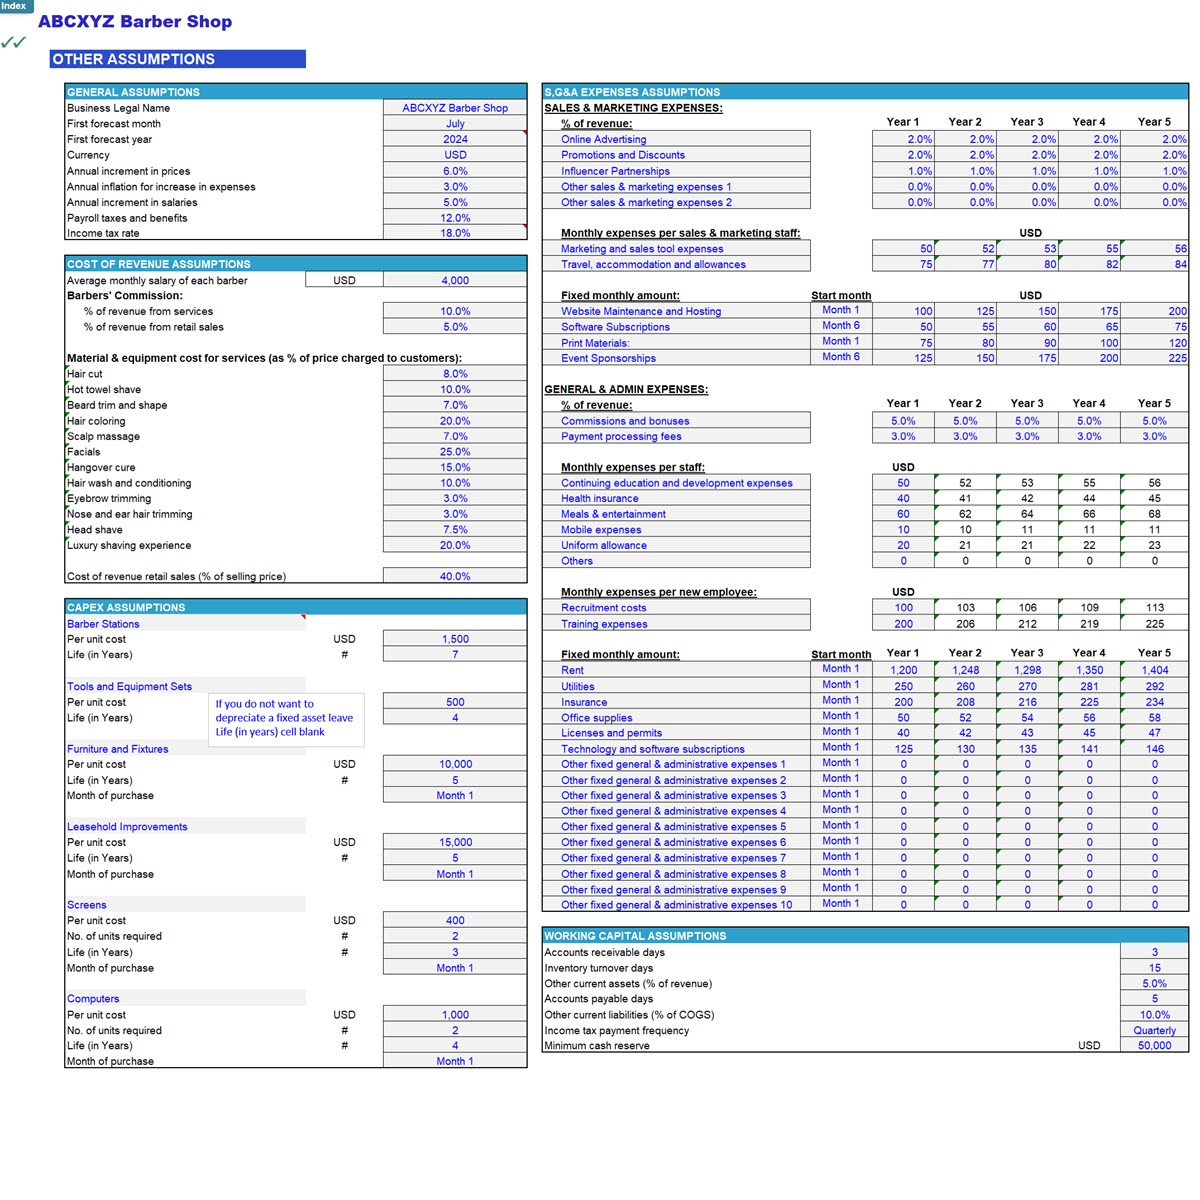
General Assumptions: This sub-section gathers essential foundational parameters for your business which include:
• Name of your business
• Start month and year of financial projections
• Currency
• Inflation rate
• Payroll taxes and benefits
• Income tax rate etc.
Cost of Revenue Assumptions: These inputs provide insights into the core operating costs like:
• Material costs of shampoos, hair gel, conditioners, hair sprays etc.
• Salaries, payroll taxes and benefits of barbers
• Cost of retail sales
S, G&A Expenses: This section accounts for inputs related to selling, general, and administrative expenses, including office rent, advertising, software & computer costs, travel, telephone and internet, meals, insurance, utilities, website maintenance etc.
Sales & marketing expenses are split into:
• Expenses as a % of revenue
• Expenses per employee
• Fixed monthly amounts
General & Administrative expenses are categorized by:
• % of revenue
• Expenses per employee
• Expenses per new employee
• Fixed monthly amounts
The model offers flexibility, allowing users to adjust assumptions annually over a five-year period to accommodate different forecasting scenarios. A standout feature is the ability to select a start month for each expense, enabling accurate reflection of when each cost item will begin in the financial projections.
Capex: The CapEx (capital expenditure) input section of the financial model serves as a critical component for strategic financial planning and asset management. It requires the following inputs:
• Diverse types of assets
• Cost per unit for each type of asset
• Useful life of each asset
The business needs capital expenditure on barber stations, tools and equipment sets, furniture and fixture, leasehold improvements, computers, screens etc.
Working Capital Assumptions: The Working Capital Assumptions input section of the financial model is a pivotal component for managing the short-term financial health of your business. It provides a structured framework to input essential parameters, which include:
• Accounts receivable days (the time it takes to collect payments from customers)
• Accounts payable days (the time to pay your suppliers)
• Inventory turnover days (holding days of inventory)
• Allocation of revenue to other current assets
• Allocation of COGS to other current liabilities
• Income tax payment frequency
These assumptions play a fundamental role in optimizing cash flow, liquidity, and operational efficiency.
Financing Assumptions: This sub-section allows you to input key assumptions concerning the timing and magnitude of fundraising activities from founders, investors, and debt sources. Here, you can specify when and how much capital will be raised from these critical sources. Additionally, this tab accommodates essential debt-related assumptions, encompassing loan terms and interest rates, which are instrumental in managing your company's financial obligations and optimizing its capital structure.
One-time Expenses Assumptions: This sub-section helps in quantifying essential initial costs, including but not limited to initial marketing expenses, legal fees, registration charges, attorney fees, and staff training costs. These assumptions are pivotal for estimating the financing required to kickstart operations.
Staffing Assumptions: This section allows you to define various staffing positions categorized into sales & marketing and administrative and support staff. The following inputs are required for different staffing positions:
• Salary
• Start month
• End month
• Annual salary
• No. of employees hired in the same month for the same position
3. Output Tabs: The output section of the financial model is the culmination of rigorous financial analysis, offering a comprehensive and visually intuitive snapshot of your business's financial health and performance. These tabs include:
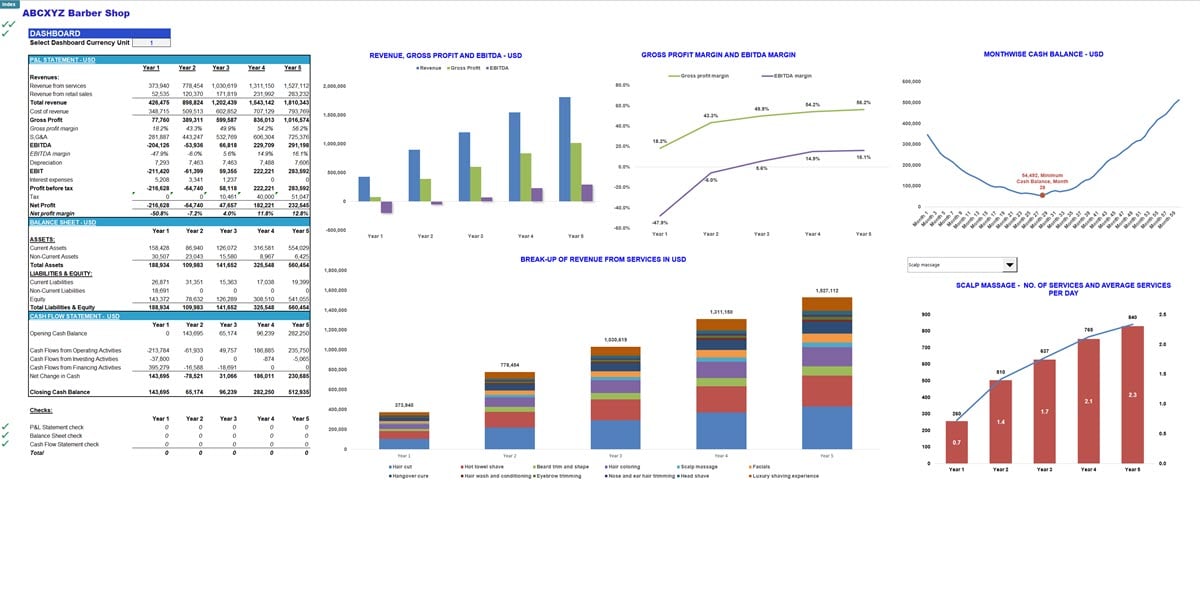
• Dashboard: The tab provides a concise yet insightful overview of essential financial statements, key performance indicators (KPIs), vital financial metrics, and significant profitability financial ratios.
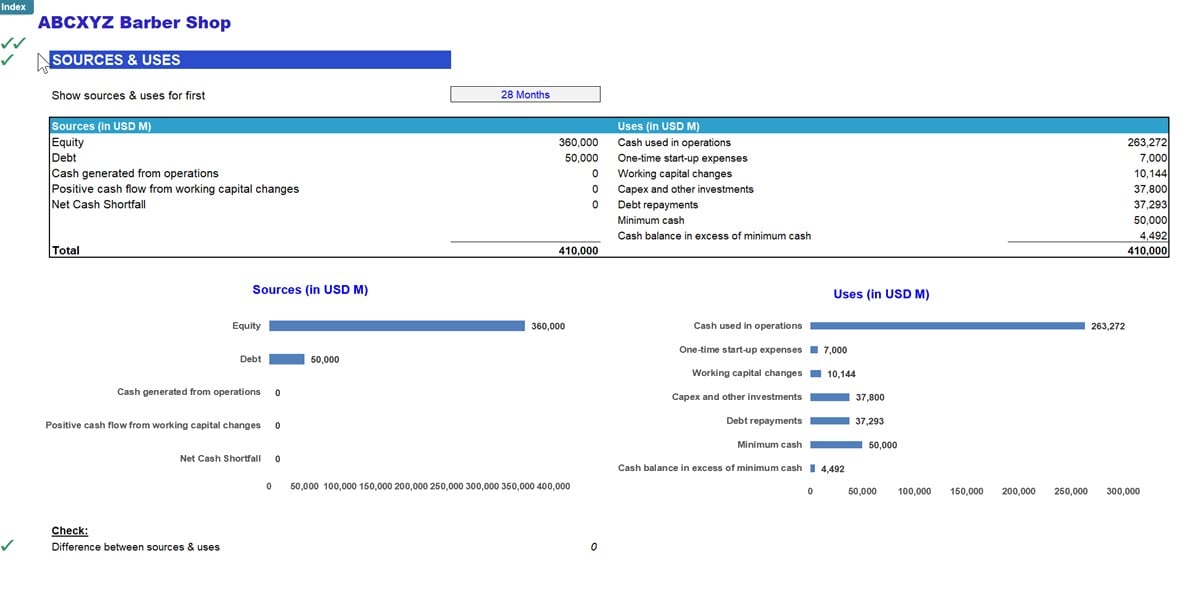
• Sources & Uses: The "Sources and Uses" tab provides a comprehensive overview of funding sources and their corresponding uses over a specified period, adjustable to the first "x" months, where "x" is user-defined.
• Financial ratios: It offers a deep dive into various financial indicators, facilitating a nuanced understanding of your company's financial stability and risk exposure.
• DCF valuation: It enables you to assess your business's intrinsic value based on unlevered cash flows and terminal value.
• Common size statement: This tab displays all line items of the profit and loss statement as percentages of total revenue. A key feature of this tab is the ability for users to set a threshold level for expense items based on the ratio of the expense item to total revenue. When this ratio exceeds the threshold, the common size profit and loss statement will automatically highlight the expense item.
4. Financial Statements Tab: The Financial Statements tab in the business's financial model provides a comprehensive representation of the company's financial performance and position over a five-year period. It consolidates crucial information through:
• Monthly and annual profit & loss statement,
• Monthly and annual balance sheet
• Monthly and annual cash flow statement
These tabs serve as the cornerstone for decision-making, offering a holistic view of the business's revenues, expenses, assets, liabilities, and cash flows monthly. They enable the management team and stakeholders to analyze trends, make informed strategic choices, and ensure the long-term financial health and sustainability of the business.
5. Calculation Tabs: The calculations tabs section within the business's financial model serves as the backbone for the financial statements, offering detailed and granular calculations for key financial line items essential for accurate forecasting and planning. These tabs include:
• Revenue projections
• Cost of revenue
• Staffing expenses
• Capex (Capital expenditure)
• Debt Amortization
• Income Tax
6. Graphs Tabs: The Graphs Tabs section in our financial model represents a dynamic and visually insightful dimension of our financial analysis toolkit. This section includes a suite of tabs, each designed to provide a comprehensive overview of the business's operating and financial performance. The graphs tab include:
• KPIs Overview: This tab provides a comprehensive visual analysis of critical performance indicators. It covers a range of metrics for the business, including number of barber stations, number of services, number of services hours and employee productivity analysis.
• Revenue Analytics: The Revenue Analytics tab features graphs that offer an intricate visual portrayal of the company's revenue dynamics. These graphs facilitate a deeper understanding of revenue sources, trends, and potential growth avenues. This tab provides a detailed breakdown of revenue across various products and services, across various client segments and includes a revenue waterfall, among other insights.
• Profitability Analysis: Offering a dynamic visual exploration of the company's profitability landscape, this tab enables a quick assessment of profitability drivers and potential areas of improvement. It includes detailed graphs of key profitability metrics such as gross profit, EBITDA, net profit, profit margins, and a net income bridge. These visualizations help in identifying trends and analyzing the impact of distinct factors on the company's overall profitability.
• Expense Composition Analysis: The Expense Composition Analysis tab features graphs that concentrate on major expense items, offering insights to fine-tune cost structures and make informed decisions on expenditure management. These graphs provide a detailed view of expenses in terms of their absolute amounts, their proportions relative to total revenue, and their percentages of total expenses. This comprehensive analysis aids in identifying areas for cost optimization and understanding the impact of different expenses on the company's financial health.
• Cash Flow Dynamics: This tab visualizes cash flow dynamics, including year-wise breakdowns of operating, financing, and investing activities. It tracks monthly closing cash balances and provides comprehensive graphs of yearly unlevered free cash flows. Additionally, the tab offers insights into the sources and uses of cash, helping to identify trends and forecast future cash positions.
• Balance Sheet Insights: Offering a visual representation of the balance sheet dynamics, this section provides insights into assets, liabilities, and equity changes over time.
Besides year-wise graphs, the above-mentioned graph tabs also contain month-wise graphs where you can input the start and end months. These graphs are tailored for compatibility with Excel for Microsoft 365 and Excel 2021, allowing you to explore month-wise trends.
Technical Specification:
• No VBA or Macros: The model is devoid of any VBA or macro components.
• Circular Reference-Free: The model does not contain any circular reference.
• Excel Compatibility: The model is compatible with Microsoft Excel 2010 and later versions, with the following notes:
• Graphs with start and end month dropdowns and thresholds in the Expenses Composition Analysis tab are fully functional only in Excel 2021 and Microsoft 365.
• While most features work seamlessly across versions, some charts may have minor formatting and data label variations in versions earlier than Excel 2021.
Should any challenges arise while navigating or utilizing this financial model, our dedicated support team is readily available. We commit to getting back to you as soon as possible to ensure a seamless experience. For tailored solutions to your specific business requirements, kindly reach out to us with a concise overview of your needs. Your success is our priority, and we look forward to supporting your financial endeavors.
Got a question about the product? Email us at support@flevy.com or ask the author directly by using the "Ask the Author a Question" form. If you cannot view the preview above this document description, go here to view the large preview instead.
Source: Best Practices in Integrated Financial Model Excel: Barber Shop Financial Model Excel (XLSX) Spreadsheet, ExcelFinModels
ABOUT THE AUTHOR
I am a finance professional with over 15 years of experience in financial modeling, analysis, planning, budgeting, and forecasting on various freelancing platforms. I have assisted over 500 start-ups and SMBs across diverse industries in securing over $1 billion in funding, internal planning, financial reporting, and strategy formulation. Additionally, I have provided services to numerous ... [read more]
Ask the Author a Question
You must be logged in to contact the author.
